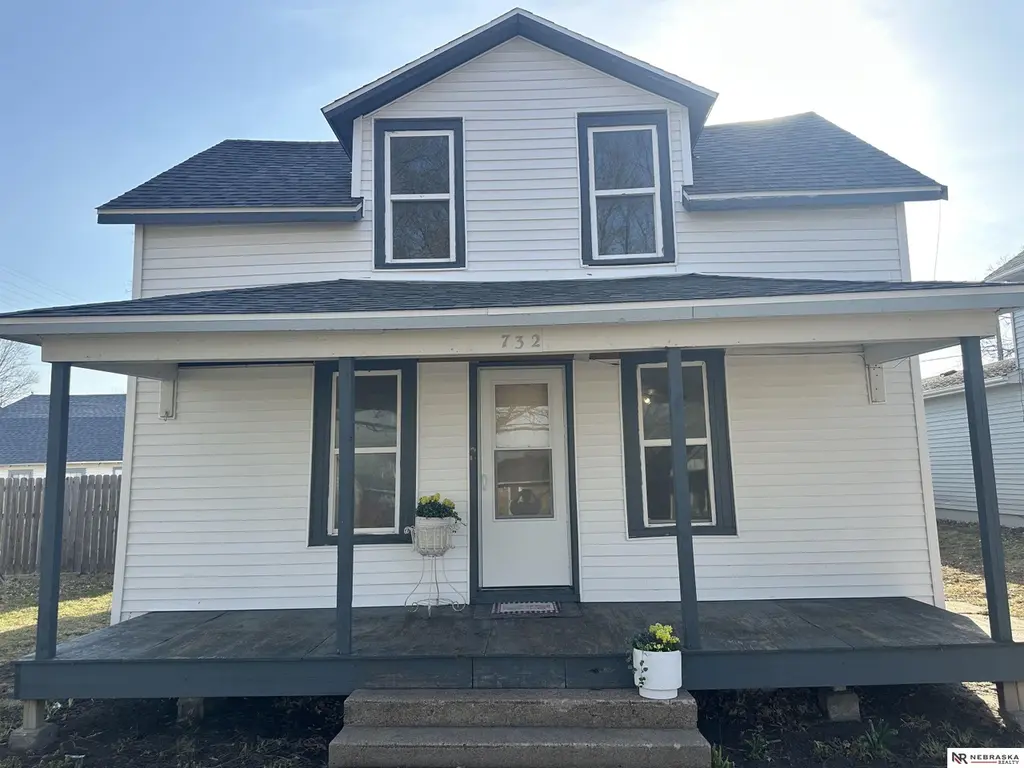
732 N Grant St · Fremont, NE
Flood risk 1/10 · Minimal
- FEMA flood zone
- X (shaded)
- Chance of flooding over 30 yrs
- 0.0%
- Est. flood insurance / yr
- $507 – $1,088
Fire risk 1/10 · Minimal
- Est. fire insurance / yr
- $1,161 – $2,155
Heat risk 3/10 · Minor
- Hot days now (above 103°F)
- 7 days/yr
- Hot days in 30 yrs
- 16 days/yr
Wind risk 2/10 · Minimal
- Chance of severe wind over 30 yrs
- —
Air-quality risk 1/10 · Minimal
- Unhealthy air days now
- 0 days/yr
- Unhealthy air days in 30 yrs
- 0 days/yr
Risk factors via First Street. Map © Google.
Why this score? — see what drove the B- grade
The composite is a weighted blend of 9 inputs, each scored 0–100. Each bar is that input's sub-score; the figure is the points it added to the 100-point composite (weight × sub-score).
- Cash flow +26.4/30.0
- ARV discount +15.0/15.0
- DSCR +9.0/10.0
- 1% rule +6.9/10.0
- Livability +3.8/5.0
- Schools +3.0/10.0
- Condition / age +2.5/5.0
- Rent growth +2.0/5.0
- Appreciation +0.0/10.0
$120,000
🖨 Deal sheet 📄 Offer letter ✓ Due diligence
Listing remarks MLS
This 3 bed, 2 full bath home with large front porch and detached large 2 car garage is priced to sell. Investors looking to expand your portfolio this is the one.
Key facts
- 5,663 sq ft lot
- 2 garage spots
- Built 1900
Neighborhood map
What this means for you Summary
Snapshot
- This is a 3-bed/1.0-bath single-family listed at $120k.
Deal economics
- At list price, monthly cash flow is $313 ($4k/yr) — positive.
- The deal already cash-flows at list — no discount required.
- Meets the 1% rule at list price ($1k rent vs $120k).
- Recommended offer: $113k (6.0% below list) — sets the bar for market timing.
- Cap rate 9.4% vs local median 3.3% in Fremont — top-decile yield for the area; either an underpriced asset or a hidden risk that comps aren't pricing in. Stress-test before assuming the spread holds.
Location & tenants
- Location reads 76/100 on livability (#92 in NE, #3,751 nationally) — a middle-class / working-renter tenant base. Strengths: cost of living A+, housing A+, health & safety A+; Watch: schools C-, employment D+, commute F.
- Fremont Public Schools (town): math 34% / reading 36% proficiency, ranked #103 of 111 in NE (top 93%) — families likely to look elsewhere, expect single-tenant / working-renter base with shorter leases.
- Market conditions: Rents soft (-2.1%/yr); 238 active listings in the ZIP; 4 comparable units currently listed for rent nearby; rentals leasing fast (median 4d on market — plan ~1-2 weeks tenant-placement turnaround); 82 units permitted in Dodge County in 2024 (0 in 5+ unit buildings).
Forward outlook
- Local home prices are declining (-3.0%/yr); year-one equity from $830 of loan paydown is wiped out by about $4k of value loss. Plan a longer hold.
Negotiation context
- It's been on market 86 days — a 6% lower offer ($113k) is reasonable based on typical stale-listing flexibility.
- Current owner paid $41k; list at $120k implies a 192% gain — meaningful room to come down on a strong offer.
Risks & watch-outs
- Watch-outs: built in 1900 — expect roof / HVAC / electrical / plumbing capex.
Questions for the listing agent
- It's been on market 86 days. Have you received any prior offers? Is the seller open to a 6% concession, seller financing, or rate buy-down credit?
- Built in 1900 — when were the roof, HVAC, electrical panel, plumbing, and water heater last replaced?
- Why hasn't it sold? Are there any deal-killer items the seller is aware of (foundation, flood, title, zoning, code violations)?
- Is there a deadline driving the sale (1031 exchange, divorce, estate, relocation)? That informs how much negotiation room exists.
- What's the average days-on-market for RENTAL listings here right now (not sales)? A rising rental-DOM trend means longer vacancies and softer asking-rent achievability than the comps imply.
- What's the recent tenant-quality profile in this submarket — average credit score on applications, eviction rate, late-payment / NSF rate, and stable-employment percentage? A property-management company in the area should have these aggregated.
- How much new for-sale + rental construction is in the pipeline within 1–3 miles? Heavy new supply typically softens prices + rents 12–24 months out; constrained supply supports both.
Investment metrics
- 1% rule
- 1.19% ✓
- Cap rate
- 9.42%
- Cash-on-cash
- 11.16%
- DSCR
- 1.50
- GRM
- 7.0
CMA / ARV
- ARV (median comp)
- $175,927
- List price
- $120,000
- Delta
- -31.79%
- Verdict
- UNDERPRICED
- Comps
- 20 within 1.0 mi
Show comp detail 12 sales within ~0.75 mi
| Address | Dist | Beds/Ba | Sqft | Sold | Price | $/sf | Match |
|---|---|---|---|---|---|---|---|
| 805 N Hancock St | 0.05mi | 3/1.0 | 1,212 (-7%) | 1mo | $115,000 | $95 | 85 |
| 1208 - 1210 E 9th St | 0.10mi | 4/1.0 (+1) | 1,356 (+4%) | 3mo | $175,000 | $129 | 81 |
| 535 N Pebble St | 0.23mi | 3/2.0 | 1,248 (-4%) | 3mo | $162,319 | $130 | 76 |
| 141 N Lincoln St | 0.43mi | 3/1.0 | 1,332 (+2%) | 3mo | $197,500 | $148 | 74 |
| 830 N Grant St | 0.05mi | 2/1.0 (-1) | 1,440 (+10%) | 2mo | $250,000 | $174 | 74 |
| 1136 N Garfield St | 0.29mi | 2/2.0 (-1) | 1,244 (-5%) | 1mo | $230,000 | $185 | 69 |
| 1225 E 10th St | 0.14mi | 2/1.0 (-1) | 1,146 (-12%) | 1mo | $195,000 | $170 | 68 |
| 1115 N Logan St | 0.36mi | 4/2.0 (+1) | 1,255 (-4%) | 3mo | $198,000 | $158 | 66 |
| 1536 E 1st St | 0.45mi | 2/1.0 (-1) | 1,227 (-6%) | 2mo | $165,000 | $134 | 62 |
| 315 N Grant St | 0.29mi | 4/2.0 (+1) | 1,182 (-9%) | 1mo | $225,000 | $190 | 62 |
| 850 N D St | 0.66mi | 3/2.0 | 1,334 (+2%) | 3mo | $196,000 | $147 | 59 |
| 406 E 14th St | 0.72mi | 3/1.0 | 1,114 (-15%) | 2mo | $168,000 | $151 | 40 |
Match score weights: distance 35% · size 25% · config 20% · recency 20%. Top-matched comps best support the ARV.
Projected returns pro-forma
-3.0% appreciation · 0.0% rent growth · sell at horizon
- IRR
- -3.0%
- Equity multiple
- 0.89×
- Total profit
- $-3,704
- Equity at exit
- $17,892
- IRR
- 3.0%
- Equity multiple
- 1.19×
- Total profit
- $6,300
- Equity at exit
- $10,375
Cash invested: $33,600 (down + closing). Projections, not guarantees.
Landlord ↔ Tenant lean methodology
- Overall (STATE)
- 83 Strongly Landlord-Friendly
- State Nebraska
- 83 Strongly Landlord-Friendly · R+13
- County
- — inherits STATE
- City
- — inherits STATE
ZIP-level market 68025
- Home prices YoY
- -34.1%
- Rents YoY
- -2.1%
- Active inventory
- 238
- Price-to-rent
- 7.0×
Monthly cashflow live
- Estimated rent
- $1,427 medium interval (Pro) →
- Mortgage (P&I)
- −$629
- Tax from tax record
- −$136 /mo · $1,627/yr
- Insurance
- −$50
- HOA
- −$0
- Vacancy / Maint / Mgmt
- −$300
- Net cashflow
- $313
Break-even live
UW: 25.0% down · 7.5% · 30yr · 1.5% tax · 5.0% vac · 8.0% maint · 8.0% mgmt
Financing live
Cash to close
- Down payment
- $30,000
- Closing costs
- $3,600
- Reserves months
- —
- Total cash needed
- —
Loan-product check · same deal, 3 products live
Conventional
25% down · 7.5% · 30yr
- Down + closing
- —
- Monthly P&I
- —
- Monthly cashflow
- —
- DSCR
- —
- Eligible?
- —
Personal DTI + credit; lowest rate.
DSCR
20% down · 8.5% · 30yr
- Down + closing
- —
- Monthly P&I
- —
- Monthly cashflow
- —
- DSCR
- —
- Eligible?
- —
No personal income docs; deal must DSCR.
Hard money
10% down · 12.0% · 12mo
- Down + closing
- —
- Monthly P&I
- —
- Monthly cashflow
- —
- DSCR
- —
- Eligible?
- —
Short-term bridge; refi at stabilization.
Rent comps 4 comps
| Address | Beds | Baths | Sqft | Rent | $/sqft | DOM | Units | Dist |
|---|---|---|---|---|---|---|---|---|
| 1619 E Military Ave Unit 2301 Fremont, NE | 2.0 | 2.0 | 1100 | $1,195 | $1.09 | 21d | 1 | 0.30mi |
| 351 N Clarmar Ave Fremont, NE | 3.0 | 2.5 | 1847 | $1,745 | $0.94 | 3d | 1 | 0.43mi |
| 1021 S Howard St Fremont, NE | 1.0–3.0 | 1.0–2.0 | 1038 | $1,610 | $1.55 | 1d | 11 | 1.17mi |
| 1034e 29th St Fremont, NE | 1.0–2.0 | 1.0 | 1019 | $1,225 | $1.20 | 1d | 21 | 1.50mi |
Listing history 21 events
-
2026-06-19days on market $120,000 Active 86 DOM
-
2026-06-18days on market $120,000 Active 85 DOM
-
2026-06-17days on market $120,000 Active 84 DOM
-
2026-06-16days on market $120,000 Active 83 DOM
-
2026-06-15days on market $120,000 Active 82 DOM
-
2026-06-14days on market $120,000 Active 80 DOM
-
2026-06-12days on market $120,000 Active 79 DOM
-
2026-06-09days on market $120,000 Active 76 DOM
-
2026-06-08days on market $120,000 Active 75 DOM
-
2026-06-07days on market $120,000 Active 74 DOM
-
2026-06-05days on market $120,000 Active 71 DOM
-
2026-06-03days on market $120,000 Active 70 DOM
-
2026-06-02days on market $120,000 Active 69 DOM
-
2026-06-01days on market $120,000 Active 68 DOM
-
2026-05-31days on market $120,000 Active 67 DOM
-
2026-05-30days on market $120,000 Active 66 DOM
-
2026-04-17price $120,000 162-char remark
Show marketing remark (162 chars)
This 3 bed, 2 full bath home with large front porch and detached large 2 car garage is priced to sell. Investors looking to expand your portfolio this is the one.
-
2026-04-03price $135,000 162-char remark
Show marketing remark (162 chars)
This 3 bed, 2 full bath home with large front porch and detached large 2 car garage is priced to sell. Investors looking to expand your portfolio this is the one.
-
2026-03-24$149,900 New 162-char remark
Show marketing remark (162 chars)
This 3 bed, 2 full bath home with large front porch and detached large 2 car garage is priced to sell. Investors looking to expand your portfolio this is the one.
-
2002-01-24soldstatus $41,105
-
1993-03-25soldstatus $16,000
ⓘ Source: listings_history table (triggers on properties + properties_extension) + one-shot
backfill from property_details.listing_events for pre-trigger history.
Tax reassessment forecast NE · Resets to sale price
- Current annual tax
- $1,627 · $136/mo
- Projected year-2 tax
- $2,076 · $173/mo
- Expected delta
- +$449/yr (+$37/mo · 27.6%)
ⓘ Screening estimate from a state-policy table — verify with the county assessor before closing.
Climate risk First Street
- Flood 1/10 Low FEMA zone X (shaded) · 0% chance over 30 yrs
- Wildfire 1/10 Low
- Heat 3/10 Moderate 7 d/yr ≥103°F today · 16 d/yr by 30 yrs out
- Wind 2/10 Low
- Air quality 1/10 Low 0 unhealthy d/yr today · 0 by 30 yrs out
Nearby sold comps map
Loading sold comps map…
Walkable amenities ~0.75 mi
Loading nearby amenities…
Taxation est. · year 1
- Rental income
- $17,126
- − Mortgage interest
- −$6,722
- − Property taxes
- −$1,627
- − Insurance
- −$600
- − Repairs & maintenance
- −$1,370
- − Management
- −$1,370
- − Depreciation
- −$3,491
- Taxable income
- $1,946
- Est. tax owed @ 24.0%
- −$467
- After-tax cash flow
- $3,284/yr
For passive investors: Depreciation is non-cash, so a rental often shows a tax loss while cash-flowing — sheltering income. Rental losses are passive: they offset passive income freely, and up to $25,000/yr can offset ordinary (W-2) income if you actively participate and your MAGI is under $100k (phasing out to $0 by $150k); unused losses carry forward. On sale, claimed depreciation is recaptured at up to 25%, and gains may owe capital-gains tax (a 1031 exchange can defer both). Figures are a year-1 estimate at your 24.0% rate — not tax advice; consult a CPA.
Schools (NCES district)
- District
- Fremont Public Schools
- NCES district ID
- 3170710
- Math proficiency
- 34% ▼ -8.00%
- Reading proficiency
- 36% ▲ 1.00%
- Median HH income
- $47,111
- Composite
- 30.07/100
- National rank
- #6347
- State rank
- #103 of 111 in NE
Livability — Fremont
- Score
- 76/100
- State rank
- #92
- US rank
- #3751
Category grades
Schools grade is shown separately in the Schools card above.
Census & demographics
- Census place
- Fremont, NE
- County
- Dodge County · 31,658 people
- City population
- 31,658
- Metro
- Fremont, NE
- Population (ZIP)
- 31,658
- Household income
- $72,254
- Rent vs Own
- Severe rent burden
- 893.0
Population outlook (Dodge County) Hauer SSP2
- Today (2025)
- 37,191 people
- By 2030
- 37,238 · +0.1%
- By 2040
- 37,256 · +0.2%
- By 2050
- 37,494 · +0.8%
- By 2075
- 39,165 · +5.3%
- By 2100
- 40,221 · +8.1%
Race, ethnicity, and origin ACS 2023
- Neighborhood character
- Predominantly White (78%)
- Race & ethnicity
- White 78% Hispanic / Latino 18% Two or more races 7% Native American 2%
- Hispanic origin (detail)
- Mexican 10%
- Common ancestry
- Portuguese 2% Lithuanian 2% Romanian 2%
- Foreign-born
- 7% · Canada
- Languages at home
- 84% English-only · Spanish 14%
Political lean MEDSL · Dodge
- 2024 margin
- Solid R (+32.6) · D 33.0% · R 65.7% · Other 1.3%
- 2008→2024 swing
- -20.6pp toward R · 2008: -12.0pp · 2024: -32.6pp
- All cycles
- 2024: R+32.6 2020: R+32.1 2016: R+35.3 2012: R+22.7 2008: R+12.0
Not yet ingested
- Civics
- —
Market trends
- HPI YoY
- ▼ -164.59%
- Current HPI
- 318.3329
- Rent YoY
- ▼ -2.14%
- Metro
- Fremont, NE
- State GDP YoY
- ▲ 0.68%
- F500 in state
- 2
Industry mix (Fortune 500 HQ in NE)
| Industry | F500 HQs | Revenue |
|---|---|---|
| Conglomerate | 1 | $371B |
|
||
Price history
+650.0% since first listed5 events — show timeline
- 2026-04-17 Price Changed $120,000 GPRMLS
- 2026-04-03 Price Changed $135,000 GPRMLS
- 2026-03-24 Listed $149,900 GPRMLS
- 2002-01-24 Sold (Public Records) $41,105 Public Records
- 1993-03-25 Sold (Public Records) $16,000 Public Records
Property tax history
+5.6%/yrLatest (2025): $1,627 · +40.3% YoY. Source: county tax records.
Cash-flow waterfall
monthlySold comps — $/sqft
last 12 mo · ≤1 miLoading sold comps…