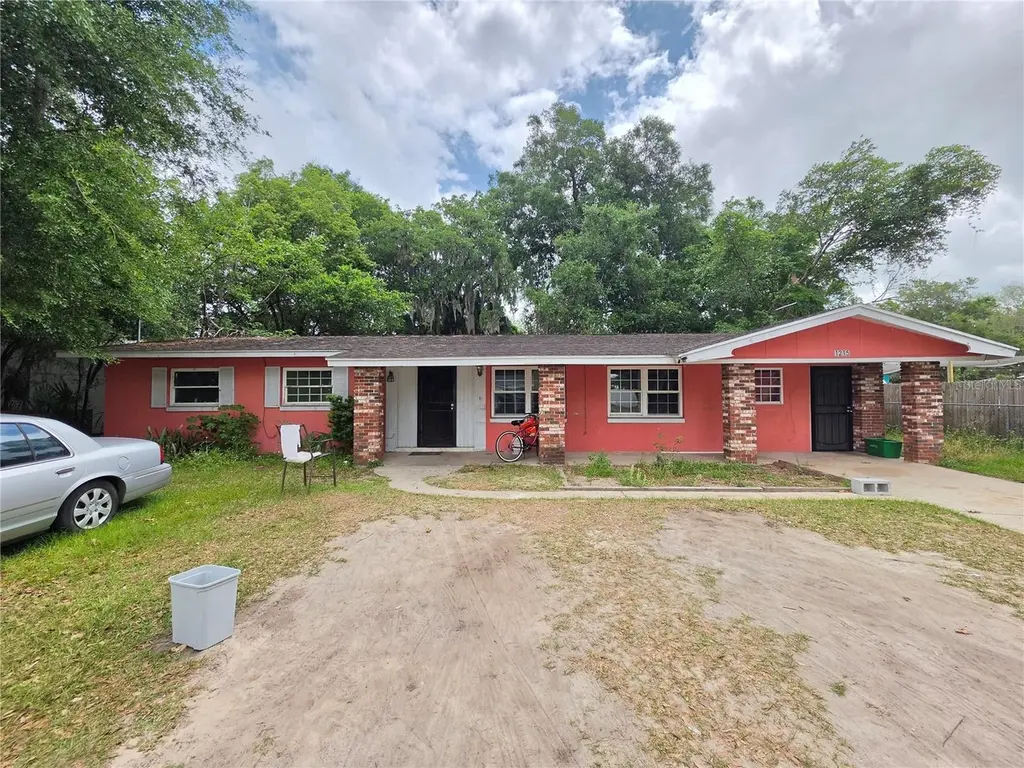
1215 NW 15th Ave · Ocala, FL
Flood risk 1/10 · Minimal
- FEMA flood zone
- X (unshaded)
- Chance of flooding over 30 yrs
- 0.0%
- Est. flood insurance / yr
- $507 – $1,088
Fire risk 4/10 · Minor
- Est. fire insurance / yr
- $947 – $1,759
Heat risk 8/10 · Major
- Hot days now (above 107°F)
- 7 days/yr
- Hot days in 30 yrs
- 23 days/yr
Wind risk 9/10 · Severe
- Chance of severe wind over 30 yrs
- 99.0%
Air-quality risk 3/10 · Minor
- Unhealthy air days now
- 3 days/yr
- Unhealthy air days in 30 yrs
- 3 days/yr
Risk factors via First Street. Map © Google.
Why this score? — see what drove the C+ grade
The composite is a weighted blend of 9 inputs, each scored 0–100. Each bar is that input's sub-score; the figure is the points it added to the 100-point composite (weight × sub-score).
- Cash flow +25.7/30.0
- DSCR +8.5/10.0
- ARV discount +7.5/15.0
- 1% rule +7.0/10.0
- Schools +3.6/10.0
- Livability +3.5/5.0
- Rent growth +2.5/5.0
- Condition / age +2.5/5.0
- Appreciation +0.0/10.0
$169,000
🖨 Deal sheet 📄 Offer letter ✓ Due diligence
Listing remarks MLS
DON'T MISS OUT ON THIS GREAT OPPORTUNITY . THIS 4/2 IS PRICED RIGHT TO SELL. THIS IS A INCOME PRODUCING PROPERTY CURRENTLY PRODUCING $3,000 OR MORE MONTHLY INCOME AND TENANTS WANT TO STAY. THIS IS A AS IS PROPERTY SELLER WILL NOT PAY FOR ANY REPAIRS. PLEASE CHECK PUBLIC RECORDS FOR ACCURACY OF THIS LISTING. OCALA REALTY WORLD IS NOT LIABLE FOR ANY INACCURACY OF LISTING.
Key facts
- 8,276 sq ft lot
- Built 1967
- Listed 29 days
Property features AI
Finance
- Other: Zoned R1A
- Financial info: No lease restrictions; Homestead exempt
- HOA & community: No association; No association approval required
Exterior
- Parking: Open parking; Oversized parking pad; Other parking
- Utilities: Public water; Public sewer; Cable available; Electricity available; Water available
- Home design: Single family residence; One story; Faces northwest; Residential property
- Construction: Block construction; Shingle roof; Slab foundation; Built on lot approximately 0.19 acres (80 x 105)
- Exterior features: Other exterior features; Asphalt/paved road access
Interior
- Kitchen: Other appliances
- Bedrooms: 4 bedrooms
- Flooring: Ceramic tile; Vinyl
- Bathrooms: 2 full baths, 1 half bath
- Heating & cooling: Central heating; Central air conditioning
- Interior features: Other interior features
- Laundry & utility: Other laundry features
Neighborhood map
What this means for you Summary
Snapshot
- This is a 4-bed/2.0-bath single-family listed at $169k.
Deal economics
- At list price, monthly cash flow is $402 ($5k/yr) — positive.
- The deal already cash-flows at list — no discount required.
- Meets the 1% rule at list price ($2k rent vs $169k).
- Recommended offer: $166k (1.5% below list) — sets the bar for market timing.
- Cap rate 9.1% vs local median 4.2% in Ocala — top-decile yield for the area; either an underpriced asset or a hidden risk that comps aren't pricing in. Stress-test before assuming the spread holds.
Location & tenants
- Location reads 69/100 on livability (#476 in FL) — a middle-class / working-renter tenant base. Strengths: cost of living A+, housing A+, health & safety A+; Watch: crime F, amenities F, commute F.
- Marion (rural): math 42% / reading 43% proficiency, ranked #61 of 73 in FL (top 84%) — families likely to look elsewhere, expect single-tenant / working-renter base with shorter leases; 61% free/reduced lunch — lower-income household profile, screen leases tightly.
- Zoned schools: South Ocala Elementary School (math 45% / reading 43%, grade F, #1,330 of 2,144 statewide, top 63%, 715 students, 60% FRL); Vanguard High School (math 22% / reading 48%, grade F, #379 of 667 statewide, top 58%, 1,661 students, 59% FRL) — zoned schools at 60% FRL track the district average.
- Market conditions: 199 active listings in the ZIP; 6 comparable units currently listed for rent nearby; rentals at typical pace (median 21d on market — plan ~3-4 weeks tenant-placement turnaround); lower-income renter base — watch delinquency; 7,071 units permitted in Marion County in 2024 (534 in 5+ unit buildings).
- At $2,030/mo this rent would consume 81% of the median local household income ($30k/yr) (locally 923% of renters already pay >50% of income on rent) — very limited rent-growth headroom before tenants either downsize or default.
Forward outlook
- Local home prices are declining (-3.0%/yr); year-one equity from $1k of loan paydown is wiped out by about $5k of value loss. Plan a longer hold.
- Marion County population projected at +13% by 2050 — modest demand growth; plan on rents tracking national, not racing it.
Negotiation context
- It's been on market 29 days — a 2% lower offer ($166k) is reasonable based on typical stale-listing flexibility.
- 11 sale attempts since 14y ago with the ask held roughly flat each time — persistent listings suggest the price (not the market) is what's stuck; bring a comps-based counter.
Risks & watch-outs
- Climate carrying-cost: severe wind risk, 99% chance of damaging wind over 30y; extreme-heat days projected 7→23/yr by 2055 (HVAC capex compounding) — expect insurance premiums to compound above CPI over the hold.
Questions for the listing agent
- Built in 1967 — when were the roof, HVAC, electrical panel, plumbing, and water heater last replaced?
- Is there a deadline driving the sale (1031 exchange, divorce, estate, relocation)? That informs how much negotiation room exists.
- Crime grade is F in this area — have there been break-ins, vandalism, or insurance claims at this property in the last 3 years? What carrier currently insures it and at what premium?
- What's the average days-on-market for RENTAL listings here right now (not sales)? A rising rental-DOM trend means longer vacancies and softer asking-rent achievability than the comps imply.
- What's the recent tenant-quality profile in this submarket — average credit score on applications, eviction rate, late-payment / NSF rate, and stable-employment percentage? A property-management company in the area should have these aggregated.
- How much new for-sale + rental construction is in the pipeline within 1–3 miles? Heavy new supply typically softens prices + rents 12–24 months out; constrained supply supports both.
Investment metrics
- 1% rule
- 1.20% ✓
- Cap rate
- 9.15%
- Cash-on-cash
- 10.20%
- DSCR
- 1.45
- GRM
- 6.9
CMA / ARV
No comps found within radius.
Projected returns pro-forma
-3.0% appreciation · 3.0% rent growth · sell at horizon
- IRR
- -1.0%
- Equity multiple
- 0.96×
- Total profit
- $-1,715
- Equity at exit
- $25,198
- IRR
- 8.7%
- Equity multiple
- 1.67×
- Total profit
- $31,703
- Equity at exit
- $14,612
Cash invested: $47,320 (down + closing). Projections, not guarantees.
Landlord ↔ Tenant lean methodology
- Overall (STATE)
- 87 Strongly Landlord-Friendly
- State Florida
- 87 Strongly Landlord-Friendly · R+3
- County
- — inherits STATE
- City
- — inherits STATE
ZIP-level market 34475
- Home prices YoY
- -8.0%
- Active inventory
- 199
- Price-to-rent
- 6.9×
Monthly cashflow live
- Estimated rent
- $2,030 high interval (Pro) →
- Mortgage (P&I)
- −$886
- Tax from tax record
- −$245 /mo · $2,940/yr
- Insurance
- −$70
- HOA
- −$0
- Vacancy / Maint / Mgmt
- −$426
- Net cashflow
- $402
Break-even live
UW: 25.0% down · 7.5% · 30yr · 1.5% tax · 5.0% vac · 8.0% maint · 8.0% mgmt
Financing live
Cash to close
- Down payment
- $42,250
- Closing costs
- $5,070
- Reserves months
- —
- Total cash needed
- —
Loan-product check · same deal, 3 products live
Conventional
25% down · 7.5% · 30yr
- Down + closing
- —
- Monthly P&I
- —
- Monthly cashflow
- —
- DSCR
- —
- Eligible?
- —
Personal DTI + credit; lowest rate.
DSCR
20% down · 8.5% · 30yr
- Down + closing
- —
- Monthly P&I
- —
- Monthly cashflow
- —
- DSCR
- —
- Eligible?
- —
No personal income docs; deal must DSCR.
Hard money
10% down · 12.0% · 12mo
- Down + closing
- —
- Monthly P&I
- —
- Monthly cashflow
- —
- DSCR
- —
- Eligible?
- —
Short-term bridge; refi at stabilization.
Rent comps 6 comps
| Address | Beds | Baths | Sqft | Rent | $/sqft | DOM | Units | Dist |
|---|---|---|---|---|---|---|---|---|
| 714 NW 1st St Ocala, FL | 3.0 | 2.0 | 1444 | $2,200 | $1.52 | 13d | 1 | 0.86mi |
| 1683 SW 3rd St Ocala, FL | 4.0 | 2.0 | 1636 | $2,200 | $1.34 | 21d | 1 | 1.04mi |
| 1221 SE 5th St Ocala, FL | 3.0 | 2.0 | 1900 | $2,350 | $1.24 | 13d | 1 | 1.12mi |
| 2491 Nw 23rd Ave , FL | 4.0 | 2.0 | 1811 | $2,045 | $1.13 | 21d | 1 | 1.15mi |
| 339 NE Sanchez Ave Unit 111 Ocala, FL | 3.0 | 3.0 | 1422 | $1,649 | $1.16 | 21d | 1 | 1.34mi |
| 710 NE 4th St Unit 101 Ocala, FL | 3.0 | 3.0 | 1422 | $1,575 | $1.11 | 21d | 1 | 1.34mi |
Listing history 36 events
-
2026-06-18days on market $169,000 Active 29 DOM
-
2026-06-17days on market $169,000 Active 28 DOM
-
2026-06-16days on market $169,000 Active 27 DOM
-
2026-06-15days on market $169,000 Active 26 DOM
-
2026-06-14days on market $169,000 Active 24 DOM
-
2026-06-13pricedays on market $169,000 Active 23 DOM
-
2026-06-10days on market $169,990 Active 21 DOM
-
2026-06-09days on market $169,990 Active 20 DOM
-
2026-06-08days on market $169,990 Active 19 DOM
-
2026-06-07days on market $169,990 Active 18 DOM
-
2026-06-03days on market $169,990 Active 14 DOM
-
2026-06-02days on market $169,990 Active 13 DOM
-
2026-06-01days on market $169,990 Active 12 DOM
-
2026-05-31days on market $169,990 Active 11 DOM
-
2026-05-30days on market $169,990 Active 10 DOM
-
2026-05-20$169,990 Active
-
2024-10-15soldstatus $150,000 Closed 372-char remark
Show marketing remark (372 chars)
DON'T MISS OUT ON THIS GREAT OPPORTUNITY . THIS 4/2 IS PRICED RIGHT TO SELL. THIS IS A INCOME PRODUCING PROPERTY CURRENTLY PRODUCING $3,000 OR MORE MONTHLY INCOME AND TENANTS WANT TO STAY. THIS IS A AS IS PROPERTY SELLER WILL NOT PAY FOR ANY REPAIRS. PLEASE CHECK PUBLIC RECORDS FOR ACCURACY OF THIS LISTING. OCALA REALTY WORLD IS NOT LIABLE FOR ANY INACCURACY OF LISTING.
-
2024-09-30status Pending 372-char remark
Show marketing remark (372 chars)
DON'T MISS OUT ON THIS GREAT OPPORTUNITY . THIS 4/2 IS PRICED RIGHT TO SELL. THIS IS A INCOME PRODUCING PROPERTY CURRENTLY PRODUCING $3,000 OR MORE MONTHLY INCOME AND TENANTS WANT TO STAY. THIS IS A AS IS PROPERTY SELLER WILL NOT PAY FOR ANY REPAIRS. PLEASE CHECK PUBLIC RECORDS FOR ACCURACY OF THIS LISTING. OCALA REALTY WORLD IS NOT LIABLE FOR ANY INACCURACY OF LISTING.
-
2024-09-30status Active 372-char remark
Show marketing remark (372 chars)
DON'T MISS OUT ON THIS GREAT OPPORTUNITY . THIS 4/2 IS PRICED RIGHT TO SELL. THIS IS A INCOME PRODUCING PROPERTY CURRENTLY PRODUCING $3,000 OR MORE MONTHLY INCOME AND TENANTS WANT TO STAY. THIS IS A AS IS PROPERTY SELLER WILL NOT PAY FOR ANY REPAIRS. PLEASE CHECK PUBLIC RECORDS FOR ACCURACY OF THIS LISTING. OCALA REALTY WORLD IS NOT LIABLE FOR ANY INACCURACY OF LISTING.
-
2024-09-30status Pending 372-char remark
Show marketing remark (372 chars)
DON'T MISS OUT ON THIS GREAT OPPORTUNITY . THIS 4/2 IS PRICED RIGHT TO SELL. THIS IS A INCOME PRODUCING PROPERTY CURRENTLY PRODUCING $3,000 OR MORE MONTHLY INCOME AND TENANTS WANT TO STAY. THIS IS A AS IS PROPERTY SELLER WILL NOT PAY FOR ANY REPAIRS. PLEASE CHECK PUBLIC RECORDS FOR ACCURACY OF THIS LISTING. OCALA REALTY WORLD IS NOT LIABLE FOR ANY INACCURACY OF LISTING.
-
2024-09-25$155,000 Active 372-char remark
Show marketing remark (372 chars)
DON'T MISS OUT ON THIS GREAT OPPORTUNITY . THIS 4/2 IS PRICED RIGHT TO SELL. THIS IS A INCOME PRODUCING PROPERTY CURRENTLY PRODUCING $3,000 OR MORE MONTHLY INCOME AND TENANTS WANT TO STAY. THIS IS A AS IS PROPERTY SELLER WILL NOT PAY FOR ANY REPAIRS. PLEASE CHECK PUBLIC RECORDS FOR ACCURACY OF THIS LISTING. OCALA REALTY WORLD IS NOT LIABLE FOR ANY INACCURACY OF LISTING.
-
2024-06-19status Active
-
2024-03-09status Active
-
2024-01-21status Pending
-
2023-11-22$199,000 Active
-
2013-03-19soldstatus $13,500
-
2012-12-17$20,000
-
2012-12-14historical
-
2012-10-19historical
-
2012-09-14historical
-
2012-09-12$25,000
-
2012-09-12$25,000
-
2012-09-11historical
-
2012-08-01$30,000
-
2012-04-24$35,000
-
1996-09-25soldstatus $54,000
ⓘ Source: listings_history table (triggers on properties + properties_extension) + one-shot
backfill from property_details.listing_events for pre-trigger history.
Tax reassessment forecast FL · Resets to sale price
- Current annual tax
- $2,940 · $245/mo
- Projected year-2 tax
- $2,940 · $245/mo
- Expected delta
- $0/yr ($0/mo · 0.0%)
ⓘ Screening estimate from a state-policy table — verify with the county assessor before closing.
Climate risk First Street
- Flood 1/10 Low FEMA zone X (unshaded) · 0% chance over 30 yrs
- Wildfire 4/10 Moderate
- Heat 8/10 Severe 7 d/yr ≥107°F today · 23 d/yr by 30 yrs out
- Wind 9/10 Extreme 99% chance of damaging wind over 30 yrs
- Air quality 3/10 Moderate 3 unhealthy d/yr today · 3 by 30 yrs out
Nearby sold comps map
Loading sold comps map…
Walkable amenities ~0.75 mi
Loading nearby amenities…
Taxation est. · year 1
- Rental income
- $24,363
- − Mortgage interest
- −$9,467
- − Property taxes
- −$2,940
- − Insurance
- −$845
- − Repairs & maintenance
- −$1,949
- − Management
- −$1,949
- − Depreciation
- −$4,916
- Taxable income
- $2,297
- Est. tax owed @ 24.0%
- −$551
- After-tax cash flow
- $4,276/yr
For passive investors: Depreciation is non-cash, so a rental often shows a tax loss while cash-flowing — sheltering income. Rental losses are passive: they offset passive income freely, and up to $25,000/yr can offset ordinary (W-2) income if you actively participate and your MAGI is under $100k (phasing out to $0 by $150k); unused losses carry forward. On sale, claimed depreciation is recaptured at up to 25%, and gains may owe capital-gains tax (a 1031 exchange can defer both). Figures are a year-1 estimate at your 24.0% rate — not tax advice; consult a CPA.
Schools (NCES district)
- District
- Marion
- NCES district ID
- 1201260
- Math proficiency
- 42% ▼ -7.00%
- Reading proficiency
- 43% ▼ -4.00%
- Median HH income
- $40,015
- Composite
- 35.61/100
- National rank
- #4890
- State rank
- #61 of 73 in FL
Livability — Ocala
- Score
- 69/100
- State rank
- #476
- US rank
- #8461
Category grades
Schools grade is shown separately in the Schools card above.
Census & demographics
- Census place
- Ocala, FL
- County
- Marion County · 315,796 people
- City population
- 263,375
- Metro
- Ocala, FL
- Population (ZIP)
- 14,301
- Household income
- $30,174
- Rent vs Own
- Severe rent burden
- 923.0
Population outlook (Marion County) Hauer SSP2
- Today (2025)
- 365,905 people
- By 2030
- 376,768 · +3.0%
- By 2040
- 396,555 · +8.4%
- By 2050
- 412,723 · +12.8%
- By 2075
- 446,090 · +21.9%
- By 2100
- 436,193 · +19.2%
Race, ethnicity, and origin ACS 2023
- Neighborhood character
- Diverse neighborhood (Simpson 0.68)
- Race & ethnicity
- Black 44% White 30% Hispanic / Latino 19% Two or more races 11%
- Hispanic origin (detail)
- Mexican 1% Puerto Rican 8% Cuban 3%
- Common ancestry
- Serbian 2% Hispanic 1% Lithuanian 1%
- Foreign-born
- 8% · Canada, China, Jamaica
- Languages at home
- 84% English-only · Spanish 13% French/Haitian/Cajun 2%
Political lean MEDSL · Marion
- 2024 margin
- Solid R (+31.6) · D 33.8% · R 65.5%
- 2008→2024 swing
- -20.0pp toward R · 2008: -11.6pp · 2024: -31.6pp
- All cycles
- 2024: R+31.6 2020: R+25.9 2016: R+26.2 2012: R+16.2 2008: R+11.6
Not yet ingested
- Civics
- —
Market trends
- HPI YoY
- ▼ -22.26%
- Current HPI
- 254.6319
- Rent YoY
- —
- Metro
- Ocala, FL
- State GDP YoY
- ▲ 3.28%
- F500 in state
- 36
Industry mix (Fortune 500 HQ in FL)
| Industry | F500 HQs | Revenue |
|---|---|---|
| Industrial Technology | 2 | $29B |
|
||
| Insurance | 2 | $17B |
|
||
| Retail | 1 | $60B |
|
||
| Technology Distribution | 1 | $58B |
|
||
| Homebuilding | 1 | $35B |
|
||
| Technology Manufacturing | 1 | $35B |
|
||
Price history
+214.8% since first listed21 events — show timeline
- 2026-05-20 Listed $169,990 Stellar MLS as Distributed by MLS Grid
- 2024-10-15 Sold (MLS) $150,000 Stellar MLS as Distributed by MLS Grid
- 2024-09-30 Pending — Stellar MLS as Distributed by MLS Grid
- 2024-09-30 Relisted — Stellar MLS as Distributed by MLS Grid
- 2024-09-30 Pending — Stellar MLS as Distributed by MLS Grid
- 2024-09-25 Listed $155,000 Stellar MLS as Distributed by MLS Grid
- 2024-06-19 Relisted — Stellar MLS as Distributed by MLS Grid
- 2024-03-09 Relisted — Stellar MLS as Distributed by MLS Grid
- 2024-01-21 Pending — Stellar MLS as Distributed by MLS Grid
- 2023-11-22 Listed $199,000 Stellar MLS as Distributed by MLS Grid
- 2013-03-19 Sold (MLS) $13,500 Stellar MLS as Distributed by MLS Grid
- 2012-12-17 Listed $20,000 Stellar MLS as Distributed by MLS Grid
- 2012-12-14 Listing Removed — Stellar MLS as Distributed by MLS Grid
- 2012-10-19 Listing Removed — Stellar MLS as Distributed by MLS Grid
- 2012-09-14 Listing Removed — Stellar MLS as Distributed by MLS Grid
- 2012-09-12 Listed $25,000 Stellar MLS as Distributed by MLS Grid
- 2012-09-12 Listed $25,000 Stellar MLS as Distributed by MLS Grid
- 2012-09-11 Listing Removed — Stellar MLS as Distributed by MLS Grid
- 2012-08-01 Listed $30,000 Stellar MLS as Distributed by MLS Grid
- 2012-04-24 Listed $35,000 Stellar MLS as Distributed by MLS Grid
- 1996-09-25 Sold (Public Records) $54,000 Public Records
Property tax history
+14.1%/yrLatest (2025): $2,940 · +46.4% YoY. Source: county tax records.
Cash-flow waterfall
monthlySold comps — $/sqft
last 12 mo · ≤1 miLoading sold comps…