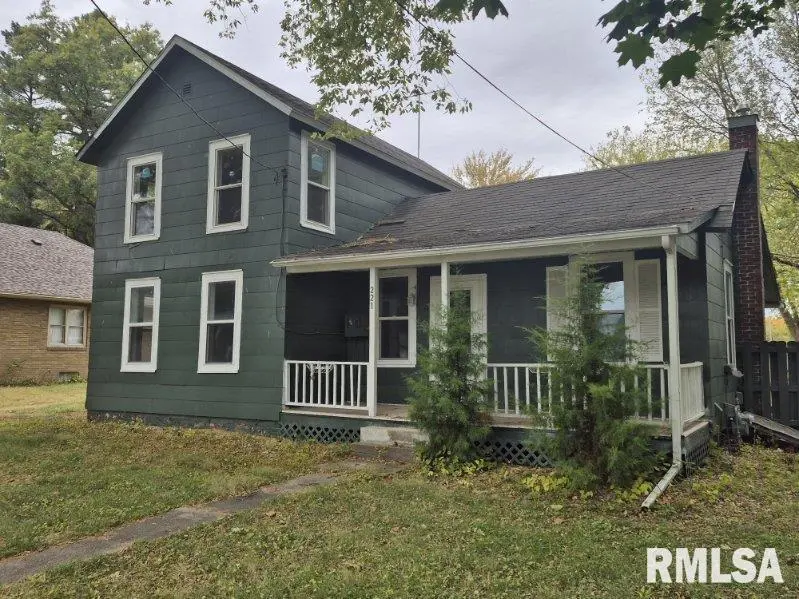
221 Mckinley St · Hooppole, IL
Flood risk 1/10 · Minimal
- FEMA flood zone
- X (unshaded)
- Chance of flooding over 30 yrs
- 0.0%
- Est. flood insurance / yr
- $473 – $860
Fire risk 1/10 · Minimal
- Est. fire insurance / yr
- $804 – $1,492
Heat risk 3/10 · Minor
- Hot days now (above 103°F)
- 7 days/yr
- Hot days in 30 yrs
- 17 days/yr
Wind risk 2/10 · Minimal
- Chance of severe wind over 30 yrs
- —
Air-quality risk 3/10 · Minor
- Unhealthy air days now
- 2 days/yr
- Unhealthy air days in 30 yrs
- 3 days/yr
Risk factors via First Street. Map © Google.
Why this score? — see what drove the A- grade
The composite is a weighted blend of 9 inputs, each scored 0–100. Each bar is that input's sub-score; the figure is the points it added to the 100-point composite (weight × sub-score).
- Cash flow +30.0/30.0
- ARV discount +15.0/15.0
- 1% rule +10.0/10.0
- DSCR +10.0/10.0
- Appreciation +5.0/10.0
- Schools +3.1/10.0
- Livability +2.9/5.0
- Rent growth +2.5/5.0
- Condition / age +2.5/5.0
$68,500
🖨 Deal sheet (PDF) 📄 Offer letter ✓ Due diligence
Listing remarks
Recently remodeled 3 bedroom/ 1 bath home with a 1-car detached garage. Partially fenced yard with alley access. The main floor features: living room, dining room, 1st floor bedroom, large bathroom & convenient main floor laundry. The office has French doors that lead out to the backyard. The kitchen has nice white cabinets & new appliances that stay! The other 2 bedrooms are located on the second floor. Updates per the seller: New kitchen cabinets, new vinyl plank flooring, new vinyl replacement windows & fresh paint. Home is being sold "AS IS".
Key facts
- Alley access
- French doors
- New kitchen cabinets
Tags
Neighborhood map
What this means for you Summary
Snapshot
- This is a 3-bed/1.0-bath other listed at $68k.
Deal economics
- At list price, monthly cash flow is $467 ($6k/yr) — positive.
- The deal already cash-flows at list — no discount required.
- Meets the 1% rule at list price ($1k rent vs $68k).
- Recommended offer: $60k (12.0% below list) — sets the bar for market timing.
Location & tenants
- Location reads 58/100 on livability (#1,133 in IL) — a working-class tenant base; expect higher turnover. Strengths: cost of living A+, housing A+; Watch: crime F, amenities F, commute F.
- Annawan CUSD 226 (rural): math 30% / reading 35% proficiency, ranked #429 of 919 in IL (top 47%) — families likely to look elsewhere, expect single-tenant / working-renter base with shorter leases.
- Zoned schools: Annawan Grade School (math 27% / reading 32%, grade F, #658 of 2,056 statewide, top 35%, 247 students, 0% FRL); Annawan High School (math 30% / reading 10%, grade F, #357 of 693 statewide, top 54%, 105 students, 0% FRL) — zoned schools average 0% FRL vs 22% district-wide (22 pts lower); this property's tenant base skews higher-income than the district average.
- Market conditions: 2 active listings in the ZIP; 32 units permitted in Henry County in 2024 (0 in 5+ unit buildings).
Forward outlook
- In year one you build about $3k of equity ($474 loan paydown + $2k appreciation (3.0% local appreciation)).
- Henry County population projected at -16% by 2050 — secular population decline; favor cash flow + early exit over multi-decade hold.
- At projected returns (3.0% appreciation + 3.0% rent growth), your $19k cash investment doubles in ~3 years — after that, you're playing with house money.
Negotiation context
- It's been on market 178 days — a 12% lower offer ($60k) is reasonable based on typical stale-listing flexibility.
- 7 sale attempts since 3y ago; this cycle's ask is 128% above the opening price — seller raised mid-cycle; expect resistance to lowballs.
- Current owner paid $18k; list at $68k implies a 270% gain — meaningful room to come down on a strong offer.
Risks & watch-outs
- Watch-outs: built in 1917 — expect roof / HVAC / electrical / plumbing capex.
Questions for the listing agent
- It's been on market 178 days. Have you received any prior offers? Is the seller open to a 12% concession, seller financing, or rate buy-down credit?
- Built in 1917 — when were the roof, HVAC, electrical panel, plumbing, and water heater last replaced?
- Why hasn't it sold? Are there any deal-killer items the seller is aware of (foundation, flood, title, zoning, code violations)?
- Is there a deadline driving the sale (1031 exchange, divorce, estate, relocation)? That informs how much negotiation room exists.
- Schools are D-rated, which usually means shorter tenancies and higher turnover. Who's the typical renter profile here, and what's been the actual vacancy rate?
- Crime grade is F in this area — have there been break-ins, vandalism, or insurance claims at this property in the last 3 years? What carrier currently insures it and at what premium?
- What's the average days-on-market for RENTAL listings here right now (not sales)? A rising rental-DOM trend means longer vacancies and softer asking-rent achievability than the comps imply.
- What's the recent tenant-quality profile in this submarket — average credit score on applications, eviction rate, late-payment / NSF rate, and stable-employment percentage? A property-management company in the area should have these aggregated.
- How much new for-sale + rental construction is in the pipeline within 1–3 miles? Heavy new supply typically softens prices + rents 12–24 months out; constrained supply supports both.
Investment metrics
- 1% rule
- 1.75% ✓
- Cap rate
- 14.48%
- Cash-on-cash
- 29.24%
- DSCR
- 2.30
- GRM
- 4.8
CMA / ARV
- ARV (median comp)
- $108,248
- List price
- $68,500
- Delta
- -36.72%
- Verdict
- UNDERPRICED
- Comps
- 10 within 1.0 mi
Projected returns pro-forma
3.0% appreciation · 3.0% rent growth · sell at horizon
- IRR
- 35.1%
- Equity multiple
- 2.98×
- Total profit
- $38,036
- Equity at exit
- $30,801
- IRR
- 35.3%
- Equity multiple
- 5.89×
- Total profit
- $93,735
- Equity at exit
- $47,467
Cash invested: $19,180 (down + closing). Projections, not guarantees.
Landlord ↔ Tenant lean methodology
- Overall (STATE)
- 43 Moderately Tenant-Leaning
- State Illinois
- 43 Moderately Tenant-Leaning · D+7
- County
- — inherits STATE
- City
- — inherits STATE
ZIP-level market 61258
- Active inventory
- 2
- Price-to-rent
- 4.8×
Monthly cashflow live
- Estimated rent
- $1,200 medium interval (Pro) →
- Mortgage (P&I)
- −$359
- Tax from tax record
- −$93 /mo · $1,113/yr
- Insurance
- −$29
- HOA
- −$0
- Vacancy / Maint / Mgmt
- −$252
- Net cashflow
- $467
Break-even live
Sensitivity live
| Price | -10% $506 | -5% $487 | +0% $467 | +5% $448 | +10% $429 |
|---|---|---|---|---|---|
| Rent | -10% $372 | -5% $420 | +0% $467 | +5% $515 | +10% $562 |
| Rate | -1.0pp $502 | -0.5pp $485 | base $467 | +0.5pp $450 | +1.0pp $431 |
UW: 25.0% down · 7.5% · 30yr · 1.5% tax · 5.0% vac · 8.0% maint · 8.0% mgmt
Financing live
Cash to close
- Down payment
- $17,125
- Closing costs
- $2,055
- Reserves months
- —
- Total cash needed
- —
Loan-product check · same deal, 3 products live
Conventional
25% down · 7.5% · 30yr
- Down + closing
- —
- Monthly P&I
- —
- Monthly cashflow
- —
- DSCR
- —
- Eligible?
- —
Personal DTI + credit; lowest rate.
DSCR
20% down · 8.5% · 30yr
- Down + closing
- —
- Monthly P&I
- —
- Monthly cashflow
- —
- DSCR
- —
- Eligible?
- —
No personal income docs; deal must DSCR.
Hard money
10% down · 12.0% · 12mo
- Down + closing
- —
- Monthly P&I
- —
- Monthly cashflow
- —
- DSCR
- —
- Eligible?
- —
Short-term bridge; refi at stabilization.
Listing history 36 events
-
2026-06-21days on market $68,500 Active 178 DOM
-
2026-06-18days on market $68,500 Active 175 DOM
-
2026-06-17days on market $68,500 Active 174 DOM
-
2026-06-16days on market $68,500 Active 173 DOM
-
2026-06-15days on market $68,500 Active 172 DOM
-
2026-06-13days on market $68,500 Active 170 DOM
-
2026-06-13days on market $68,500 Active 169 DOM
-
2026-06-09days on market $68,500 Active 166 DOM
-
2026-06-08days on market $68,500 Active 165 DOM
-
2026-06-07days on market $68,500 Active 164 DOM
-
2026-06-05days on market $68,500 Active 161 DOM
-
2026-06-03days on market $68,500 Active 160 DOM
-
2026-06-02days on market $68,500 Active 159 DOM
-
2026-06-01days on market $68,500 Active 158 DOM
-
2026-05-31days on market $68,500 Active 157 DOM
-
2026-04-01price $68,500
-
2026-02-05price $72,500
-
2026-01-20status Active
-
2026-01-14historical
-
2026-01-08status Active
-
2026-01-06historical
-
2026-01-05historical
-
2025-12-03Active
-
2025-06-09price
-
2025-04-06historical
-
2025-04-06historical
-
2025-04-06status Active
-
2025-03-18historical Under Contract
-
2025-03-12price
-
2025-02-14Active
-
2023-08-21soldstatus $18,500
-
2023-08-21soldstatus $18,500 Closed
-
2023-07-24status Pending
-
2023-07-10price $25,000
-
2023-05-04$25,000
-
2023-05-04$30,000 Active
ⓘ Source: listings_history table (triggers on properties + properties_extension) + one-shot
backfill from property_details.listing_events for pre-trigger history.
Tax reassessment forecast IL · Partial reset (capped growth)
- Current annual tax
- $1,113 · $93/mo
- Projected year-2 tax
- $1,334 · $111/mo
- Expected delta
- +$221/yr (+$18/mo · 19.9%)
ⓘ Screening estimate from a state-policy table — verify with the county assessor before closing.
Climate risk First Street
- Flood 1/10 Low FEMA zone X (unshaded) · 0% chance over 30 yrs
- Wildfire 1/10 Low
- Heat 3/10 Moderate 7 d/yr ≥103°F today · 17 d/yr by 30 yrs out
- Wind 2/10 Low
- Air quality 3/10 Moderate 2 unhealthy d/yr today · 3 by 30 yrs out
Nearby sold comps map
Loading sold comps map…
Walkable amenities ~0.75 mi
Loading nearby amenities…
Taxation est. · year 1
- Rental income
- $14,397
- − Mortgage interest
- −$3,837
- − Property taxes
- −$1,113
- − Insurance
- −$342
- − Repairs & maintenance
- −$1,152
- − Management
- −$1,152
- − Depreciation
- −$1,993
- Taxable income
- $4,808
- Est. tax owed @ 24.0%
- −$1,154
- After-tax cash flow
- $4,453/yr
For passive investors: Depreciation is non-cash, so a rental often shows a tax loss while cash-flowing — sheltering income. Rental losses are passive: they offset passive income freely, and up to $25,000/yr can offset ordinary (W-2) income if you actively participate and your MAGI is under $100k (phasing out to $0 by $150k); unused losses carry forward. On sale, claimed depreciation is recaptured at up to 25%, and gains may owe capital-gains tax (a 1031 exchange can defer both). Figures are a year-1 estimate at your 24.0% rate — not tax advice; consult a CPA.
Schools (NCES district)
- District
- Annawan CUSD 226
- NCES district ID
- 1703810
- Math proficiency
- 30% ▲ 10.00%
- Reading proficiency
- 35% ▲ 10.00%
- Median HH income
- $53,191
- Composite
- 31.3/100
- National rank
- #11233
- State rank
- #429 of 919 in IL
Livability — Hooppole
- Score
- 58/100
- State rank
- #1133
- US rank
- #21383
Category grades
Schools grade is shown separately in the Schools card above.
Census & demographics
- Census place
- Hooppole, IL
- City population
- 174
- Population (ZIP)
- 174
Population outlook (Henry County) Hauer SSP2
- Today (2025)
- 47,376 people
- By 2030
- 45,920 · -3.1%
- By 2040
- 42,829 · -9.6%
- By 2050
- 39,606 · -16.4%
- By 2075
- 31,848 · -32.8%
- By 2100
- 23,503 · -50.4%
Race, ethnicity, and origin ACS 2023
- Neighborhood character
- Predominantly White (98%)
- Race & ethnicity
- White 98% Two or more races 2%
- Common ancestry
- Lithuanian 3% Portuguese 2% Iranian 1%
Political lean MEDSL · Henry
- 2024 margin
- Strong R (+24.5) · D 36.8% · R 61.3% · Other 1.9%
- 2008→2024 swing
- -32.2pp toward R · 2008: 7.7pp · 2024: -24.5pp
- All cycles
- 2024: R+24.5 2020: R+21.4 2016: R+21.2 2012: D+3.1 2008: D+7.7
Not yet ingested
- Civics
- —
Market trends
- HPI YoY
- —
- Current HPI
- —
- Rent YoY
- —
- Metro
- —
- State GDP YoY
- ▲ 1.59%
- F500 in state
- 60
Industry mix (Fortune 500 HQ in IL)
| Industry | F500 HQs | Revenue |
|---|---|---|
| Insurance | 4 | $201B |
|
||
| Consumer Goods | 4 | $87B |
|
||
| Industrial Machinery | 3 | $64B |
|
||
| Healthcare | 2 | $55B |
|
||
| Retail / Pharmacy | 1 | $148B |
|
||
| Agriculture / Food | 1 | $86B |
|
||
Price history
+174.0% since first listed21 events — show timeline
- 2026-04-01 Price Changed $68,500 MRED as Distributed by MLS Grid
- 2026-02-05 Price Changed $72,500 MRED as Distributed by MLS Grid
- 2026-01-20 Relisted — MRED as Distributed by MLS Grid
- 2026-01-14 Listing Removed — MRED as Distributed by MLS Grid
- 2026-01-08 Relisted — MRED as Distributed by MLS Grid
- 2026-01-06 Listing Removed — RMLSA as Distributed by MLS Grid
- 2026-01-05 Listing Removed — MRED as Distributed by MLS Grid
- 2025-12-03 Listed — RMLSA as Distributed by MLS Grid
- 2025-06-09 Price Changed — RMLSA as Distributed by MLS Grid
- 2025-04-06 Listing Removed — MRED as Distributed by MLS Grid
- 2025-04-06 Listing Removed — RMLSA as Distributed by MLS Grid
- 2025-04-06 Relisted — RMLSA as Distributed by MLS Grid
- 2025-03-18 Contingent — RMLSA as Distributed by MLS Grid
- 2025-03-12 Price Changed — RMLSA as Distributed by MLS Grid
- 2025-02-14 Listed — RMLSA as Distributed by MLS Grid
- 2023-08-21 Sold (MLS) $18,500 RMLSA as Distributed by MLS Grid
- 2023-08-21 Sold (MLS) $18,500 MRED as Distributed by MLS Grid
- 2023-07-24 Pending — RMLSA as Distributed by MLS Grid
- 2023-07-10 Price Changed $25,000 RMLSA as Distributed by MLS Grid
- 2023-05-04 Listed $30,000 RMLSA as Distributed by MLS Grid
- 2023-05-04 Listed $25,000 MRED as Distributed by MLS Grid
Property tax history
+10.6%/yrLatest (2024): $1,113 · +5.9% YoY. Source: county tax records.
Cash-flow waterfall
monthlySold comps — $/sqft
last 12 mo · ≤1 miLoading sold comps…