 🏗️ New Construction
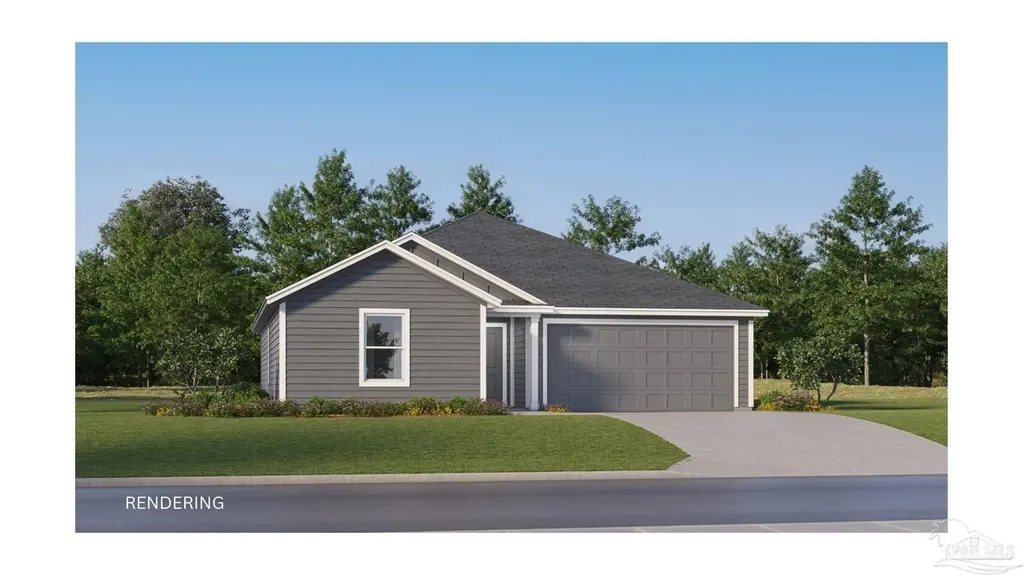
7129 Season Dr Lot 4C · Point Baker, FL
Flood risk 1/10 · Minimal
- FEMA flood zone
- X (unshaded)
- Chance of flooding over 30 yrs
- 0.0%
- Est. flood insurance / yr
- $507 – $1,088
Fire risk 5/10 · Moderate
- Est. fire insurance / yr
- $947 – $1,759
Heat risk 10/10 · Severe
- Hot days now (above 106°F)
- 7 days/yr
- Hot days in 30 yrs
- 22 days/yr
Wind risk 9/10 · Severe
- Chance of severe wind over 30 yrs
- 99.0%
Air-quality risk 2/10 · Minimal
- Unhealthy air days now
- 1 days/yr
- Unhealthy air days in 30 yrs
- 1 days/yr
Risk factors via First Street. Map © Google.
Why this score? — see what drove the D grade
The composite is a weighted blend of 9 inputs, each scored 0–100. Each bar is that input's sub-score; the figure is the points it added to the 100-point composite (weight × sub-score).
- Cash flow +12.7/30.0
- ARV discount +7.5/15.0
- Schools +5.3/10.0
- Condition / age +4.8/5.0
- 1% rule +4.1/10.0
- DSCR +3.8/10.0
- Rent growth +3.2/5.0
- Livability +3.2/5.0
- Appreciation +0.0/10.0
$239,990
🖨 Deal sheet 📄 Offer letter ✓ Due diligence
Listing remarks
The Bonds floor plan offers a beautifully crafted single-story layout designed for effortless modern living. At the front of the home, a collection of well-appointed bedrooms provides comfort, privacy, and versatility, perfect for family members, guests, or a home office. From the entryway, the home opens into a spacious open-concept living area where the kitchen, dining space, and family room blend seamlessly, creating an inviting atmosphere for gathering, entertaining, or everyday relaxation. The kitchen features quartz countertops, stainless steel appliances, and 42' cabinets for both style and functionality. Nestled in its own private corner at the back of the home, the elegant owner's
Key facts
- Single-story layout
- Quartz countertops
- 42 cabinets
Tags
Property features AI
Finance
- HOA & community: Homeowners association with an annual fee of $1,075 (covers association)
Exterior
- Parking: Attached 2-car garage with garage door opener; Two covered parking spaces (total 2 parking spaces)
- Security: Smoke detector(s)
- Utilities: Public water; Septic tank sewer; Copper wiring electrical; Underground utilities
- Home design: New construction, under construction; Detached property; Two levels
- Construction: Frame construction; Slab foundation; Built with insulation, insulated walls and ridge vent (energy efficient features)
- Exterior features: Shingle roof; Central access lot feature; Private maintained road
Interior
- Kitchen: Built-in microwave; Dishwasher (ENERGY STAR qualified); Pantry; Electric water heater
- Bedrooms: Primary bedroom on the first floor (approx. 11 x 13); Bedroom 1 on the first floor (approx. 12 x 10); Bedroom 2 on the first floor (approx. 10 x 12)
- Flooring: Carpet
- Bathrooms: Two full bathrooms
- Heating & cooling: Heat pump for heating and cooling
- Interior features: Insulated doors; Double pane windows; Shutters; Pantry; Smoke detector(s)
- Laundry & utility: Washer/dryer hookups
Neighborhood map
What this means for you Summary
Snapshot
- This is a 3-bed/2.0-bath single-family listed at $240k. Condition is rated excellent.
Deal economics
- At list price, monthly cash flow is $-24 ($-287/yr) — negative.
- To cash-flow at today's rent, offer at most $218k (9.0% below list).
- To meet the 1% rule (rent ≥ 1% of price), the offer needs to be $202k (15.6% below list).
- Recommended offer: $202k (15.6% below list) — sets the bar for 1% rule.
- Cap rate 6.2% vs local median 4.2% in Point Baker — top-decile yield for the area; either an underpriced asset or a hidden risk that comps aren't pricing in. Stress-test before assuming the spread holds.
Location & tenants
- Location reads 63/100 on livability (#735 in FL) — a middle-class / working-renter tenant base. Strengths: crime A+, cost of living A+, housing A+; Watch: schools F, amenities F, commute F.
- Santa Rosa (suburban): math 63% / reading 60% proficiency, ranked #8 of 73 in FL (top 11%) — acceptable for families but not a draw, mixed tenant base, ~2y average lease.
- Market conditions: Rents rising (+2.7%/yr); 360 active listings in the ZIP; solid renter incomes; 1,983 units permitted in Santa Rosa County in 2024 (128 in 5+ unit buildings).
- This rent runs 31% of the median local income ($77k/yr) — at the standard rent-burdened threshold; future hikes will face affordability resistance.
Forward outlook
- Local home prices are declining (-3.0%/yr); year-one equity from $2k of loan paydown is wiped out by about $7k of value loss. Plan a longer hold.
- Santa Rosa County population projected at +31% by 2050 — long-run rental-demand tailwind backs the buy-and-hold thesis.
Negotiation context
- It's been on market 51 days — a 3% lower offer ($233k) is reasonable based on typical stale-listing flexibility.
- 2 sale attempts with the ask held roughly flat each time — persistent listings suggest the price (not the market) is what's stuck; bring a comps-based counter.
Risks & watch-outs
- Climate carrying-cost: severe wind risk, 99% chance of damaging wind over 30y; moderate wildfire risk; extreme-heat days projected 7→22/yr by 2055 (HVAC capex compounding) — expect insurance premiums to compound above CPI over the hold.
Questions for the listing agent
- What do current leases actually rent for vs. the listed asking? Can we see a recent rent roll and the last 12 months of T-12 income?
- It's been on market 51 days. Have you received any prior offers? Is the seller open to a 16% concession, seller financing, or rate buy-down credit?
- What does the HOA fee cover, when was the last increase, and are there any pending special assessments or reserve-fund shortfalls?
- Is there a deadline driving the sale (1031 exchange, divorce, estate, relocation)? That informs how much negotiation room exists.
- Schools are F-rated, which usually means shorter tenancies and higher turnover. Who's the typical renter profile here, and what's been the actual vacancy rate?
- The area grade is low — what's the realistic commute time and amenity access for the typical tenant pool here? Any planned neighborhood developments (good or bad) we should know about?
- What's the average days-on-market for RENTAL listings here right now (not sales)? A rising rental-DOM trend means longer vacancies and softer asking-rent achievability than the comps imply.
- What's the recent tenant-quality profile in this submarket — average credit score on applications, eviction rate, late-payment / NSF rate, and stable-employment percentage? A property-management company in the area should have these aggregated.
- How much new for-sale + rental construction is in the pipeline within 1–3 miles? Heavy new supply typically softens prices + rents 12–24 months out; constrained supply supports both.
Investment metrics
- 1% rule
- 0.91% ✗
- Cap rate
- 6.16%
- Cash-on-cash
- -0.46%
- DSCR
- 0.98
- GRM
- 9.1
CMA / ARV
- ARV (on-the-fly)
- $221,880
- Comps found
- 12
Show comp detail 12 sales within ~0.75 mi
| Address | Dist | Beds/Ba | Sqft | Sold | Price | $/sf | Match |
|---|---|---|---|---|---|---|---|
| 7142 Season Dr | 0.00mi | 3/2.0 | 1,290 (0%) | 1mo | $253,490 | $197 | 99 |
| 7054 Tylerwood Ct | 0.28mi | 3/2.0 | 1,309 (+2%) | 8mo | $225,000 | $172 | 78 |
| 7073 Jacobsview Ln | 0.11mi | 3/2.0 | 1,475 (+14%) | 1mo | $247,000 | $167 | 70 |
| 6549 Sinclair St | 0.55mi | 4/2.0 (+1) | 1,275 (-1%) | 8mo | $213,000 | $167 | 61 |
| 6583 Stanley Cir | 0.32mi | 3/2.0 | 1,448 (+12%) | 5mo | $239,000 | $165 | 61 |
| 6520 Eagle Crest Dr | 0.71mi | 3/2.0 | 1,284 (-0%) | 10mo | $229,000 | $178 | 58 |
| 6409 Hunter St | 0.59mi | 3/2.0 | 1,364 (+6%) | 6mo | $197,000 | $144 | 58 |
| 6356 Banyan Dr | 0.72mi | 3/2.0 | 1,196 (-7%) | 4mo | $245,000 | $205 | 51 |
| 6568 Sinclair St | 0.54mi | 3/2.0 | 1,107 (-14%) | 2mo | $198,000 | $179 | 49 |
| 6502 Starboard Dr | 0.63mi | 3/2.0 | 1,480 (+15%) | 0mo | $208,000 | $141 | 46 |
| 6525 Bass Ln | 0.69mi | 4/1.0 (+1) | 1,300 (+1%) | 18mo | $218,000 | $168 | 42 |
| 6425 Bass Ln | 0.70mi | 3/2.0 | 1,430 (+11%) | 14mo | $253,000 | $177 | 37 |
Match score weights: distance 35% · size 25% · config 20% · recency 20%. Top-matched comps best support the ARV.
Projected returns pro-forma
-3.0% appreciation · 2.7% rent growth · sell at horizon
- IRR
- -17.4%
- Equity multiple
- 0.39×
- Total profit
- $-38,001
- Equity at exit
- $33,083
- IRR
- -9.9%
- Equity multiple
- 0.40×
- Total profit
- $-37,188
- Equity at exit
- $19,184
Cash invested: $62,126 (down + closing). Projections, not guarantees.
Landlord ↔ Tenant lean methodology
- Overall (STATE)
- 87 Strongly Landlord-Friendly
- State Florida
- 87 Strongly Landlord-Friendly · R+3
- County
- — inherits STATE
- City
- — inherits STATE
ZIP-level market 32570
- Home prices YoY
- -15.1%
- Rents YoY
- 2.7%
- Active inventory
- 360
- Price-to-rent
- 9.9×
Monthly cashflow live
- Estimated rent
- $2,025 medium interval (Pro) →
- Mortgage (P&I)
- −$1,164
- Tax est. 1.5%
- −$277 /mo · $3,328/yr
- Insurance
- −$92
- HOA
- −$90
- Vacancy / Maint / Mgmt
- −$425
- Net cashflow
- $-24
Break-even live
UW: 25.0% down · 7.5% · 30yr · 1.5% tax · 5.0% vac · 8.0% maint · 8.0% mgmt
Financing live
Cash to close
- Down payment
- $55,470
- Closing costs
- $6,656
- Reserves months
- —
- Total cash needed
- —
Loan-product check · same deal, 3 products live
Conventional
25% down · 7.5% · 30yr
- Down + closing
- —
- Monthly P&I
- —
- Monthly cashflow
- —
- DSCR
- —
- Eligible?
- —
Personal DTI + credit; lowest rate.
DSCR
20% down · 8.5% · 30yr
- Down + closing
- —
- Monthly P&I
- —
- Monthly cashflow
- —
- DSCR
- —
- Eligible?
- —
No personal income docs; deal must DSCR.
Hard money
10% down · 12.0% · 12mo
- Down + closing
- —
- Monthly P&I
- —
- Monthly cashflow
- —
- DSCR
- —
- Eligible?
- —
Short-term bridge; refi at stabilization.
HOA detail
- Monthly dues
- $90 · $1,080/yr
Listing history 9 events
-
2026-05-19status Pending
-
2026-05-15price $239,990
-
2026-05-10price $246,990
-
2026-04-18price $248,490
-
2026-04-14status Active
-
2026-04-14price $249,490
-
2026-04-06status Pending
-
2026-03-28price $239,490
-
2026-03-21$237,490 Active
ⓘ Source: listings_history table (triggers on properties + properties_extension) + one-shot
backfill from property_details.listing_events for pre-trigger history.
Climate risk First Street
- Flood 1/10 Low FEMA zone X (unshaded) · 0% chance over 30 yrs
- Wildfire 5/10 Major
- Heat 10/10 Extreme 7 d/yr ≥106°F today · 22 d/yr by 30 yrs out
- Wind 9/10 Extreme 99% chance of damaging wind over 30 yrs
- Air quality 2/10 Low 1 unhealthy d/yr today · 1 by 30 yrs out
Nearby sold comps map
Loading sold comps map…
Walkable amenities ~0.75 mi
Loading nearby amenities…
Taxation est. · year 1
- Rental income
- $24,295
- − Mortgage interest
- −$12,429
- − Property taxes
- −$3,328
- − Insurance
- −$1,109
- − Repairs & maintenance
- −$1,944
- − Management
- −$1,944
- − HOA
- −$1,080
- − Depreciation
- −$6,455
- Taxable loss
- −$3,993
- Est. tax savings @ 24.0%
- +$958
- After-tax cash flow
- $671/yr
For passive investors: Depreciation is non-cash, so a rental often shows a tax loss while cash-flowing — sheltering income. Rental losses are passive: they offset passive income freely, and up to $25,000/yr can offset ordinary (W-2) income if you actively participate and your MAGI is under $100k (phasing out to $0 by $150k); unused losses carry forward. On sale, claimed depreciation is recaptured at up to 25%, and gains may owe capital-gains tax (a 1031 exchange can defer both). Figures are a year-1 estimate at your 24.0% rate — not tax advice; consult a CPA.
Condition & rehab AI · 13 photos
This single-story home is in excellent condition with modern finishes and a well-maintained exterior. It offers a spacious open-concept layout and is move-in ready.
Value-add opportunities
- Both Painting exterior siding — Enhances curb appeal and value
- Both Landscaping improvements — Enhances curb appeal and value
- Resale Replace kitchen faucet — Modernizes the kitchen and adds value
- Resale Replace bathroom fixtures — Modernizes the bathrooms and adds value
Renovation cost estimate screening
Value-add ROI direction
- Both Painting exterior siding — Enhances curb appeal and value ↑
- Both Landscaping improvements — Enhances curb appeal and value ↑
- Resale Replace kitchen faucet — Modernizes the kitchen and adds value ↑
- Resale Replace bathroom fixtures — Modernizes the bathrooms and adds value ↑
ⓘ Cost ranges are severity-bucket heuristics (US national rule-of-thumb). Get contractor quotes + a written scope before underwriting a rehab budget.
Schools (NCES district)
- District
- Santa Rosa
- NCES district ID
- 1201650
- Math proficiency
- 63% ▼ -6.00%
- Reading proficiency
- 60% ▼ -5.00%
- Median HH income
- $58,161
- Composite
- 53.12/100
- National rank
- #1511
- State rank
- #8 of 73 in FL
Livability — Point Baker
- Score
- 63/100
- State rank
- #735
- US rank
- #15840
Category grades
Schools grade is shown separately in the Schools card above.
Census & demographics
- Census place
- Point Baker, FL
- County
- Santa Rosa County · 194,764 people
- Metro
- Pensacola-Ferry Pass-Brent, FL
- Population (ZIP)
- 37,197
- Household income
- $77,222
- Rent vs Own
- Severe rent burden
- 590.0
Population outlook (Santa Rosa County) Hauer SSP2
- Today (2025)
- 195,978 people
- By 2030
- 209,782 · +7.0%
- By 2040
- 235,293 · +20.1%
- By 2050
- 256,408 · +30.8%
- By 2075
- 298,074 · +52.1%
- By 2100
- 303,216 · +54.7%
Race, ethnicity, and origin ACS 2023
- Neighborhood character
- Predominantly White (80%)
- Race & ethnicity
- White 80% Two or more races 7% Black 6% Hispanic / Latino 6% Asian 1%
- Hispanic origin (detail)
- Mexican 2% Puerto Rican 2%
- Common ancestry
- Italian 4% Lithuanian 3% Portuguese 2%
- Foreign-born
- 4% · Canada
- Languages at home
- 94% English-only · Spanish 4% Other Asian/Pacific 1%
Political lean MEDSL · Santa Rosa
- 2024 margin
- Solid R (+51.0) · D 24.1% · R 75.0%
- 2008→2024 swing
- -3.0pp toward R · 2008: -47.9pp · 2024: -51.0pp
- All cycles
- 2024: R+51.0 2020: R+46.5 2016: R+53.5 2012: R+52.6 2008: R+47.9
Not yet ingested
- Civics
- —
Market trends
- HPI YoY
- ▼ -51.06%
- Current HPI
- 287.7469
- Rent YoY
- ▲ 2.70%
- Metro
- Pensacola-Ferry Pass-Brent, FL
- State GDP YoY
- ▲ 3.28%
- F500 in state
- 36
Industry mix (Fortune 500 HQ in FL)
| Industry | F500 HQs | Revenue |
|---|---|---|
| Industrial Technology | 2 | $29B |
|
||
| Insurance | 2 | $17B |
|
||
| Retail | 1 | $60B |
|
||
| Technology Distribution | 1 | $58B |
|
||
| Homebuilding | 1 | $35B |
|
||
| Technology Manufacturing | 1 | $35B |
|
||
Price history
+1.1% since first listed9 events — show timeline
- 2026-05-19 Pending — PARMLS
- 2026-05-15 Price Changed $239,990 PARMLS
- 2026-05-10 Price Changed $246,990 PARMLS
- 2026-04-18 Price Changed $248,490 PARMLS
- 2026-04-14 Relisted — PARMLS
- 2026-04-14 Price Changed $249,490 PARMLS
- 2026-04-06 Pending — PARMLS
- 2026-03-28 Price Changed $239,490 PARMLS
- 2026-03-21 Listed $237,490 PARMLS
Cash-flow waterfall
monthlySold comps — $/sqft
last 12 mo · ≤1 miLoading sold comps…