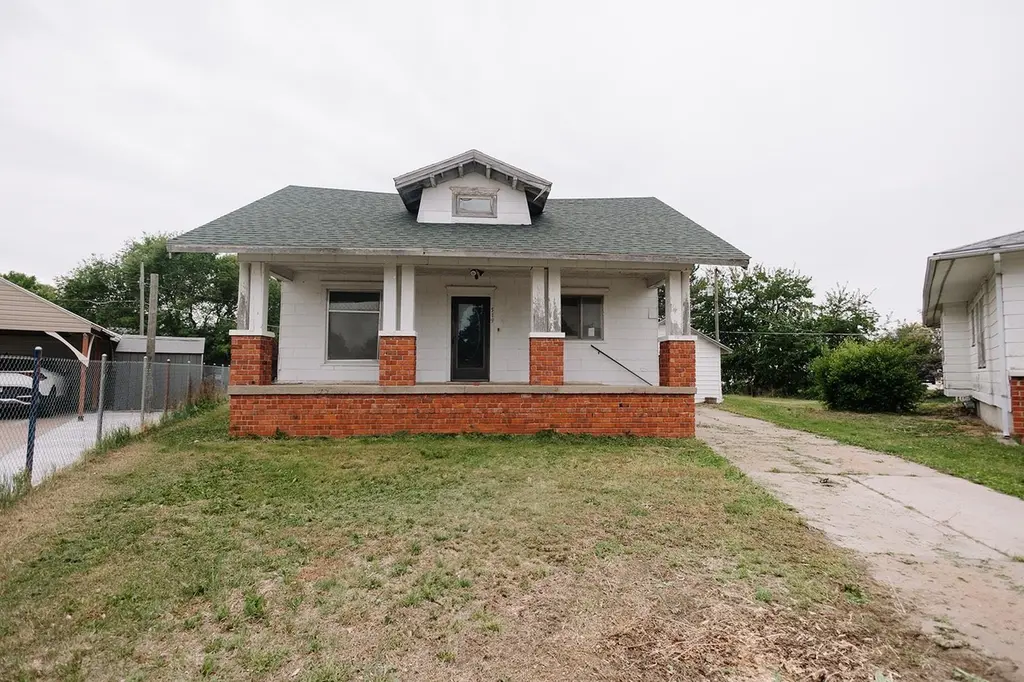
519 O'neill Cir · Grand Island, NE
Flood risk 1/10 · Minimal
- FEMA flood zone
- X (unshaded)
- Chance of flooding over 30 yrs
- 0.0%
- Est. flood insurance / yr
- $473 – $860
Fire risk 1/10 · Minimal
- Est. fire insurance / yr
- $1,161 – $2,155
Heat risk 3/10 · Minor
- Hot days now (above 103°F)
- 7 days/yr
- Hot days in 30 yrs
- 16 days/yr
Wind risk 2/10 · Minimal
- Chance of severe wind over 30 yrs
- —
Air-quality risk 1/10 · Minimal
- Unhealthy air days now
- 0 days/yr
- Unhealthy air days in 30 yrs
- 0 days/yr
Risk factors via First Street. Map © Google.
Why this score? — see what drove the C+ grade
The composite is a weighted blend of 9 inputs, each scored 0–100. Each bar is that input's sub-score; the figure is the points it added to the 100-point composite (weight × sub-score).
- Cash flow +21.1/30.0
- ARV discount +15.0/15.0
- DSCR +6.7/10.0
- 1% rule +5.3/10.0
- Livability +4.0/5.0
- Schools +3.1/10.0
- Rent growth +2.5/5.0
- Condition / age +2.5/5.0
- Appreciation +0.0/10.0
$149,900
🖨 Deal sheet 📄 Offer letter ✓ Due diligence
Listing remarks MLS
3 bedroom home in a culdesac that has large rooms. Bath on each floor. 1 car attached garage.
Key facts
- Large lot
- Full basement
- Original charm
Tags
Property features AI
Finance
- Other: Lot size approximately 8,835 (units as provided)
- Financial info: Annual taxes listed
Exterior
- Parking: Detached 1-car garage
- Home design: Single-family residential property
- Exterior features: Zoned R3
Interior
- Bathrooms: One main-level bathroom
- Interior features: Basement present
Neighborhood map
What this means for you Summary
Snapshot
- This is a 3-bed/2.0-bath single-family listed at $150k.
Deal economics
- At list price, monthly cash flow is $214 ($3k/yr) — positive.
- The deal already cash-flows at list — no discount required.
- Meets the 1% rule at list price ($2k rent vs $150k).
- Cap rate 8.0% vs local median 3.6% in Grand Island — top-decile yield for the area; either an underpriced asset or a hidden risk that comps aren't pricing in. Stress-test before assuming the spread holds.
Location & tenants
- Location reads 79/100 on livability (#43 in NE, #2,252 nationally) — a middle-class / working-renter tenant base. Strengths: cost of living A+, housing A+, health & safety A+; Watch: crime C-, schools D+, commute F.
- Grand Island Public Schools (urban): math 36% / reading 36% proficiency, ranked #102 of 111 in NE (top 92%) — families likely to look elsewhere, expect single-tenant / working-renter base with shorter leases.
- Market conditions: 160 active listings in the ZIP; 4 comparable units currently listed for rent nearby; rentals lingering (median 44d on market — plan ~5-8 weeks vacancy on turnover, expect pricing pressure); 100% of comp listings sitting > 30 days — soft ceiling on asking rent; 246 units permitted in Hall County in 2024 (98 in 5+ unit buildings).
Forward outlook
- Local home prices are declining (-3.0%/yr); year-one equity from $1k of loan paydown is wiped out by about $4k of value loss. Plan a longer hold.
- Hall County population projected at +27% by 2050 — long-run rental-demand tailwind backs the buy-and-hold thesis.
Negotiation context
- Only 6 days on market — expect competitive offers; lowballing is unlikely to land.
- 2 sale attempts since 6y ago with the ask held roughly flat each time — persistent listings suggest the price (not the market) is what's stuck; bring a comps-based counter.
- Current owner paid $105k; 43% above their basis — modest negotiation headroom, anchor on the comps not their cost.
Risks & watch-outs
- Watch-outs: built in 1930 — expect roof / HVAC / electrical / plumbing capex.
Questions for the listing agent
- Built in 1930 — when were the roof, HVAC, electrical panel, plumbing, and water heater last replaced?
- Is there a deadline driving the sale (1031 exchange, divorce, estate, relocation)? That informs how much negotiation room exists.
- Schools are D-rated, which usually means shorter tenancies and higher turnover. Who's the typical renter profile here, and what's been the actual vacancy rate?
- What's the average days-on-market for RENTAL listings here right now (not sales)? A rising rental-DOM trend means longer vacancies and softer asking-rent achievability than the comps imply.
- What's the recent tenant-quality profile in this submarket — average credit score on applications, eviction rate, late-payment / NSF rate, and stable-employment percentage? A property-management company in the area should have these aggregated.
- How much new for-sale + rental construction is in the pipeline within 1–3 miles? Heavy new supply typically softens prices + rents 12–24 months out; constrained supply supports both.
Investment metrics
- 1% rule
- 1.03% ✓
- Cap rate
- 8.00%
- Cash-on-cash
- 6.11%
- DSCR
- 1.27
- GRM
- 8.1
CMA / ARV
- ARV (on-the-fly)
- $245,915
- Comps found
- 12
Show comp detail 12 sales within ~0.75 mi
| Address | Dist | Beds/Ba | Sqft | Sold | Price | $/sf | Match |
|---|---|---|---|---|---|---|---|
| 620 S Washington St | 0.42mi | 4/2.0 (+1) | 1,768 (-2%) | 4mo | $217,000 | $123 | 70 |
| 1512 Windsor Rd | 0.40mi | 3/1.5 | 1,896 (+6%) | 7mo | $306,000 | $161 | 64 |
| 1515 W Stolley Park Rd | 0.58mi | 2/2.0 (-1) | 1,728 (-4%) | 1mo | $180,000 | $104 | 61 |
| 1512 Spruce Pl | 0.44mi | 3/2.0 | 1,558 (-13%) | 1mo | $300,000 | $193 | 57 |
| 319 E South St | 0.45mi | 3/2.5 | 1,600 (-11%) | 3mo | $225,000 | $141 | 56 |
| 420 W Stolley Park Rd | 0.44mi | 4/2.0 (+1) | 1,650 (-8%) | 9mo | $238,500 | $145 | 54 |
| 706 Grand Ave | 0.57mi | 4/2.0 (+1) | 1,914 (+7%) | 8mo | $385,000 | $201 | 51 |
| 404 W Stolley Park Ave | 0.44mi | 4/2.0 (+1) | 2,030 (+13%) | 2mo | $278,000 | $137 | 51 |
| 1419 Hagge Ave | 0.61mi | 4/2.0 (+1) | 1,960 (+9%) | 2mo | $235,000 | $120 | 50 |
| 2121 August St | 0.64mi | 3/1.0 | 2,000 (+11%) | 2mo | $230,000 | $115 | 45 |
| 912 W Koenig St | 0.71mi | 2/2.0 (-1) | 1,684 (-6%) | 8mo | $205,000 | $122 | 45 |
| 1015 S Plum St | 0.73mi | 2/2.0 (-1) | 1,584 (-12%) | 9mo | $215,000 | $136 | 34 |
Match score weights: distance 35% · size 25% · config 20% · recency 20%. Top-matched comps best support the ARV.
Projected returns pro-forma
-3.0% appreciation · 3.0% rent growth · sell at horizon
- IRR
- -6.9%
- Equity multiple
- 0.75×
- Total profit
- $-10,683
- Equity at exit
- $22,351
- IRR
- 2.7%
- Equity multiple
- 1.20×
- Total profit
- $8,238
- Equity at exit
- $12,961
Cash invested: $41,972 (down + closing). Projections, not guarantees.
Landlord ↔ Tenant lean methodology
- Overall (STATE)
- 83 Strongly Landlord-Friendly
- State Nebraska
- 83 Strongly Landlord-Friendly · R+13
- County
- — inherits STATE
- City
- — inherits STATE
ZIP-level market 68801
- Active inventory
- 160
- Price-to-rent
- 8.1×
Monthly cashflow live
- Estimated rent
- $1,548 medium interval (Pro) →
- Mortgage (P&I)
- −$786
- Tax from tax record
- −$161 /mo · $1,931/yr
- Insurance
- −$62
- HOA
- −$0
- Vacancy / Maint / Mgmt
- −$325
- Net cashflow
- $214
Break-even live
UW: 25.0% down · 7.5% · 30yr · 1.5% tax · 5.0% vac · 8.0% maint · 8.0% mgmt
Financing live
Cash to close
- Down payment
- $37,475
- Closing costs
- $4,497
- Reserves months
- —
- Total cash needed
- —
Loan-product check · same deal, 3 products live
Conventional
25% down · 7.5% · 30yr
- Down + closing
- —
- Monthly P&I
- —
- Monthly cashflow
- —
- DSCR
- —
- Eligible?
- —
Personal DTI + credit; lowest rate.
DSCR
20% down · 8.5% · 30yr
- Down + closing
- —
- Monthly P&I
- —
- Monthly cashflow
- —
- DSCR
- —
- Eligible?
- —
No personal income docs; deal must DSCR.
Hard money
10% down · 12.0% · 12mo
- Down + closing
- —
- Monthly P&I
- —
- Monthly cashflow
- —
- DSCR
- —
- Eligible?
- —
Short-term bridge; refi at stabilization.
Rent comps 4 comps
| Address | Beds | Baths | Sqft | Rent | $/sqft | DOM | Units | Dist |
|---|---|---|---|---|---|---|---|---|
| 1124 S Pine St Grand Island, NE | 2.0 | 2.5 | 1300 | $1,450 | $1.12 | 43d | 1 | 0.29mi |
| 1408 W Koenig St Grand Island, NE | 3.0 | 1.5 | 1817 | $1,800 | $0.99 | 43d | 1 | 0.68mi |
| 315 W Koenig St Unit 1/2 Grand Island, NE | 3.0 | 1.0 | 1319 | $900 | $0.68 | 43d | 1 | 0.85mi |
| 2304 W George St Unit 2 Grand Island, NE | 2.0 | 2.0 | 1800 | $1,800 | $1.00 | 43d | 1 | 1.29mi |
Listing history 3 events
-
2026-05-21$149,900 Active
-
2020-12-22soldstatus $105,000 93-char remark
Show marketing remark (93 chars)
3 bedroom home in a culdesac that has large rooms. Bath on each floor. 1 car attached garage.
-
2020-09-23$105,900 93-char remark
Show marketing remark (93 chars)
3 bedroom home in a culdesac that has large rooms. Bath on each floor. 1 car attached garage.
ⓘ Source: listings_history table (triggers on properties + properties_extension) + one-shot
backfill from property_details.listing_events for pre-trigger history.
Tax reassessment forecast NE · Resets to sale price
- Current annual tax
- $1,931 · $161/mo
- Projected year-2 tax
- $2,593 · $216/mo
- Expected delta
- +$663/yr (+$55/mo · 34.3%)
ⓘ Screening estimate from a state-policy table — verify with the county assessor before closing.
Climate risk First Street
- Flood 1/10 Low FEMA zone X (unshaded) · 0% chance over 30 yrs
- Wildfire 1/10 Low
- Heat 3/10 Moderate 7 d/yr ≥103°F today · 16 d/yr by 30 yrs out
- Wind 2/10 Low
- Air quality 1/10 Low 0 unhealthy d/yr today · 0 by 30 yrs out
Nearby sold comps map
Loading sold comps map…
Walkable amenities ~0.75 mi
Loading nearby amenities…
Taxation est. · year 1
- Rental income
- $18,577
- − Mortgage interest
- −$8,397
- − Property taxes
- −$1,931
- − Insurance
- −$750
- − Repairs & maintenance
- −$1,486
- − Management
- −$1,486
- − Depreciation
- −$4,361
- Taxable income
- $167
- Est. tax owed @ 24.0%
- −$40
- After-tax cash flow
- $2,522/yr
For passive investors: Depreciation is non-cash, so a rental often shows a tax loss while cash-flowing — sheltering income. Rental losses are passive: they offset passive income freely, and up to $25,000/yr can offset ordinary (W-2) income if you actively participate and your MAGI is under $100k (phasing out to $0 by $150k); unused losses carry forward. On sale, claimed depreciation is recaptured at up to 25%, and gains may owe capital-gains tax (a 1031 exchange can defer both). Figures are a year-1 estimate at your 24.0% rate — not tax advice; consult a CPA.
Schools (NCES district)
- District
- Grand Island Public Schools
- NCES district ID
- 3100016
- Math proficiency
- 36% ▼ -5.00%
- Reading proficiency
- 36% ▼ -5.00%
- Median HH income
- $47,021
- Composite
- 30.9/100
- National rank
- #6117
- State rank
- #102 of 111 in NE
Livability — Grand Island
- Score
- 79/100
- State rank
- #43
- US rank
- #2252
Category grades
Schools grade is shown separately in the Schools card above.
Census & demographics
- Census place
- Grand Island, NE
- County
- Hall County · 56,358 people
- City population
- 56,358
- Metro
- Grand Island, NE
- Population (ZIP)
- 30,824
- Household income
- $63,617
- Rent vs Own
- Severe rent burden
- 895.0
Population outlook (Hall County) Hauer SSP2
- Today (2025)
- 68,137 people
- By 2030
- 71,543 · +5.0%
- By 2040
- 78,843 · +15.7%
- By 2050
- 86,765 · +27.3%
- By 2075
- 111,764 · +64.0%
- By 2100
- 137,991 · +102.5%
Race, ethnicity, and origin ACS 2023
- Neighborhood character
- Diverse neighborhood (Simpson 0.58)
- Race & ethnicity
- White 49% Hispanic / Latino 42% Two or more races 13% Black 5% Native American 1% Asian 1%
- Hispanic origin (detail)
- Mexican 22% Cuban 4%
- Common ancestry
- Romanian 3% Ukrainian 2% Lithuanian 1%
- Foreign-born
- 22% · Canada
- Languages at home
- 64% English-only · Spanish 32% Arabic 1% Other Asian/Pacific 1%
Political lean MEDSL · Hall
- 2024 margin
- Solid R (+37.8) · D 30.5% · R 68.3% · Other 1.2%
- 2008→2024 swing
- -13.7pp toward R · 2008: -24.1pp · 2024: -37.8pp
- All cycles
- 2024: R+37.8 2020: R+34.8 2016: R+37.5 2012: R+27.6 2008: R+24.1
Not yet ingested
- Civics
- —
Market trends
- HPI YoY
- ▼ -148.38%
- Current HPI
- 230.3861
- Rent YoY
- —
- Metro
- Grand Island, NE
- State GDP YoY
- ▲ 0.68%
- F500 in state
- 2
Industry mix (Fortune 500 HQ in NE)
| Industry | F500 HQs | Revenue |
|---|---|---|
| Conglomerate | 1 | $371B |
|
||
Price history
+41.5% since first listed3 events — show timeline
- 2026-05-21 Listed $149,900 GMNMLS
- 2020-12-22 Sold (MLS) $105,000 GIBOR
- 2020-09-23 Listed $105,900 GIBOR
Property tax history
-0.1%/yrLatest (2025): $1,931 · +3.9% YoY. Source: county tax records.
Cash-flow waterfall
monthlySold comps — $/sqft
last 12 mo · ≤1 miLoading sold comps…