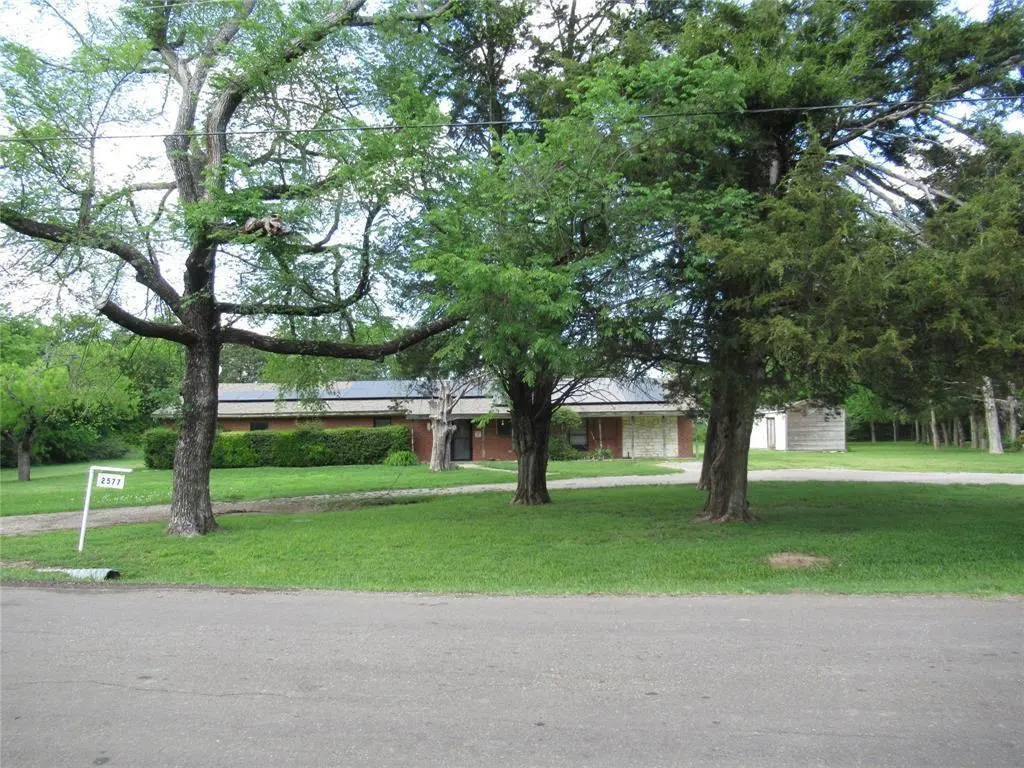
2577 County Road 2226 · Caddo Mills, TX
Flood risk 1/10 · Minimal
- FEMA flood zone
- X (unshaded)
- Chance of flooding over 30 yrs
- 0.0%
- Est. flood insurance / yr
- $507 – $1,088
Fire risk 6/10 · Moderate
- Est. fire insurance / yr
- $1,222 – $2,270
Heat risk 7/10 · Major
- Hot days now (above 111°F)
- 7 days/yr
- Hot days in 30 yrs
- 24 days/yr
Wind risk 6/10 · Moderate
- Chance of severe wind over 30 yrs
- 27.0%
Air-quality risk 2/10 · Minimal
- Unhealthy air days now
- 1 days/yr
- Unhealthy air days in 30 yrs
- 1 days/yr
Risk factors via First Street. Map © Google.
Why this score? — see what drove the F grade
The composite is a weighted blend of 9 inputs, each scored 0–100. Each bar is that input's sub-score; the figure is the points it added to the 100-point composite (weight × sub-score).
- Cash flow +7.8/30.0
- ARV discount +7.5/15.0
- Schools +5.2/10.0
- Livability +3.7/5.0
- 1% rule +3.2/10.0
- Rent growth +2.5/5.0
- Condition / age +2.5/5.0
- DSCR +1.9/10.0
- Appreciation +0.0/10.0
$269,000
🖨 Deal sheet (PDF) 📄 Offer letter ✓ Due diligence
Listing remarks MLS
1.3 ACS. FM 36 - COUNTRY LIVING WITH TREE LINED CIRCLE DRIVEWAY ENTRY. WAITING FOR A FAMILY. 3 BEDROOM, 2 BATH, 2 DINING AREAS, AND MEDIA ROOM FOR ENTERTAINMENT, WOOD BURNING FIREPLACE, LOT OF CERAMIC FLOORING, CARPET, HVAC, 1 WINDOW UNIT, SOLAR PANELS, METAL BLDG WITH ELECTRIC, STORAGE BLDG FOR A BOAT OR WORKSHOP. HOME NEEDS TLC. SCATTERED CONCRETE SIDEWALKS. YOU WILL LIKE THE BACKYARD. COME AND TAKE A LOOK!
Key facts
- Storage building
- Solar panels
- Media room
Tags
Neighborhood map
What this means for you Summary
Snapshot
- This is a 3-bed/4.0-bath single-family listed at $269k.
Deal economics
- At list price, monthly cash flow is $-297 ($-4k/yr) — negative.
- To cash-flow at today's rent, offer at most $216k (19.5% below list).
- To meet the 1% rule (rent ≥ 1% of price), the offer needs to be $220k (18.1% below list).
- Recommended offer: $216k (19.5% below list) — sets the bar for cash-flow.
- Cap rate 5.0% vs local median 3.9% in Caddo Mills — meaningfully above typical; check what's discounted (condition, days-on-market, listing class) to confirm the premium yield is real.
Location & tenants
- Location reads 73/100 on livability (#216 in TX) — a middle-class / working-renter tenant base. Strengths: crime A+, cost of living A+, housing A+; Watch: amenities F, commute F.
- Caddo Mills ISD (rural): math 59% / reading 59% proficiency, ranked #60 of 826 in TX (top 7%) — acceptable for families but not a draw, mixed tenant base, ~2y average lease.
- Zoned schools: Kathryn Griffis El (math 62% / reading 64%, grade B, #300 of 4,322 statewide, top 7%, 568 students, 34% FRL); Caddo Mills Middle (math 51% / reading 53%, grade C+, #301 of 1,662 statewide, top 19%, 416 students, 28% FRL); Caddo Mills H S (math 72% / reading 77%, grade B+, #82 of 1,632 statewide, top 6%, 681 students, 28% FRL) — zoned schools at 30% FRL track the district average.
- Market conditions: 317 active listings in the ZIP; 1,289 units permitted in Hunt County in 2024 (527 in 5+ unit buildings).
Forward outlook
- Local home prices are declining (-3.0%/yr); year-one equity from $2k of loan paydown is wiped out by about $8k of value loss. Plan a longer hold.
- Hunt County population projected at +15% by 2050 — modest demand growth; plan on rents tracking national, not racing it.
Negotiation context
- It's been on market 71 days — a 6% lower offer ($253k) is reasonable based on typical stale-listing flexibility.
Risks & watch-outs
- Climate carrying-cost: major wind risk, 27% chance of damaging wind over 30y; major wildfire risk; extreme-heat days projected 7→24/yr by 2055 (HVAC capex compounding) — expect insurance premiums to compound above CPI over the hold.
Questions for the listing agent
- What do current leases actually rent for vs. the listed asking? Can we see a recent rent roll and the last 12 months of T-12 income?
- It's been on market 71 days. Have you received any prior offers? Is the seller open to a 20% concession, seller financing, or rate buy-down credit?
- Why hasn't it sold? Are there any deal-killer items the seller is aware of (foundation, flood, title, zoning, code violations)?
- Is there a deadline driving the sale (1031 exchange, divorce, estate, relocation)? That informs how much negotiation room exists.
- Schools are B-rated — typically a magnet for longer-tenancy family renters. What's the average tenant stay here, and is there a school-zone premium baked into asking?
- The area grade is low — what's the realistic commute time and amenity access for the typical tenant pool here? Any planned neighborhood developments (good or bad) we should know about?
- What's the average days-on-market for RENTAL listings here right now (not sales)? A rising rental-DOM trend means longer vacancies and softer asking-rent achievability than the comps imply.
- What's the recent tenant-quality profile in this submarket — average credit score on applications, eviction rate, late-payment / NSF rate, and stable-employment percentage? A property-management company in the area should have these aggregated.
- How much new for-sale + rental construction is in the pipeline within 1–3 miles? Heavy new supply typically softens prices + rents 12–24 months out; constrained supply supports both.
Investment metrics
- 1% rule
- 0.82% ✗
- Cap rate
- 4.97%
- Cash-on-cash
- -4.74%
- DSCR
- 0.79
- GRM
- 10.2
CMA / ARV
- ARV (median comp)
- $649,185
- List price
- $269,000
- Delta
- -58.56%
- Verdict
- UNDERPRICED
- Comps
- 3 within 1.0 mi
Projected returns pro-forma
-3.0% appreciation · 3.0% rent growth · sell at horizon
- IRR
- -24.3%
- Equity multiple
- 0.17×
- Total profit
- $-62,387
- Equity at exit
- $40,109
- IRR
- -19.4%
- Equity multiple
- -0.04×
- Total profit
- $-78,135
- Equity at exit
- $23,258
Cash invested: $75,320 (down + closing). Projections, not guarantees.
Landlord ↔ Tenant lean methodology
- Overall (STATE)
- 87 Strongly Landlord-Friendly
- State Texas
- 87 Strongly Landlord-Friendly · R+5
- County
- — inherits STATE
- City
- — inherits STATE
ZIP-level market 75135
- Home prices YoY
- -13.5%
- Active inventory
- 317
- Price-to-rent
- 10.2×
Monthly cashflow live
- Estimated rent
- $2,202 medium interval (Pro) →
- Mortgage (P&I)
- −$1,411
- Tax from tax record
- −$514 /mo · $6,172/yr
- Insurance
- −$112
- HOA
- −$0
- Vacancy / Maint / Mgmt
- −$462
- Net cashflow
- $-297
Break-even live
Sensitivity live
| Price | -10% $-145 | -5% $-221 | +0% $-297 | +5% $-374 | +10% $-450 |
|---|---|---|---|---|---|
| Rent | -10% $-471 | -5% $-384 | +0% $-297 | +5% $-210 | +10% $-123 |
| Rate | -1.0pp $-162 | -0.5pp $-229 | base $-297 | +0.5pp $-367 | +1.0pp $-438 |
UW: 25.0% down · 7.5% · 30yr · 1.5% tax · 5.0% vac · 8.0% maint · 8.0% mgmt
Financing live
Cash to close
- Down payment
- $67,250
- Closing costs
- $8,070
- Reserves months
- —
- Total cash needed
- —
Loan-product check · same deal, 3 products live
Conventional
25% down · 7.5% · 30yr
- Down + closing
- —
- Monthly P&I
- —
- Monthly cashflow
- —
- DSCR
- —
- Eligible?
- —
Personal DTI + credit; lowest rate.
DSCR
20% down · 8.5% · 30yr
- Down + closing
- —
- Monthly P&I
- —
- Monthly cashflow
- —
- DSCR
- —
- Eligible?
- —
No personal income docs; deal must DSCR.
Hard money
10% down · 12.0% · 12mo
- Down + closing
- —
- Monthly P&I
- —
- Monthly cashflow
- —
- DSCR
- —
- Eligible?
- —
Short-term bridge; refi at stabilization.
Listing history 17 events
-
2026-06-21days on market $269,000 Active 71 DOM
-
2026-06-18days on market $269,000 Active 68 DOM
-
2026-06-17days on market $269,000 Active 67 DOM
-
2026-06-16days on market $269,000 Active 66 DOM
-
2026-06-15price $269,000 Active 65 DOM
-
2026-06-15days on market $282,500 Active 65 DOM
-
2026-06-13days on market $282,500 Active 63 DOM
-
2026-06-13days on market $282,500 Active 62 DOM
-
2026-06-09days on market $282,500 Active 59 DOM
-
2026-06-08days on market $282,500 Active 58 DOM
-
2026-06-07days on market $282,500 Active 57 DOM
-
2026-06-04days on market $282,500 Active 54 DOM
-
2026-06-03days on market $282,500 Active 53 DOM
-
2026-06-02days on market $282,500 Active 52 DOM
-
2026-06-01days on market $282,500 Active 51 DOM
-
2026-05-31days on market $282,500 Active 50 DOM
-
2026-04-09$282,500 Active 418-char remark
Show marketing remark (418 chars)
1.3 ACS. FM 36 - COUNTRY LIVING WITH TREE LINED CIRCLE DRIVEWAY ENTRY. WAITING FOR A FAMILY. 3 BEDROOM, 2 BATH, 2 DINING AREAS, AND MEDIA ROOM FOR ENTERTAINMENT, WOOD BURNING FIREPLACE, LOT OF CERAMIC FLOORING, CARPET, HVAC, 1 WINDOW UNIT, SOLAR PANELS, METAL BLDG WITH ELECTRIC, STORAGE BLDG FOR A BOAT OR WORKSHOP. HOME NEEDS TLC. SCATTERED CONCRETE SIDEWALKS. YOU WILL LIKE THE BACKYARD. COME AND TAKE A LOOK!
ⓘ Source: listings_history table (triggers on properties + properties_extension) + one-shot
backfill from property_details.listing_events for pre-trigger history.
Tax reassessment forecast TX · Resets to sale price
- Current annual tax
- $6,172 · $514/mo
- Projected year-2 tax
- $6,172 · $514/mo
- Expected delta
- $0/yr ($0/mo · 0.0%)
ⓘ Screening estimate from a state-policy table — verify with the county assessor before closing.
Climate risk First Street
- Flood 1/10 Low FEMA zone X (unshaded) · 0% chance over 30 yrs
- Wildfire 6/10 Major
- Heat 7/10 Severe 7 d/yr ≥111°F today · 24 d/yr by 30 yrs out
- Wind 6/10 Major 27% chance of damaging wind over 30 yrs
- Air quality 2/10 Low 1 unhealthy d/yr today · 1 by 30 yrs out
Nearby sold comps map
Loading sold comps map…
Walkable amenities ~0.75 mi
Loading nearby amenities…
Taxation est. · year 1
- Rental income
- $26,426
- − Mortgage interest
- −$15,068
- − Property taxes
- −$6,172
- − Insurance
- −$1,345
- − Repairs & maintenance
- −$2,114
- − Management
- −$2,114
- − Depreciation
- −$7,825
- Taxable loss
- −$8,213
- Est. tax savings @ 24.0%
- +$1,971
- After-tax cash flow
- $-1,598/yr
For passive investors: Depreciation is non-cash, so a rental often shows a tax loss while cash-flowing — sheltering income. Rental losses are passive: they offset passive income freely, and up to $25,000/yr can offset ordinary (W-2) income if you actively participate and your MAGI is under $100k (phasing out to $0 by $150k); unused losses carry forward. On sale, claimed depreciation is recaptured at up to 25%, and gains may owe capital-gains tax (a 1031 exchange can defer both). Figures are a year-1 estimate at your 24.0% rate — not tax advice; consult a CPA.
Schools (NCES district)
- District
- Caddo Mills ISD
- NCES district ID
- 4812390
- Math proficiency
- 59% ▼ -6.00%
- Reading proficiency
- 59% ▬ 0.00%
- Median HH income
- $65,383
- Composite
- 51.73/100
- National rank
- #1684
- State rank
- #60 of 826 in TX
Livability — Caddo Mills
- Score
- 73/100
- State rank
- #216
- US rank
- #5332
Category grades
Schools grade is shown separately in the Schools card above.
Census & demographics
- City population
- 10,265
- Population (ZIP)
- 10,265
Population outlook (Hunt County) Hauer SSP2
- Today (2025)
- 97,090 people
- By 2030
- 100,452 · +3.5%
- By 2040
- 106,544 · +9.7%
- By 2050
- 111,218 · +14.6%
- By 2075
- 121,695 · +25.3%
- By 2100
- 123,683 · +27.4%
Race, ethnicity, and origin ACS 2023
- Neighborhood character
- Predominantly White (67%)
- Race & ethnicity
- White 67% Hispanic / Latino 24% Two or more races 14% Black 3%
- Hispanic origin (detail)
- Mexican 21% Cuban 2%
- Common ancestry
- Lithuanian 4% Slovak 1% Italian 1%
- Foreign-born
- 7% · Canada, South Korea
- Languages at home
- 84% English-only · Spanish 13% Korean 1% German/W. Germanic 1%
Political lean MEDSL · Hunt
- 2024 margin
- Solid R (+55.5) · D 21.9% · R 77.4%
- 2008→2024 swing
- -14.9pp toward R · 2008: -40.6pp · 2024: -55.5pp
- All cycles
- 2024: R+55.5 2020: R+52.5 2016: R+56.3 2012: R+51.2 2008: R+40.6
Not yet ingested
- Civics
- —
Market trends
- HPI YoY
- ▼ -43.07%
- Current HPI
- 275.2189
- Rent YoY
- —
- Metro
- —
- State GDP YoY
- ▲ 3.95%
- F500 in state
- 110
Industry mix (Fortune 500 HQ in TX)
| Industry | F500 HQs | Revenue |
|---|---|---|
| Energy | 16 | $1,198B |
|
||
| Technology | 5 | $198B |
|
||
| Engineering / Construction | 4 | $72B |
|
||
| Energy Services | 3 | $60B |
|
||
| Utilities | 3 | $41B |
|
||
| Healthcare | 2 | $330B |
|
||
Price history
1 event — show timeline
- 2026-04-09 Listed $282,500 NTREIS
Property tax history
+6.7%/yrLatest (2025): $6,172 · +50.7% YoY. Source: county tax records.
Cash-flow waterfall
monthlySold comps — $/sqft
last 12 mo · ≤1 miLoading sold comps…