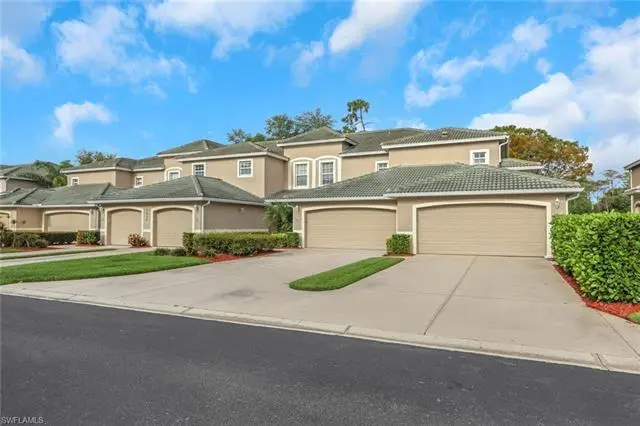
3435 Laurel Greens Ln S #203 · Bonita Springs, FL
Flood risk 1/10 · Minimal
- FEMA flood zone
- X (shaded)
- Chance of flooding over 30 yrs
- 0.0%
- Est. flood insurance / yr
- $507 – $1,088
Fire risk 3/10 · Minor
- Est. fire insurance / yr
- $947 – $1,759
Heat risk 10/10 · Severe
- Hot days now (above 108°F)
- 7 days/yr
- Hot days in 30 yrs
- 30 days/yr
Wind risk 10/10 · Severe
- Chance of severe wind over 30 yrs
- 99.0%
Air-quality risk 2/10 · Minimal
- Unhealthy air days now
- 2 days/yr
- Unhealthy air days in 30 yrs
- 2 days/yr
Risk factors via First Street. Map © Google.
Why this score? — see what drove the D grade
The composite is a weighted blend of 9 inputs, each scored 0–100. Each bar is that input's sub-score; the figure is the points it added to the 100-point composite (weight × sub-score).
- Cash flow +11.5/30.0
- ARV discount +7.5/15.0
- 1% rule +6.6/10.0
- Schools +5.0/10.0
- Livability +3.5/5.0
- DSCR +3.4/10.0
- Condition / age +2.5/5.0
- Rent growth +1.9/5.0
- Appreciation +0.0/10.0
$415,000
🖨 Deal sheet (PDF) 📄 Offer letter ✓ Due diligence
Listing remarks
Beautifully updated 3-bedroom, 2-bath turnkey furnished corner-unit condo with a 2-car garage and serene golf course views. This light-filled residence features a brand-new kitchen with updated appliances and new flooring, seamlessly opening into spacious living and dining areas designed for comfort and easy entertaining. The split-bedroom layout offers privacy, while well-maintained bathrooms and a meticulously cared-for interior make this home truly move-in ready. Additional highlights include a brand-new garage system with a 5-year warranty and carpet with a lifetime warranty. Bundled golf membership included, delivering exceptional value and access to a beautifully maintained course. Th
Key facts
- Updated appliances
- Tennis
- Pickleball courts
Tags
Property features AI
Finance
- Other: Unit in building of 8 units; complex has 767 units; Single-floor unit; 2 units per floor; Subdivision/unit references: Laurel Greens, Lot Unit 203, Section 18
- HOA & community: Mandatory HOA with quarterly fee; HOA fee $1,460 quarterly; Master HOA fee $10,502 annually; Total annual recurring fees $16,342; Condo management; HOA maintenance covers legal/accounting, manager, exterior pest control, and recreation facilities; Community amenities include clubhouse, community pool and spa/hot tub, exercise room, attended fitness center, golf course, bocce court, pickleball, tennis courts, restaurant, sidewalks, and streetlights
Exterior
- Parking: Attached 2-car garage
- Security: Gated community
- Utilities: Central water; Central sewer; Cable available
- Home design: Residential carriage/coach style; Low-rise building (1-3 stories); Built in 2005; Rear exposure facing northwest; Located in Cypress Woods Golf and Country Club, golf-bundled community
- Construction: Concrete block construction
- Exterior features: Stucco exterior; Tile roof; Double-hung windows; Impact resistant doors and windows; Golf course view; No canal
Interior
- Kitchen: Electric cooktop; Dishwasher; Microwave; Refrigerator/Freezer
- Bedrooms: 3 bedrooms (split bedroom floor plan)
- Flooring: Carpet; Tile; Wood
- Bathrooms: 2 full bathrooms; Master bath with separate tub and shower
- Heating & cooling: Central electric heating; Central electric cooling
- Interior features: Cable prewire; Cathedral ceiling; Tray ceiling; Vaulted ceiling; High-speed internet available; Walk-in closet; Dining (living) and eat-in kitchen; Laundry in residence; Screened lanai/porch; Turnkey
- Laundry & utility: Washer; Dryer; Auto garage door; Smoke detector
Neighborhood map
What this means for you Summary
Snapshot
- This is a 3-bed/2.0-bath condo listed at $415k.
Deal economics
- At list price, monthly cash flow is $-135 ($-2k/yr) — negative.
- To cash-flow at today's rent, offer at most $391k (5.7% below list).
- Meets the 1% rule at list price ($5k rent vs $415k).
- Recommended offer: $390k (6.0% below list) — sets the bar for market timing.
- Cap rate 5.9% vs local median 1.7% in Bonita Springs — top-decile yield for the area; either an underpriced asset or a hidden risk that comps aren't pricing in. Stress-test before assuming the spread holds.
Location & tenants
- Location reads 70/100 on livability (#428 in FL) — a middle-class / working-renter tenant base. Strengths: crime A+, housing A+, employment A; Watch: cost of living C-, health & safety D, amenities F.
- Collier (suburban): math 60% / reading 56% proficiency, ranked #16 of 73 in FL (top 22%) — acceptable for families but not a draw, mixed tenant base, ~2y average lease.
- Zoned schools: Veterans Memorial Elementary School (math 78% / reading 79%, grade A, #141 of 2,144 statewide, top 7%, 743 students, 22% FRL); North Naples Middle School (math 79% / reading 73%, grade A, #34 of 571 statewide, top 6%, 903 students, 25% FRL); Gulf Coast High School (math 57% / reading 68%, grade B-, #93 of 667 statewide, top 14%, 2,447 students, 20% FRL) — zoned schools average 22% FRL vs 55% district-wide (33 pts lower); this property's tenant base skews higher-income than the district average.
- Zoned-school proficiency averages 72% at this address vs 58% district-wide (+14 pts) — the actual schools serving this property are materially stronger than the Collier average implies; a family-tenant draw the district grade alone would hide.
- Market conditions: Rents soft (-2.5%/yr); 590 active listings in the ZIP; 40 comparable units currently listed for rent nearby; rentals at typical pace (median 26d on market — plan ~3-4 weeks tenant-placement turnaround); high-income renter base; 3,520 units permitted in Collier County in 2024 (959 in 5+ unit buildings).
Forward outlook
- Local home prices are declining (-3.0%/yr); year-one equity from $3k of loan paydown is wiped out by about $12k of value loss. Plan a longer hold.
- Collier County population projected at +30% by 2050 — long-run rental-demand tailwind backs the buy-and-hold thesis.
Negotiation context
- It's been on market 78 days — a 6% lower offer ($390k) is reasonable based on typical stale-listing flexibility.
- 6 sale attempts since 11y ago with the ask held roughly flat each time — persistent listings suggest the price (not the market) is what's stuck; bring a comps-based counter.
- Current owner paid $260k; list at $415k implies a 60% gain — meaningful room to come down on a strong offer.
Risks & watch-outs
- Watch-outs: HOA is 28% of rent.
- Climate carrying-cost: severe wind risk, 99% chance of damaging wind over 30y; extreme-heat days projected 7→30/yr by 2055 (HVAC capex compounding) — expect insurance premiums to compound above CPI over the hold.
Questions for the listing agent
- What do current leases actually rent for vs. the listed asking? Can we see a recent rent roll and the last 12 months of T-12 income?
- It's been on market 78 days. Have you received any prior offers? Is the seller open to a 6% concession, seller financing, or rate buy-down credit?
- What does the HOA fee cover, when was the last increase, and are there any pending special assessments or reserve-fund shortfalls?
- Any open or pending special assessments — roof, HVAC, plumbing, elevator, façade? What's the per-unit balance and payoff schedule, and is the seller paying it off at close or rolling it to the buyer?
- Why hasn't it sold? Are there any deal-killer items the seller is aware of (foundation, flood, title, zoning, code violations)?
- Is there a deadline driving the sale (1031 exchange, divorce, estate, relocation)? That informs how much negotiation room exists.
- The area grade is low — what's the realistic commute time and amenity access for the typical tenant pool here? Any planned neighborhood developments (good or bad) we should know about?
- What's the average days-on-market for RENTAL listings here right now (not sales)? A rising rental-DOM trend means longer vacancies and softer asking-rent achievability than the comps imply.
- What's the recent tenant-quality profile in this submarket — average credit score on applications, eviction rate, late-payment / NSF rate, and stable-employment percentage? A property-management company in the area should have these aggregated.
- How much new apartment / multifamily construction is in the pipeline within 1–3 miles? Heavy new supply (>2% of stock underway) typically softens rents 12–24 months out; light construction supports rent growth.
Investment metrics
- 1% rule
- 1.16% ✓
- Cap rate
- 5.90%
- Cash-on-cash
- -1.39%
- DSCR
- 0.94
- GRM
- 7.2
CMA / ARV
No comps found within radius.
Projected returns pro-forma
-3.0% appreciation · 0.0% rent growth · sell at horizon
- IRR
- -23.2%
- Equity multiple
- 0.23×
- Total profit
- $-89,215
- Equity at exit
- $61,878
- IRR
- -35.7%
- Equity multiple
- -0.21×
- Total profit
- $-140,287
- Equity at exit
- $35,882
Cash invested: $116,200 (down + closing). Projections, not guarantees.
Landlord ↔ Tenant lean methodology
- Overall (STATE)
- 87 Strongly Landlord-Friendly
- State Florida
- 87 Strongly Landlord-Friendly · R+3
- County
- — inherits STATE
- City
- — inherits STATE
ZIP-level market 34119
- Rents YoY
- -2.5%
- Active inventory
- 590
- Price-to-rent
- 7.2×
Monthly cashflow live
- Estimated rent
- $4,811 high interval (Pro) →
- Mortgage (P&I)
- −$2,176
- Tax from tax record
- −$226 /mo · $2,710/yr
- Insurance
- −$173
- HOA
- −$1,361
- Vacancy / Maint / Mgmt
- −$1,010
- Net cashflow
- $-135
Break-even live
Sensitivity live
| Price | -10% $100 | -5% $-17 | +0% $-135 | +5% $-252 | +10% $-370 |
|---|---|---|---|---|---|
| Rent | -10% $-515 | -5% $-325 | +0% $-135 | +5% $55 | +10% $245 |
| Rate | -1.0pp $74 | -0.5pp $-29 | base $-135 | +0.5pp $-242 | +1.0pp $-352 |
UW: 25.0% down · 7.5% · 30yr · 1.5% tax · 5.0% vac · 8.0% maint · 8.0% mgmt
Financing live
Cash to close
- Down payment
- $103,750
- Closing costs
- $12,450
- Reserves months
- —
- Total cash needed
- —
Loan-product check · same deal, 3 products live
Conventional
25% down · 7.5% · 30yr
- Down + closing
- —
- Monthly P&I
- —
- Monthly cashflow
- —
- DSCR
- —
- Eligible?
- —
Personal DTI + credit; lowest rate.
DSCR
20% down · 8.5% · 30yr
- Down + closing
- —
- Monthly P&I
- —
- Monthly cashflow
- —
- DSCR
- —
- Eligible?
- —
No personal income docs; deal must DSCR.
Hard money
10% down · 12.0% · 12mo
- Down + closing
- —
- Monthly P&I
- —
- Monthly cashflow
- —
- DSCR
- —
- Eligible?
- —
Short-term bridge; refi at stabilization.
Rent comps 40 comps
| Address | Beds | Baths | Sqft | Rent | $/sqft | DOM | Units | Dist |
|---|---|---|---|---|---|---|---|---|
| 3435 Laurelgreens Ln S Unit 1 Naples, FL | 3.0 | 2.0 | 1758 | $6,000 | $3.41 | 25d | 1 | 0.03mi |
| 3435 Laurel Greens Ln S #201 Naples, FL | 3.0 | 2.0 | 1708 | $3,000 | $1.76 | 25d | 1 | 0.04mi |
| 3455 Laurel Greens Ln S #103 Naples, FL | 3.0 | 2.0 | 1758 | $5,500 | $3.13 | 25d | 1 | 0.09mi |
| 3465 Laurel Greens Ln S #103 Naples, FL | 2.0 | 2.0 | 1789 | $2,550 | $1.43 | 25d | 1 | 0.11mi |
| 3425 Grand Cypress Dr #102 Naples, FL | 3.0 | 2.0 | 1763 | $6,500 | $3.69 | 25d | 1 | 0.31mi |
| 6750 Huntington Lakes Cir #103 Naples, FL | 2.0 | 2.0 | 1185 | $2,300 | $1.94 | 23d | 1 | 0.32mi |
| 5886 Paradise Cir Naples, FL | 3.0 | 3.0 | 1922 | $6,800 | $3.54 | 25d | 1 | 0.32mi |
| 2925 Cypress Trace Cir #201 Naples, FL | 2.0 | 2.0 | 1094 | $4,500 | $4.11 | 25d | 1 | 0.33mi |
| 3445 Grand Cypress Dr #202 Naples, FL | 3.0 | 2.0 | 1853 | $6,500 | $3.51 | 25d | 1 | 0.34mi |
| 3545 Laurel Greens Ln N #201 Naples, FL | 2.0 | 2.0 | 1708 | $3,700 | $2.17 | 25d | 1 | 0.36mi |
| 2920 Cypress Trace Cir #204 Naples, FL | 2.0 | 2.0 | 1625 | $5,500 | $3.38 | 25d | 1 | 0.38mi |
| 2895 Cypress Trace Cir #104 Naples, FL | 2.0 | 2.0 | 1252 | $4,800 | $3.83 | 25d | 1 | 0.38mi |
| 2895 Cypress Trace Cir #202 Naples, FL | 2.0 | 2.0 | 1232 | $4,500 | $3.65 | 25d | 1 | 0.38mi |
| 2690 Cypress Trace Cir #3212 Naples, FL | 2.0 | 2.0 | 1232 | $5,300 | $4.30 | 25d | 1 | 0.40mi |
| 2880 Cypress Trace Cir #103 Naples, FL | 2.0 | 2.0 | 1372 | $5,500 | $4.01 | 25d | 1 | 0.40mi |
| 3555 Laurel Greens Ln N #202 Naples, FL | 2.0 | 2.0 | 1784 | $5,000 | $2.80 | 25d | 1 | 0.40mi |
| 6880 Huntington Lakes Cir #203 Naples, FL | 2.0 | 2.0 | 1231 | $3,750 | $3.05 | 25d | 1 | 0.41mi |
| 3515 Grand Cypress Ct Naples, FL | 2.0 | 2.0 | 1997 | $9,000 | $4.51 | 25d | 1 | 0.43mi |
| 2870 Cypress Trace Cir #1713 Naples, FL | 2.0 | 2.0 | 1414 | $2,900 | $2.05 | 25d | 1 | 0.44mi |
| 6670 Huntington Lakes Cir #103 Naples, FL | 2.0 | 2.0 | 1107 | $4,250 | $3.84 | 25d | 1 | 0.44mi |
| 6670 Huntington Lakes Cir #103 Naples, FL | 2.0 | 2.0 | 1107 | $4,000 | $3.61 | 15d | 1 | 0.44mi |
| 2700 Cypress Trace Cir #3112 Naples, FL | 2.0 | 2.0 | 1232 | $2,100 | $1.70 | 25d | 1 | 0.46mi |
| 2855 Cypress Trace Cir #202 Naples, FL | 2.0 | 2.0 | 1232 | $4,800 | $3.90 | 15d | 1 | 0.48mi |
| 2855 Cypress Trace Cir #102 Naples, FL | 2.0 | 2.0 | 1232 | $2,000 | $1.62 | 15d | 1 | 0.48mi |
| 6920 Huntington Lakes Cir #103 Naples, FL | 2.0 | 2.0 | 1107 | $2,700 | $2.44 | 25d | 1 | 0.50mi |
| 2710 Cypress Trace Cir Naples, FL | 2.0 | 2.0 | 1213 | $3,425 | $2.82 | 25d | 2 | 0.52mi |
| 2835 Cypress Trace Cir Unit 1049710P Naples, FL | 3.0 | 2.0 | 1248 | $4,110 | $3.29 | 15d | 1 | 0.54mi |
| 6605 Huntington Lakes Cir #203 Naples, FL | 2.0 | 2.0 | 1107 | $2,400 | $2.17 | 25d | 1 | 0.55mi |
| 2720 Cypress Trace Cir Naples, FL | 2.0–3.0 | 2.0 | 1283 | $5,300 | $4.13 | 25d | 3 | 0.55mi |
| 11672 Quail Village Way Unit 130-3 Naples, FL | 2.0 | 2.0 | 1934 | $4,000 | $2.07 | 25d | 1 | 0.55mi |
| 2820 Cypress Trace Cir Naples, FL | 2.0 | 2.0 | 1254 | $3,748 | $2.99 | 25d | 3 | 0.55mi |
| 2600 Marshcreek Ln #201 Naples, FL | 3.0 | 2.0 | 1765 | $2,595 | $1.47 | 15d | 1 | 0.56mi |
| 5892 Three Iron Dr #1504 Naples, FL | 2.0 | 2.0 | 1793 | $7,000 | $3.90 | 25d | 1 | 0.56mi |
| 5870 3 Iron Dr Unit 4-401 Naples, FL | 3.0 | 2.0 | 1633 | $8,000 | $4.90 | 25d | 1 | 0.57mi |
| 6522 Waverly Green Way Naples, FL | 3.0 | 2.0 | 2039 | $4,500 | $2.21 | 25d | 1 | 0.57mi |
| 11762 Quail Village Way Naples, FL | 3.0 | 2.5 | 1800 | $3,800 | $2.11 | 25d | 1 | 0.58mi |
| 5705 Heron Ln #806 Naples, FL | 2.0 | 2.0 | 1540 | $7,000 | $4.55 | 25d | 1 | 0.58mi |
| 5885 Three Iron Dr #1102 Naples, FL | 3.0 | 2.0 | 1633 | $7,000 | $4.29 | 25d | 1 | 0.60mi |
| 5765 Grande Reserve Way Unit 7-702 Naples, FL | 2.0 | 2.0 | 1800 | $7,500 | $4.17 | 25d | 1 | 0.60mi |
| 6478 Waverly Green Way Naples, FL | 3.0 | 2.5 | 1711 | $10,000 | $5.84 | 25d | 1 | 0.64mi |
HOA detail condo
- Monthly dues
- $1,361 · $16,332/yr
- Assessments
- None detected in remarks — confirm with the listing agent.
Listing history 40 events
-
2026-06-21days on market $415,000 Active 78 DOM
-
2026-06-18days on market $415,000 Active 75 DOM
-
2026-06-17days on market $415,000 Active 74 DOM
-
2026-06-16days on market $415,000 Active 73 DOM
-
2026-06-15days on market $415,000 Active 72 DOM
-
2026-06-14days on market $415,000 Active 70 DOM
-
2026-06-10days on market $415,000 Active 67 DOM
-
2026-06-09days on market $415,000 Active 66 DOM
-
2026-06-08days on market $415,000 Active 65 DOM
-
2026-06-07days on market $415,000 Active 64 DOM
-
2026-06-03days on market $415,000 Active 60 DOM
-
2026-06-02days on market $415,000 Active 59 DOM
-
2026-06-01days on market $415,000 Active 58 DOM
-
2026-05-31days on market $415,000 Active 57 DOM
-
2026-05-30days on market $415,000 Active 56 DOM
-
2026-04-04$415,000 Active
-
2026-04-01historical
-
2026-03-10price $420,000
-
2026-02-12price $439,900
-
2026-01-21price $462,000
-
2025-12-24$485,000 Active
-
2025-06-02historical
-
2024-10-25price $459,000
-
2024-09-17$485,000 Active
-
2021-06-28soldstatus $260,000
-
2019-12-31historical
-
2019-09-09price $255,000
-
2019-05-06price $258,000
-
2019-04-07$269,000 Active
-
2019-04-03historical
-
2018-10-30price $269,000
-
2018-10-29$269,000 Active
-
2018-10-28price $279,000
-
2018-09-01price $274,000
-
2016-11-22soldstatus $222,500
-
2016-11-21price $222,500
-
2016-11-01price $248,000
-
2016-04-01historical
-
2016-02-04price $267,000
-
2015-09-03$280,000 Active
ⓘ Source: listings_history table (triggers on properties + properties_extension) + one-shot
backfill from property_details.listing_events for pre-trigger history.
Tax reassessment forecast FL · Resets to sale price
- Current annual tax
- $2,710 · $226/mo
- Projected year-2 tax
- $3,444 · $287/mo
- Expected delta
- +$735/yr (+$61/mo · 27.1%)
ⓘ Screening estimate from a state-policy table — verify with the county assessor before closing.
Climate risk First Street
- Flood 1/10 Low FEMA zone X (shaded) · 0% chance over 30 yrs
- Wildfire 3/10 Moderate
- Heat 10/10 Extreme 7 d/yr ≥108°F today · 30 d/yr by 30 yrs out
- Wind 10/10 Extreme 99% chance of damaging wind over 30 yrs
- Air quality 2/10 Low 2 unhealthy d/yr today · 2 by 30 yrs out
Nearby sold comps map
Loading sold comps map…
Walkable amenities ~0.75 mi
Loading nearby amenities…
Taxation est. · year 1
- Rental income
- $57,738
- − Mortgage interest
- −$23,246
- − Property taxes
- −$2,710
- − Insurance
- −$2,075
- − Repairs & maintenance
- −$4,619
- − Management
- −$4,619
- − HOA
- −$16,332
- − Depreciation
- −$12,073
- Taxable loss
- −$7,936
- Est. tax savings @ 24.0%
- +$1,905
- After-tax cash flow
- $285/yr
For passive investors: Depreciation is non-cash, so a rental often shows a tax loss while cash-flowing — sheltering income. Rental losses are passive: they offset passive income freely, and up to $25,000/yr can offset ordinary (W-2) income if you actively participate and your MAGI is under $100k (phasing out to $0 by $150k); unused losses carry forward. On sale, claimed depreciation is recaptured at up to 25%, and gains may owe capital-gains tax (a 1031 exchange can defer both). Figures are a year-1 estimate at your 24.0% rate — not tax advice; consult a CPA.
Schools (NCES district)
- District
- Collier
- NCES district ID
- 1200330
- Math proficiency
- 60% ▼ -4.00%
- Reading proficiency
- 56% ▼ -2.00%
- Median HH income
- $58,275
- Composite
- 50.23/100
- National rank
- #1892
- State rank
- #16 of 73 in FL
Livability — Bonita Springs
- Score
- 70/100
- State rank
- #428
- US rank
- #7576
Category grades
Schools grade is shown separately in the Schools card above.
Census & demographics
- County
- Collier County · 396,295 people
- City population
- 64,727
- Metro
- Naples-Marco Island, FL
- Population (ZIP)
- 36,807
- Household income
- $113,391
- Rent vs Own
- Severe rent burden
- 741.0
Population outlook (Collier County) Hauer SSP2
- Today (2025)
- 420,858 people
- By 2030
- 450,054 · +6.9%
- By 2040
- 502,232 · +19.3%
- By 2050
- 544,932 · +29.5%
- By 2075
- 627,203 · +49.0%
- By 2100
- 659,015 · +56.6%
Race, ethnicity, and origin ACS 2023
- Neighborhood character
- Predominantly White (74%)
- Race & ethnicity
- White 74% Hispanic / Latino 20% Two or more races 14% Black 1%
- Hispanic origin (detail)
- Mexican 6% Puerto Rican 2% Cuban 4% Dominican 2%
- Common ancestry
- Romanian 4% Lithuanian 2% Italian 2%
- Foreign-born
- 17% · Canada, Jamaica, Dominican Republic
- Languages at home
- 78% English-only · Spanish 15% Other Indo-European 3% Russian/Polish/Slavic 1%
Political lean MEDSL · Collier
- 2024 margin
- Solid R (+33.1) · D 33.1% · R 66.2%
- 2008→2024 swing
- -10.6pp toward R · 2008: -22.5pp · 2024: -33.1pp
- All cycles
- 2024: R+33.1 2020: R+24.7 2016: R+26.0 2012: R+30.1 2008: R+22.5
Not yet ingested
- Civics
- —
Market trends
- HPI YoY
- ▼ -243.12%
- Current HPI
- 269.3208
- Rent YoY
- ▼ -2.51%
- Metro
- Naples-Marco Island, FL
- State GDP YoY
- ▲ 3.28%
- F500 in state
- 36
Industry mix (Fortune 500 HQ in FL)
| Industry | F500 HQs | Revenue |
|---|---|---|
| Industrial Technology | 2 | $29B |
|
||
| Insurance | 2 | $17B |
|
||
| Retail | 1 | $60B |
|
||
| Technology Distribution | 1 | $58B |
|
||
| Homebuilding | 1 | $35B |
|
||
| Technology Manufacturing | 1 | $35B |
|
||
Price history
+48.2% since first listed25 events — show timeline
- 2026-04-04 Listed $415,000 BEARMLS
- 2026-04-01 Listing Removed — NAPLESMLS
- 2026-03-10 Price Changed $420,000 NAPLESMLS
- 2026-02-12 Price Changed $439,900 NAPLESMLS
- 2026-01-21 Price Changed $462,000 NAPLESMLS
- 2025-12-24 Listed $485,000 NAPLESMLS
- 2025-06-02 Listing Removed — NAPLESMLS
- 2024-10-25 Price Changed $459,000 NAPLESMLS
- 2024-09-17 Listed $485,000 NAPLESMLS
- 2021-06-28 Sold (Public Records) $260,000 Public Records
- 2019-12-31 Listing Removed — NAPLESMLS
- 2019-09-09 Price Changed $255,000 NAPLESMLS
- 2019-05-06 Price Changed $258,000 NAPLESMLS
- 2019-04-07 Listed $269,000 NAPLESMLS
- 2019-04-03 Listing Removed — FORTMLS
- 2018-10-30 Price Changed $269,000 FSBO.com
- 2018-10-29 Listed $269,000 FORTMLS
- 2018-10-28 Price Changed $279,000 FSBO.com
- 2018-09-01 Price Changed $274,000 FSBO.com
- 2016-11-22 Sold (Public Records) $222,500 Public Records
- 2016-11-21 Price Changed $222,500 BEARMLS
- 2016-11-01 Price Changed $248,000 BEARMLS
- 2016-04-01 Listing Removed — NAPLESMLS
- 2016-02-04 Price Changed $267,000 NAPLESMLS
- 2015-09-03 Listed $280,000 NAPLESMLS
Property tax history
+4.3%/yrLatest (2025): $2,710 · +2.5% YoY. Source: county tax records.
Cash-flow waterfall
monthlySold comps — $/sqft
last 12 mo · ≤1 miLoading sold comps…