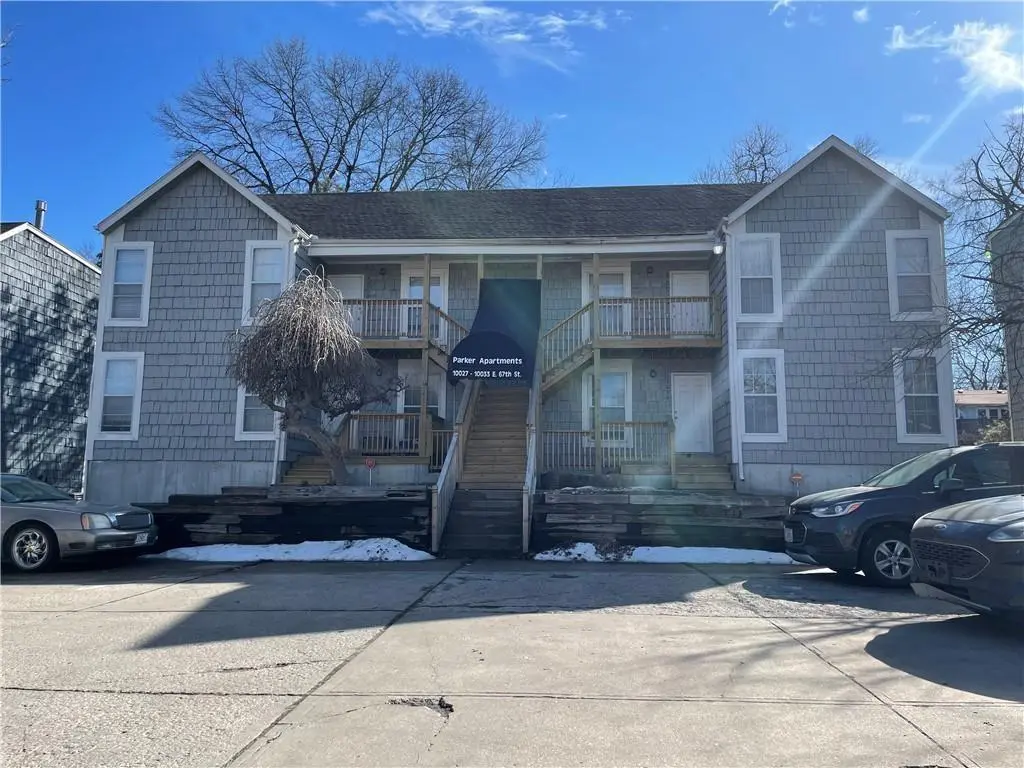
 Fourplex
10027 E 67th St · Raytown, MO
Flood risk 7/10 · Major
- FEMA flood zone
- X (unshaded)
- Chance of flooding over 30 yrs
- 0.99%
- Est. flood insurance / yr
- $473 – $860
Fire risk 1/10 · Minimal
- Est. fire insurance / yr
- $1,054 – $1,958
Heat risk 4/10 · Minor
- Hot days now (above 108°F)
- 7 days/yr
- Hot days in 30 yrs
- 17 days/yr
Wind risk 2/10 · Minimal
- Chance of severe wind over 30 yrs
- —
Air-quality risk 3/10 · Minor
- Unhealthy air days now
- 3 days/yr
- Unhealthy air days in 30 yrs
- 5 days/yr
Risk factors via First Street. Map © Google.
Why this score? — see what drove the C- grade
The composite is a weighted blend of 9 inputs, each scored 0–100. Each bar is that input's sub-score; the figure is the points it added to the 100-point composite (weight × sub-score).
- Cash flow +21.0/30.0
- ARV discount +8.0/15.0
- DSCR +6.7/10.0
- 1% rule +5.3/10.0
- Livability +3.2/5.0
- Rent growth +2.8/5.0
- Condition / age +2.5/5.0
- Schools +1.8/10.0
- Appreciation +0.0/10.0
$455,000
🖨 Deal sheet (PDF) 📄 Offer letter ✓ Due diligence
Multi-family units
County records classify this as Multi-Family (2-4 Unit). Listing-text estimate: 4 units. confirmed
Listing remarks MLS
Calling all Investors! 4 unit building in thriving rental community off of 67th Street in Raytown area. Tenants pay utilities and property is separately metered. Do Not approach tenants, call listing agent for showing information!
Key facts
- 3,968 sq ft lot
- Built 1983
- Listed 93 days
Neighborhood map
What this means for you Summary
Snapshot
- This is a 4 × 2-bed/2.0-bath units multifamily listed at $455k.
Deal economics
- At list price, monthly cash flow is $583 ($7k/yr) — positive. Per door: $146/mo.
- The deal already cash-flows at list — no discount required.
- Meets the 1% rule at list price ($5k rent vs $455k).
- Recommended offer: $414k (9.0% below list) — sets the bar for market timing.
- Cap rate 8.0% vs local median 5.0% in Raytown — top-decile yield for the area; either an underpriced asset or a hidden risk that comps aren't pricing in. Stress-test before assuming the spread holds.
Location & tenants
- Location reads 65/100 on livability (#281 in MO) — a middle-class / working-renter tenant base. Strengths: cost of living A+, housing A+, health & safety B+; Watch: crime F, amenities F, commute F.
- Raytown C-2 (suburban): math 12% / reading 28% proficiency, ranked #302 of 324 in MO (top 93%) — low school quality limits family demand, transient renter base, plan for 1-2y turnover.
- Zoned schools: Robinson Elem. (math 27% / reading 42%, grade F, #676 of 1,115 statewide, top 66%, 345 students, 60% FRL); Raytown Central Middle (math 16% / reading 32%, grade F, #326 of 391 statewide, top 84%, 564 students, 64% FRL); Raytown South Sr. High (math 8% / reading 32%, grade F, #475 of 521 statewide, top 92%, 1,185 students, 68% FRL).
- Market conditions: Rents rising (+1.3%/yr); 208 active listings in the ZIP; 4,002 units permitted in Jackson County in 2024 (2,271 in 5+ unit buildings).
- At $4,708/mo this rent would consume 83% of the median local household income ($68k/yr) (locally 1173% of renters already pay >50% of income on rent) — very limited rent-growth headroom before tenants either downsize or default.
Forward outlook
- Local home prices are declining (-3.0%/yr); year-one equity from $3k of loan paydown is wiped out by about $14k of value loss. Plan a longer hold.
- Jackson County population projected at +4% by 2050 — modest demand growth; plan on rents tracking national, not racing it.
Negotiation context
- It's been on market 93 days — a 9% lower offer ($414k) is reasonable based on typical stale-listing flexibility.
- 7 sale attempts since 20y ago with the ask held roughly flat each time — persistent listings suggest the price (not the market) is what's stuck; bring a comps-based counter.
Risks & watch-outs
- Watch-outs: flood insurance adds $56/mo.
- Climate carrying-cost: major flood risk — expect insurance premiums to compound above CPI over the hold.
Questions for the listing agent
- It's been on market 93 days. Have you received any prior offers? Is the seller open to a 9% concession, seller financing, or rate buy-down credit?
- Can we see the unit-by-unit rent roll, current vacancy, and any below-market leases? What's the average tenancy length?
- What capital expenditures (roof, boiler, parking lot, exteriors) have been made in the last 5 years, and what's planned in the next 2?
- What's the actual annual flood-insurance premium (NFIP or private), and is the property in a SFHA with mandatory coverage?
- Why hasn't it sold? Are there any deal-killer items the seller is aware of (foundation, flood, title, zoning, code violations)?
- Is there a deadline driving the sale (1031 exchange, divorce, estate, relocation)? That informs how much negotiation room exists.
- Schools are D-rated, which usually means shorter tenancies and higher turnover. Who's the typical renter profile here, and what's been the actual vacancy rate?
- Crime grade is F in this area — have there been break-ins, vandalism, or insurance claims at this property in the last 3 years? What carrier currently insures it and at what premium?
- What's the average days-on-market for RENTAL listings here right now (not sales)? A rising rental-DOM trend means longer vacancies and softer asking-rent achievability than the comps imply.
- What's the recent tenant-quality profile in this submarket — average credit score on applications, eviction rate, late-payment / NSF rate, and stable-employment percentage? A property-management company in the area should have these aggregated.
- How much new apartment / multifamily construction is in the pipeline within 1–3 miles? Heavy new supply (>2% of stock underway) typically softens rents 12–24 months out; light construction supports rent growth.
Investment metrics
- 1% rule
- 1.03% ✓
- Cap rate
- 7.98%
- Cash-on-cash
- 6.02%
- DSCR
- 1.27
- GRM
- 8.1
CMA / ARV
- ARV (median comp)
- $459,834
- List price
- $455,000
- Delta
- -1.05%
- Verdict
- FAIR
- Comps
- 5 within 1.0 mi
Projected returns pro-forma
-3.0% appreciation · 1.34% rent growth · sell at horizon
- IRR
- -9.7%
- Equity multiple
- 0.65×
- Total profit
- $-44,237
- Equity at exit
- $67,842
- IRR
- -2.7%
- Equity multiple
- 0.83×
- Total profit
- $-21,103
- Equity at exit
- $39,340
Cash invested: $127,400 (down + closing). Projections, not guarantees.
Landlord ↔ Tenant lean methodology
- Overall (STATE)
- 81 Strongly Landlord-Friendly
- State Missouri
- 81 Strongly Landlord-Friendly · R+10
- County
- — inherits STATE
- City
- — inherits STATE
ZIP-level market 64133
- Rents YoY
- 1.3%
- Active inventory
- 208
- Price-to-rent
- 32.2×
Monthly cashflow live
- Estimated rent
- $4,708 high interval (Pro) →
- Mortgage (P&I)
- −$2,386
- Tax from tax record
- −$505 /mo · $6,056/yr
- Insurance
- −$190
- Flood insurance flood zone
- −$56 /mo · $666/yr
- HOA
- −$0
- Vacancy / Maint / Mgmt
- −$989
- Net cashflow
- $583
Break-even live
Sensitivity live
| Price | -10% $841 | -5% $712 | +0% $583 | +5% $455 | +10% $326 |
|---|---|---|---|---|---|
| Rent | -10% $212 | -5% $398 | +0% $583 | +5% $769 | +10% $955 |
| Rate | -1.0pp $813 | -0.5pp $699 | base $583 | +0.5pp $466 | +1.0pp $346 |
4-unit breakdown (identical units grouped — click to expand)
| Units | Beds | Baths | Est. rent |
|---|---|---|---|
| 4× units | 2 | 2 | $4,708 |
| #1 | 2 | 2 | $1,177 |
| #2 | 2 | 2 | $1,177 |
| #3 | 2 | 2 | $1,177 |
| #4 | 2 | 2 | $1,177 |
| Total (4 units) | $4,708 | ||
UW: 25.0% down · 7.5% · 30yr · 1.5% tax · 5.0% vac · 8.0% maint · 8.0% mgmt
Financing live
Cash to close
- Down payment
- $113,750
- Closing costs
- $13,650
- Reserves months
- —
- Total cash needed
- —
Loan-product check · same deal, 3 products live
Conventional
25% down · 7.5% · 30yr
- Down + closing
- —
- Monthly P&I
- —
- Monthly cashflow
- —
- DSCR
- —
- Eligible?
- —
Personal DTI + credit; lowest rate.
DSCR
20% down · 8.5% · 30yr
- Down + closing
- —
- Monthly P&I
- —
- Monthly cashflow
- —
- DSCR
- —
- Eligible?
- —
No personal income docs; deal must DSCR.
Hard money
10% down · 12.0% · 12mo
- Down + closing
- —
- Monthly P&I
- —
- Monthly cashflow
- —
- DSCR
- —
- Eligible?
- —
Short-term bridge; refi at stabilization.
Listing history 35 events
-
2026-06-21days on market $455,000 Active 93 DOM
-
2026-06-18days on market $455,000 Active 90 DOM
-
2026-06-17days on market $455,000 Active 89 DOM
-
2026-06-16days on market $455,000 Active 88 DOM
-
2026-06-15days on market $455,000 Active 87 DOM
-
2026-06-13days on market $455,000 Active 85 DOM
-
2026-06-13days on market $455,000 Active 84 DOM
-
2026-06-09days on market $455,000 Active 81 DOM
-
2026-06-08days on market $455,000 Active 80 DOM
-
2026-06-07days on market $455,000 Active 79 DOM
-
2026-06-03days on market $455,000 Active 75 DOM
-
2026-06-02days on market $455,000 Active 74 DOM
-
2026-06-01days on market $455,000 Active 73 DOM
-
2026-05-31days on market $455,000 Active 72 DOM
-
2026-03-20$455,000 Active 230-char remark
Show marketing remark (230 chars)
Calling all Investors! 4 unit building in thriving rental community off of 67th Street in Raytown area. Tenants pay utilities and property is separately metered. Do Not approach tenants, call listing agent for showing information!
-
2025-10-23historical
-
2025-09-16$455,000 Active
-
2024-04-12historical $895
-
2024-02-14price $895
-
2024-02-07$995
-
2024-02-07historical $995
-
2024-02-04$995
-
2020-11-16soldstatus
-
2018-04-13historical
-
2018-03-22price $275,000
-
2018-03-03price $299,950
-
2017-10-04$349,950 Active
-
2015-08-14soldstatus
-
2012-02-02soldstatus
-
2012-01-30soldstatus
-
2010-12-06$154,000
-
2006-12-28soldstatus
-
2006-12-28soldstatus
-
2006-09-22$475,000
-
1992-12-30soldstatus
ⓘ Source: listings_history table (triggers on properties + properties_extension) + one-shot
backfill from property_details.listing_events for pre-trigger history.
Tax reassessment forecast MO · Resets to sale price
- Current annual tax
- $6,056 · $505/mo
- Projected year-2 tax
- $6,056 · $505/mo
- Expected delta
- $0/yr ($0/mo · 0.0%)
ⓘ Screening estimate from a state-policy table — verify with the county assessor before closing.
Climate risk First Street
- Flood 7/10 Severe FEMA zone X (unshaded) · 99% chance over 30 yrs
- Wildfire 1/10 Low
- Heat 4/10 Moderate 7 d/yr ≥108°F today · 17 d/yr by 30 yrs out
- Wind 2/10 Low
- Air quality 3/10 Moderate 3 unhealthy d/yr today · 5 by 30 yrs out
Nearby sold comps map
Loading sold comps map…
Walkable amenities ~0.75 mi
Loading nearby amenities…
Taxation est. · year 1
- Rental income
- $56,496
- − Mortgage interest
- −$25,487
- − Property taxes
- −$6,056
- − Insurance
- −$2,942
- − Repairs & maintenance
- −$4,520
- − Management
- −$4,520
- − Depreciation
- −$13,236
- Taxable loss
- −$264
- Est. tax savings @ 24.0%
- +$63
- After-tax cash flow
- $7,065/yr
For passive investors: Depreciation is non-cash, so a rental often shows a tax loss while cash-flowing — sheltering income. Rental losses are passive: they offset passive income freely, and up to $25,000/yr can offset ordinary (W-2) income if you actively participate and your MAGI is under $100k (phasing out to $0 by $150k); unused losses carry forward. On sale, claimed depreciation is recaptured at up to 25%, and gains may owe capital-gains tax (a 1031 exchange can defer both). Figures are a year-1 estimate at your 24.0% rate — not tax advice; consult a CPA.
Schools (NCES district)
- District
- Raytown C-2
- NCES district ID
- 2926070
- Math proficiency
- 12% ▼ -11.00%
- Reading proficiency
- 28% ▼ -9.00%
- Median HH income
- $47,215
- Composite
- 17.59/100
- National rank
- #9039
- State rank
- #302 of 324 in MO
Livability — Raytown
- Score
- 65/100
- State rank
- #281
- US rank
- #13079
Category grades
Schools grade is shown separately in the Schools card above.
Census & demographics
- Census place
- Raytown, MO
- County
- Jackson County · 687,798 people
- City population
- 60,054
- Metro
- Kansas City, MO-KS
- Population (ZIP)
- 36,249
- Household income
- $67,750
- Rent vs Own
- Severe rent burden
- 1173.0
Population outlook (Jackson County) Hauer SSP2
- Today (2025)
- 719,589 people
- By 2030
- 731,456 · +1.6%
- By 2040
- 746,689 · +3.8%
- By 2050
- 749,289 · +4.1%
- By 2075
- 736,227 · +2.3%
- By 2100
- 668,210 · -7.1%
Race, ethnicity, and origin ACS 2023
- Neighborhood character
- Diverse neighborhood (Simpson 0.64)
- Race & ethnicity
- White 46% Black 37% Hispanic / Latino 12% Two or more races 9%
- Hispanic origin (detail)
- Mexican 10%
- Common ancestry
- Italian 7% Slovak 1% Lithuanian 1%
- Foreign-born
- 5% · Canada
- Languages at home
- 90% English-only · Spanish 7% French/Haitian/Cajun 1%
Political lean MEDSL · Jackson
- 2024 margin
- D (+19.3) · D 58.9% · R 39.5% · Other 1.6%
- 2008→2024 swing
- -6.1pp toward R · 2008: 25.4pp · 2024: 19.3pp
- All cycles
- 2024: D+19.3 2020: D+22.0 2016: D+16.6 2012: D+19.0 2008: D+25.4
Not yet ingested
- Civics
- —
Market trends
- HPI YoY
- ▼ -155.40%
- Current HPI
- 263.6915
- Rent YoY
- ▲ 1.34%
- Metro
- Kansas City, MO-KS
- State GDP YoY
- ▲ 1.84%
- F500 in state
- 20
Industry mix (Fortune 500 HQ in MO)
| Industry | F500 HQs | Revenue |
|---|---|---|
| Healthcare | 1 | $163B |
|
||
| Insurance | 1 | $21B |
|
||
| Industrial Technology | 1 | $17B |
|
||
| Retail | 1 | $16B |
|
||
| Industrial Distribution | 1 | $10B |
|
||
| Utilities | 1 | $9B |
|
||
Price history
-4.2% since first listed21 events — show timeline
- 2026-03-20 Listed $455,000 Heartland MLS as Distributed by MLS Grid
- 2025-10-23 Listing Removed — Heartland MLS as Distributed by MLS Grid
- 2025-09-16 Listed $455,000 Heartland MLS as Distributed by MLS Grid
- 2024-04-12 Rental Removed $895 RENTLY
- 2024-02-14 Price Changed $895 RENTLY
- 2024-02-07 Listed for Rent $995 RENTLY
- 2024-02-07 Rental Removed $995 APPFOLIO
- 2024-02-04 Listed for Rent $995 APPFOLIO
- 2020-11-16 Sold (Public Records) — Public Records
- 2018-04-13 Listing Removed — Heartland MLS as Distributed by MLS Grid
- 2018-03-22 Price Changed $275,000 Heartland MLS as Distributed by MLS Grid
- 2018-03-03 Price Changed $299,950 Heartland MLS as Distributed by MLS Grid
- 2017-10-04 Listed $349,950 Heartland MLS as Distributed by MLS Grid
- 2015-08-14 Sold (Public Records) — Public Records
- 2012-02-02 Sold (Public Records) — Public Records
- 2012-01-30 Sold (MLS) — Heartland MLS as Distributed by MLS Grid
- 2010-12-06 Listed $154,000 Heartland MLS as Distributed by MLS Grid
- 2006-12-28 Sold (Public Records) — Public Records
- 2006-12-28 Sold (MLS) — Heartland MLS as Distributed by MLS Grid
- 2006-09-22 Listed $475,000 Heartland MLS as Distributed by MLS Grid
- 1992-12-30 Sold (Public Records) — Public Records
Property tax history
+9.0%/yrLatest (2025): $6,056 · +6.2% YoY. Source: county tax records.
Cash-flow waterfall
monthlySold comps — $/sqft
last 12 mo · ≤1 miLoading sold comps…