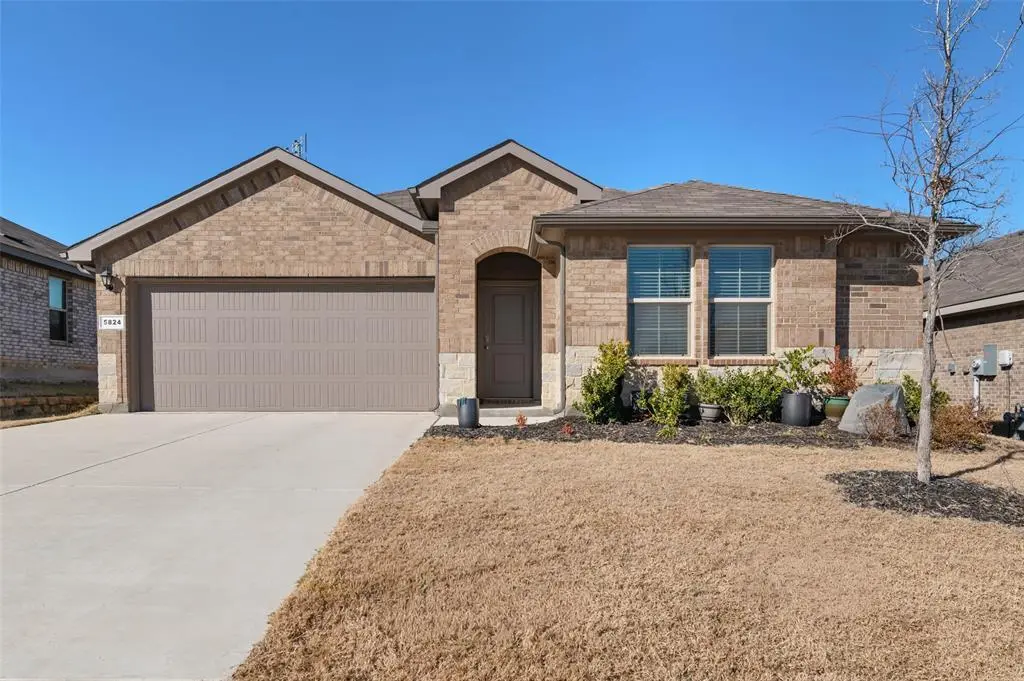
5824 Harvey Gap Ln · Denton, TX
Flood risk 1/10 · Minimal
- FEMA flood zone
- X (unshaded)
- Chance of flooding over 30 yrs
- 0.0%
- Est. flood insurance / yr
- $507 – $1,088
Fire risk 5/10 · Moderate
- Est. fire insurance / yr
- $1,222 – $2,270
Heat risk 7/10 · Major
- Hot days now (above 109°F)
- 7 days/yr
- Hot days in 30 yrs
- 22 days/yr
Wind risk 6/10 · Moderate
- Chance of severe wind over 30 yrs
- 27.0%
Air-quality risk 3/10 · Minor
- Unhealthy air days now
- 3 days/yr
- Unhealthy air days in 30 yrs
- 4 days/yr
Risk factors via First Street. Map © Google.
Why this score? — see what drove the D grade
The composite is a weighted blend of 9 inputs, each scored 0–100. Each bar is that input's sub-score; the figure is the points it added to the 100-point composite (weight × sub-score).
- ARV discount +10.5/15.0
- Cash flow +10.4/30.0
- Livability +4.4/5.0
- 1% rule +3.9/10.0
- Condition / age +3.8/5.0
- Schools +3.5/10.0
- DSCR +3.0/10.0
- Rent growth +2.9/5.0
- Appreciation +0.0/10.0
$335,000
🖨 Deal sheet (PDF) 📄 Offer letter ✓ Due diligence
Listing remarks
This home is priced to sell and won't last long! This beautiful East facing, single-story brick home is located on a quiet street in Argyle with a sprawling ranch backing up to the back fence. This home features 4 bedrooms and 2 bathrooms and has a lovely open floor plan. The kitchen island is large with room for seating. This house has been taken care of immaculately and will make a perfect forever home for some lucky buyer.
Key facts
- 6,447 sq ft lot
- 2 garage spots
- Built 2023
Property features AI
Finance
- Other: Property is in the Cambridge Brook Ph 2 subdivision
- Financial info: Listing accepts Cash, Conventional, FHA, Texas Vet, and VA loans
- HOA & community: Mandatory HOA; HOA annually covers grounds maintenance; HOA management: Cambridge Brook Residential Community
Exterior
- Parking: 2-car attached garage; 2 covered parking spaces; Driveway
- Security: Security system
- Utilities: City water; City sewer; Electricity connected; Individual gas meter; Individual water meter; Natural gas available; Phone available
- Home design: Single family residence; One-story; Not attached to another property; Residential property
- Construction: Built in 2023; Brick construction; Composition roof; Slab foundation
- Exterior features: Covered porch(es); Gutters; Private yard; Landscaped; Subdivision lot; Fenced backyard with privacy wood fence
Interior
- Kitchen: Dishwasher; Gas range; Disposal; Built-in cabinets; Corian/Corian-type countertops; Kitchen island; Pantry; Eat-in kitchen; Water line to refrigerator
- Bedrooms: 4 bedrooms (all on main level); Primary bedroom with ensuite bathroom and walk-in closet
- Flooring: Carpet; Tile
- Bathrooms: 2 full bathrooms (both on main level); Primary bathroom includes built-in cabinets, Corian-type countertop and linen closet; Secondary bathroom includes built-in cabinets, Corian-type countertop and linen closet
- Heating & cooling: Central heating (natural gas); Central air conditioning
- Interior features: Built-in features and cabinets; Cable TV available; Chandelier and decorative lighting; Eat-in kitchen with kitchen island; Open floor plan; Pantry; Walk-in closet(s); High speed internet available; Kitchen island
- Laundry & utility: Dedicated laundry room on main level
Neighborhood map
What this means for you Summary
Snapshot
- This is a 4-bed/2.0-bath single-family listed at $335k. Condition is rated good.
Deal economics
- At list price, monthly cash flow is $-180 ($-2k/yr) — negative.
- To cash-flow at today's rent, offer at most $303k (9.5% below list).
- To meet the 1% rule (rent ≥ 1% of price), the offer needs to be $297k (11.4% below list).
- Recommended offer: $297k (11.4% below list) — sets the bar for 1% rule.
- Cap rate 5.6% vs local median 3.4% in Denton — top-decile yield for the area; either an underpriced asset or a hidden risk that comps aren't pricing in. Stress-test before assuming the spread holds.
Location & tenants
- Location reads 88/100 on livability (#2 in TX, #210 nationally) — a professional / high-income tenant draw. Strengths: amenities A+, commute A+, housing A+.
- Denton ISD (urban): math 36% / reading 43% proficiency, ranked #383 of 826 in TX (top 46%) — families likely to look elsewhere, expect single-tenant / working-renter base with shorter leases.
- Zoned schools: Ep Rayzor El (math 72% / reading 72%, grade A-, #110 of 4,322 statewide, top 3%, 322 students, 7% FRL) — zoned schools average 7% FRL vs 38% district-wide (31 pts lower); this property's tenant base skews higher-income than the district average.
- Zoned-school proficiency averages 72% at this address vs 40% district-wide (+32 pts) — the actual schools serving this property are materially stronger than the Denton ISD average implies; a family-tenant draw the district grade alone would hide.
- Market conditions: Rents rising (+1.6%/yr); 1134 active listings in the ZIP; 23 comparable units currently listed for rent nearby; rentals at typical pace (median 21d on market — plan ~3-4 weeks tenant-placement turnaround); high-income renter base; 10,531 units permitted in Denton County in 2024 (2,713 in 5+ unit buildings).
Forward outlook
- Local home prices are declining (-3.0%/yr); year-one equity from $2k of loan paydown is wiped out by about $10k of value loss. Plan a longer hold.
- Denton County population projected at +66% by 2050 — long-run rental-demand tailwind backs the buy-and-hold thesis.
Negotiation context
- Only 11 days on market — expect competitive offers; lowballing is unlikely to land.
- 2 sale attempts with the ask held roughly flat each time — persistent listings suggest the price (not the market) is what's stuck; bring a comps-based counter.
Risks & watch-outs
- Climate carrying-cost: major wind risk, 27% chance of damaging wind over 30y; moderate wildfire risk; extreme-heat days projected 7→22/yr by 2055 (HVAC capex compounding) — expect insurance premiums to compound above CPI over the hold.
Questions for the listing agent
- What do current leases actually rent for vs. the listed asking? Can we see a recent rent roll and the last 12 months of T-12 income?
- What does the HOA fee cover, when was the last increase, and are there any pending special assessments or reserve-fund shortfalls?
- Is there a deadline driving the sale (1031 exchange, divorce, estate, relocation)? That informs how much negotiation room exists.
- Schools are B-rated — typically a magnet for longer-tenancy family renters. What's the average tenant stay here, and is there a school-zone premium baked into asking?
- The area grade is low — what's the realistic commute time and amenity access for the typical tenant pool here? Any planned neighborhood developments (good or bad) we should know about?
- What's the average days-on-market for RENTAL listings here right now (not sales)? A rising rental-DOM trend means longer vacancies and softer asking-rent achievability than the comps imply.
- What's the recent tenant-quality profile in this submarket — average credit score on applications, eviction rate, late-payment / NSF rate, and stable-employment percentage? A property-management company in the area should have these aggregated.
- How much new for-sale + rental construction is in the pipeline within 1–3 miles? Heavy new supply typically softens prices + rents 12–24 months out; constrained supply supports both.
Investment metrics
- 1% rule
- 0.89% ✗
- Cap rate
- 5.65%
- Cash-on-cash
- -2.30%
- DSCR
- 0.90
- GRM
- 9.4
CMA / ARV
- ARV (median comp)
- $359,202
- List price
- $335,000
- Delta
- -2.56%
- Verdict
- FAIR
- Comps
- 20 within 1.0 mi
Show comp detail 8 sales within ~0.75 mi
| Address | Dist | Beds/Ba | Sqft | Sold | Price | $/sf | Match |
|---|---|---|---|---|---|---|---|
| 5812 Harvey Gap Ln | 0.03mi | 4/2.0 | 1,741 (+0%) | 16mo | $359,000 | $206 | 84 |
| 5928 Harvey Gap Ln | 0.08mi | 4/2.0 | 1,708 (-2%) | 12mo | $385,000 | $225 | 83 |
| 3816 Canyon Verde Ln | 0.19mi | 4/2.0 | 1,870 (+8%) | 0mo | $350,000 | $187 | 78 |
| 5708 Rock Lake Dr | 0.13mi | 4/2.0 | 1,836 (+6%) | 13mo | $379,999 | $207 | 73 |
| 5805 Morrow Point Dr | 0.30mi | 4/2.0 | 1,737 (+0%) | 20mo | $375,000 | $216 | 70 |
| 3613 Ridgeway Ln | 0.31mi | 4/2.0 | 1,870 (+8%) | 6mo | $337,000 | $180 | 67 |
| 5808 Silverjack Trl | 0.32mi | 4/2.0 | 1,870 (+8%) | 23mo | $400,000 | $214 | 53 |
| 4005 Tuscany Ct | 0.59mi | 3/2.0 (-1) | 1,530 (-12%) | 2mo | $299,999 | $196 | 46 |
Match score weights: distance 35% · size 25% · config 20% · recency 20%. Top-matched comps best support the ARV.
Projected returns pro-forma
-3.0% appreciation · 1.61% rent growth · sell at horizon
- IRR
- -21.8%
- Equity multiple
- 0.26×
- Total profit
- $-69,669
- Equity at exit
- $49,950
- IRR
- -19.5%
- Equity multiple
- 0.03×
- Total profit
- $-91,060
- Equity at exit
- $28,965
Cash invested: $93,800 (down + closing). Projections, not guarantees.
Landlord ↔ Tenant lean methodology
- Overall (STATE)
- 87 Strongly Landlord-Friendly
- State Texas
- 87 Strongly Landlord-Friendly · R+5
- County
- — inherits STATE
- City
- — inherits STATE
ZIP-level market 76226
- Home prices YoY
- -24.4%
- Rents YoY
- 1.6%
- Active inventory
- 1134
- Price-to-rent
- 9.4×
Monthly cashflow live
- Estimated rent
- $2,968 high interval (Pro) →
- Mortgage (P&I)
- −$1,757
- Tax from tax record
- −$582 /mo · $6,985/yr
- Insurance
- −$140
- HOA
- −$46
- Lot rent
- −$0
- Vacancy / Maint / Mgmt
- −$623
- Net cashflow
- $-180
Break-even live
Sensitivity live
| Price | -10% $10 | -5% $-85 | +0% $-180 | +5% $-275 | +10% $-370 |
|---|---|---|---|---|---|
| Rent | -10% $-414 | -5% $-297 | +0% $-180 | +5% $-63 | +10% $54 |
| Rate | -1.0pp $-11 | -0.5pp $-95 | base $-180 | +0.5pp $-267 | +1.0pp $-355 |
UW: 25.0% down · 7.5% · 30yr · 1.5% tax · 5.0% vac · 8.0% maint · 8.0% mgmt
Financing live
Cash to close
- Down payment
- $83,750
- Closing costs
- $10,050
- Reserves months
- —
- Total cash needed
- —
Loan-product check · same deal, 3 products live
Conventional
25% down · 7.5% · 30yr
- Down + closing
- —
- Monthly P&I
- —
- Monthly cashflow
- —
- DSCR
- —
- Eligible?
- —
Personal DTI + credit; lowest rate.
DSCR
20% down · 8.5% · 30yr
- Down + closing
- —
- Monthly P&I
- —
- Monthly cashflow
- —
- DSCR
- —
- Eligible?
- —
No personal income docs; deal must DSCR.
Hard money
10% down · 12.0% · 12mo
- Down + closing
- —
- Monthly P&I
- —
- Monthly cashflow
- —
- DSCR
- —
- Eligible?
- —
Short-term bridge; refi at stabilization.
Rent comps 23 comps
| Address | Beds | Baths | Sqft | Rent | $/sqft | DOM | Units | Dist |
|---|---|---|---|---|---|---|---|---|
| 5908 Harvey Gap Ln Argyle, TX | 4.0 | 2.0 | 1836 | $3,800 | $2.07 | 0d | 1 | 0.02mi |
| 5901 Bull Creek Ln Argyle, TX | 3.0 | 2.0 | 1318 | $2,195 | $1.67 | 6d | 1 | 0.07mi |
| 4505 Vintage Blvd Argyle, TX | 1.0–3.0 | 1.0–2.0 | 1195 | $1,744 | $1.46 | 1d | 10 | 0.49mi |
| 4204 Sonoma Dr Argyle, TX | 4.0 | 2.5 | 2105 | $2,100 | $1.00 | 21d | 1 | 0.56mi |
| 4705 Piedmonte Ct Argyle, TX | 4.0 | 2.0 | 1467 | $2,495 | $1.70 | 1d | 1 | 0.60mi |
| 4701 Napa Valley Dr Argyle, TX | 3.0 | 2.0 | 1761 | $1,995 | $1.13 | 46d | 1 | 0.67mi |
| 4657 Bonnie Brae St Argyle, TX | 3.0 | 2.5 | 1100 | $1,800 | $1.64 | 46d | 1 | 0.70mi |
| 3621 Bonnie Brae St Unit 3621 Argyle, TX | 3.0 | 2.5 | 1866 | $2,195 | $1.18 | 46d | 1 | 0.71mi |
| 4008 Vinyard Way Argyle, TX | 3.0 | 2.0 | 1761 | $2,200 | $1.25 | 15d | 1 | 0.72mi |
| 3612 Aaron Pl Argyle, TX | 3.0 | 2.5 | 1684 | $2,350 | $1.40 | 46d | 1 | 0.73mi |
| 3329 Tamarack Ln Argyle, TX | 4.0 | 2.0 | 1994 | $2,600 | $1.30 | 20d | 1 | 0.74mi |
| 3600 Aaron Pl Argyle, TX | 3.0 | 2.5 | 1866 | $2,350 | $1.26 | 20d | 1 | 0.74mi |
| 3413 Aaron Pl Argyle, TX | 3.0 | 2.5 | 1684 | $2,250 | $1.34 | 20d | 1 | 0.75mi |
| 3401 Aaron Pl Argyle, TX | 3.0 | 2.5 | 1922 | $2,500 | $1.30 | 46d | 1 | 0.76mi |
| 3312 Stonecrop Trl Argyle, TX | 3.0 | 2.0 | 1737 | $2,200 | $1.27 | 27d | 1 | 0.89mi |
| 5108 Middlestone Ln Argyle, TX | 4.0 | 2.0 | 1913 | $2,750 | $1.44 | 9d | 1 | 0.90mi |
| 5200 Woodway Dr Argyle, TX | 4.0 | 3.0 | 2129 | $2,600 | $1.22 | 7d | 1 | 0.91mi |
| 5200 Woodway Dr Argyle, TX | 4.0 | 3.0 | 2129 | $2,900 | $1.36 | 46d | 1 | 0.91mi |
| 3128 Buckthorn Ln Argyle, TX | 3.0 | 2.0 | 1845 | $2,395 | $1.30 | 46d | 1 | 0.97mi |
| 4512 Remuda Ln Argyle, TX | 3.0 | 2.0 | 1737 | $2,300 | $1.32 | 46d | 1 | 1.03mi |
| 3121 Hornbeam St Argyle, TX | 3.0 | 2.0 | 1852 | $2,399 | $1.30 | 5d | 1 | 1.04mi |
| 5405 Bardwell Dr Argyle, TX | 3.0 | 2.0 | 1767 | $2,750 | $1.56 | 27d | 1 | 1.43mi |
| 8508 White Rock Ln Argyle, TX | 4.0 | 2.0 | 2041 | $3,000 | $1.47 | 21d | 1 | 1.46mi |
HOA detail
- Monthly dues
- $46 · $552/yr
Listing history 15 events
-
2026-06-16statusdays on market $335,000 Pending 11 DOM
-
2026-06-15days on market $335,000 Active Option Contract 10 DOM
-
2026-06-13statusdays on market $335,000 Active Option Contract 8 DOM
-
2026-06-09days on market $335,000 Active 4 DOM
-
2026-06-08days on market $335,000 Active 3 DOM
-
2026-06-07remarks 430-char remark
-
2026-06-07pricedays on market $335,000 Active 2 DOM
-
2026-06-03days on market $350,000 Active 132 DOM
-
2026-06-02days on market $350,000 Active 131 DOM
-
2026-06-01days on market $350,000 Active 130 DOM
-
2026-05-31days on market $350,000 Active 129 DOM
-
2026-04-03price $350,000 383-char remark
-
2026-03-06price $355,000 383-char remark
-
2026-02-14price $365,000 383-char remark
-
2026-01-22$375,000 Active 383-char remark
ⓘ Source: listings_history table (triggers on properties + properties_extension) + one-shot
backfill from property_details.listing_events for pre-trigger history.
Tax reassessment forecast TX · Resets to sale price
- Current annual tax
- $6,985 · $582/mo
- Projected year-2 tax
- $6,985 · $582/mo
- Expected delta
- $0/yr ($0/mo · -0.0%)
ⓘ Screening estimate from a state-policy table — verify with the county assessor before closing.
Climate risk First Street
- Flood 1/10 Low FEMA zone X (unshaded) · 0% chance over 30 yrs
- Wildfire 5/10 Major
- Heat 7/10 Severe 7 d/yr ≥109°F today · 22 d/yr by 30 yrs out
- Wind 6/10 Major 27% chance of damaging wind over 30 yrs
- Air quality 3/10 Moderate 3 unhealthy d/yr today · 4 by 30 yrs out
Nearby sold comps map
Loading sold comps map…
Walkable amenities ~0.75 mi
Loading nearby amenities…
Taxation est. · year 1
- Rental income
- $35,612
- − Mortgage interest
- −$18,765
- − Property taxes
- −$6,985
- − Insurance
- −$1,675
- − Repairs & maintenance
- −$2,849
- − Management
- −$2,849
- − HOA
- −$552
- − Depreciation
- −$9,745
- Taxable loss
- −$7,809
- Est. tax savings @ 24.0%
- +$1,874
- After-tax cash flow
- $-286/yr
For passive investors: Depreciation is non-cash, so a rental often shows a tax loss while cash-flowing — sheltering income. Rental losses are passive: they offset passive income freely, and up to $25,000/yr can offset ordinary (W-2) income if you actively participate and your MAGI is under $100k (phasing out to $0 by $150k); unused losses carry forward. On sale, claimed depreciation is recaptured at up to 25%, and gains may owe capital-gains tax (a 1031 exchange can defer both). Figures are a year-1 estimate at your 24.0% rate — not tax advice; consult a CPA.
Condition & rehab AI · 12 photos
This single-story brick home in Argyle is in good condition with a good condition score of 75. It features a spacious floor plan, modern appliances, and well-maintained landscaping. The home is priced to sell and is a great opportunity for a potential buyer.
Value-add opportunities
- Both Painting exterior and interior walls — Fresh paint can enhance curb appeal and interior aesthetics
- Both Landscaping improvements — Enhanced landscaping can boost curb appeal and property value
- Both Replace blinds with energy-efficient windows — Improved windows can increase energy efficiency and property value
Renovation cost estimate screening
Value-add ROI direction
- Both Painting exterior and interior walls — Fresh paint can enhance curb appeal and interior aesthetics ↑
- Both Landscaping improvements — Enhanced landscaping can boost curb appeal and property value ↑
- Both Replace blinds with energy-efficient windows — Improved windows can increase energy efficiency and property value ↑
ⓘ Cost ranges are severity-bucket heuristics (US national rule-of-thumb). Get contractor quotes + a written scope before underwriting a rehab budget.
Schools (NCES district)
- District
- Denton ISD
- NCES district ID
- 4816740
- Math proficiency
- 36% ▼ -18.00%
- Reading proficiency
- 43% ▼ -9.00%
- Median HH income
- $58,913
- Composite
- 34.91/100
- National rank
- #5075
- State rank
- #383 of 826 in TX
Livability — Denton
- Score
- 88/100
- State rank
- #2
- US rank
- #210
Category grades
Schools grade is shown separately in the Schools card above.
Census & demographics
- Census place
- Denton, TX
- County
- Denton County · 901,654 people
- City population
- 127,990
- Metro
- Dallas-Fort Worth-Arlington, TX
- Population (ZIP)
- 43,587
- Household income
- $180,982
- Rent vs Own
- Severe rent burden
- 40.0
Population outlook (Denton County) Hauer SSP2
- Today (2025)
- 1,053,010 people
- By 2030
- 1,192,269 · +13.2%
- By 2040
- 1,472,920 · +39.9%
- By 2050
- 1,746,506 · +65.9%
- By 2075
- 2,358,497 · +124.0%
- By 2100
- 2,779,183 · +163.9%
Race, ethnicity, and origin ACS 2023
- Neighborhood character
- Predominantly White (76%)
- Race & ethnicity
- White 76% Hispanic / Latino 10% Two or more races 10% Asian 7% Black 4%
- Hispanic origin (detail)
- Mexican 7%
- Common ancestry
- Italian 3% Romanian 2% Portuguese 2%
- Foreign-born
- 12% · Canada, South Korea, China
- Languages at home
- 87% English-only · Spanish 5% Other Indo-European 3% Other Asian/Pacific 1%
Political lean MEDSL · Denton
- 2024 margin
- R (+13.2) · D 42.7% · R 55.8% · Other 1.5%
- 2008→2024 swing
- +11.0pp toward D · 2008: -24.2pp · 2024: -13.2pp
- All cycles
- 2024: R+13.2 2020: R+8.1 2016: R+20.2 2012: R+31.7 2008: R+24.2
Not yet ingested
- Civics
- —
Market trends
- HPI YoY
- ▼ -81.81%
- Current HPI
- 253.1948
- Rent YoY
- ▲ 1.61%
- Metro
- Dallas-Fort Worth-Arlington, TX
- State GDP YoY
- ▲ 3.95%
- F500 in state
- 110
Industry mix (Fortune 500 HQ in TX)
| Industry | F500 HQs | Revenue |
|---|---|---|
| Energy | 16 | $1,198B |
|
||
| Technology | 5 | $198B |
|
||
| Engineering / Construction | 4 | $72B |
|
||
| Energy Services | 3 | $60B |
|
||
| Utilities | 3 | $41B |
|
||
| Healthcare | 2 | $330B |
|
||
Price history
-10.7% since first listed8 events — show timeline
- 2026-06-16 Pending — NTREIS
- 2026-06-11 Contingent — NTREIS
- 2026-06-05 Listed $335,000 NTREIS
- 2026-06-02 Listing Removed — NTREIS
- 2026-04-03 Price Changed $350,000 NTREIS
- 2026-03-06 Price Changed $355,000 NTREIS
- 2026-02-14 Price Changed $365,000 NTREIS
- 2026-01-22 Listed $375,000 NTREIS
Property tax history
+154.9%/yrLatest (2025): $6,985 · +3.2% YoY. Source: county tax records.
Cash-flow waterfall
monthlySold comps — $/sqft
last 12 mo · ≤1 miLoading sold comps…