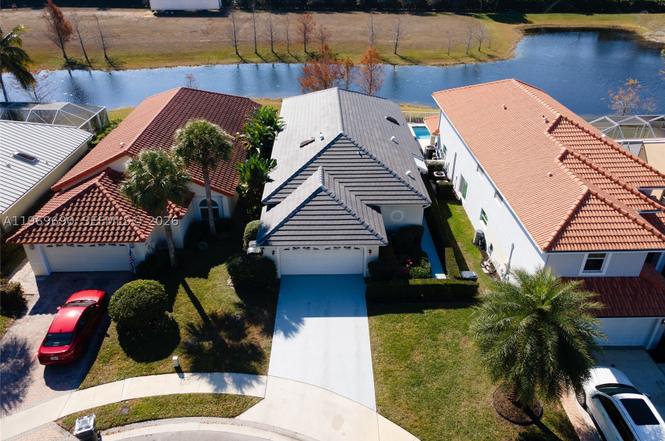
2668 Country Golf Dr · Wellington, FL
Flood risk 1/10 · Minimal
- FEMA flood zone
- X (unshaded)
- Chance of flooding over 30 yrs
- 0.0%
- Est. flood insurance / yr
- $507 – $1,088
Fire risk 3/10 · Minor
- Est. fire insurance / yr
- $947 – $1,759
Heat risk 9/10 · Severe
- Hot days now (above 108°F)
- 7 days/yr
- Hot days in 30 yrs
- 25 days/yr
Wind risk 10/10 · Severe
- Chance of severe wind over 30 yrs
- 99.0%
Air-quality risk 2/10 · Minimal
- Unhealthy air days now
- 1 days/yr
- Unhealthy air days in 30 yrs
- 2 days/yr
Risk factors via First Street. Map © Google.
Why this score? — see what drove the D- grade
The composite is a weighted blend of 9 inputs, each scored 0–100. Each bar is that input's sub-score; the figure is the points it added to the 100-point composite (weight × sub-score).
- Cash flow +11.8/30.0
- ARV discount +7.5/15.0
- Schools +4.3/10.0
- 1% rule +3.7/10.0
- Livability +3.7/5.0
- DSCR +3.5/10.0
- Rent growth +3.1/5.0
- Condition / age +2.5/5.0
- Appreciation +0.0/10.0
$644,900
🖨 Deal sheet 📄 Offer letter ✓ Due diligence
Listing remarks
Located in a prime Wellington location, this beautifully updated 3-bedroom, 2-bath home offers peaceful canal views and modern upgrades just minutes from the equestrian venues. Light-filled open layout features soaring ceilings, and expansive windows and sliding doors leading to a covered patio overlooking the water. The white kitchen flows seamlessly into the main living areas, ideal for everyday living and entertaining. Both bathrooms have been fully renovated with contemporary finishes. Major improvements include a NEW ROOF and IMPACT WINDOWS (2025) for added peace of mind. Additional features include a spacious two-car garage. The community offers convenient golf cart paths leading dire
Key facts
- Modern upgrades
- Covered patio
- White kitchen
Tags
Property features AI
Finance
- Financial info: Pets allowed with restrictions
- HOA & community: Quarterly HOA fee; Association fee: $431 quarterly; Gated community
Exterior
- Parking: Attached garage with 2 spaces; Driveway; Garage door opener; 2 covered spaces
- Security: Gated community
- Utilities: Public water; Public sewer
- Home design: Single-story; Resale property
- Construction: Block construction; Concrete roof
- Exterior features: Porch; Open patio; Room for pool; Fruit trees; Has a view; Faces north
Interior
- Kitchen: Dishwasher; Electric range; Disposal; Refrigerator
- Bedrooms: Includes bedroom on main level
- Flooring: Laminate
- Bathrooms: 2 full bathrooms
- Heating & cooling: Central heating; Central air; Ceiling fan(s)
- Interior features: First-floor entry; Bedroom on main level; Walk-in closet(s)
- Laundry & utility: Washer; Dryer
Neighborhood map
What this means for you Summary
Snapshot
- This is a 3-bed/2.0-bath single-family listed at $645k.
Deal economics
- At list price, monthly cash flow is $-175 ($-2k/yr) — negative.
- To cash-flow at today's rent, offer at most $614k (4.8% below list).
- To meet the 1% rule (rent ≥ 1% of price), the offer needs to be $558k (13.4% below list).
- Recommended offer: $558k (13.4% below list) — sets the bar for 1% rule.
- Cap rate 6.0% vs local median 3.4% in Wellington — top-decile yield for the area; either an underpriced asset or a hidden risk that comps aren't pricing in. Stress-test before assuming the spread holds.
Location & tenants
- Location reads 73/100 on livability (#294 in FL, #4,986 nationally) — a middle-class / working-renter tenant base. Strengths: schools A+, crime A+, employment A+; Watch: amenities F, commute F, cost of living F.
- Palm Beach (suburban): math 46% / reading 53% proficiency, ranked #34 of 73 in FL (top 47%) — families likely to look elsewhere, expect single-tenant / working-renter base with shorter leases.
- Market conditions: Rents rising (+2.3%/yr); 616 active listings in the ZIP; 20 comparable units currently listed for rent nearby; rentals at typical pace (median 24d on market — plan ~3-4 weeks tenant-placement turnaround); high-income renter base; 3,974 units permitted in Palm Beach County in 2024 (1,012 in 5+ unit buildings).
- At $5,584/mo this rent would consume 60% of the median local household income ($112k/yr) (locally 1566% of renters already pay >50% of income on rent) — very limited rent-growth headroom before tenants either downsize or default.
Forward outlook
- Local home prices are declining (-3.0%/yr); year-one equity from $4k of loan paydown is wiped out by about $19k of value loss. Plan a longer hold.
- Palm Beach County population projected at +30% by 2050 — long-run rental-demand tailwind backs the buy-and-hold thesis.
Negotiation context
- It's been on market 117 days — a 9% lower offer ($587k) is reasonable based on typical stale-listing flexibility.
- 6 sale attempts since 28y ago; this cycle's ask has dropped $65k (9%) from the opening price — seller is motivated, your offer sets the floor, not the list.
- Current owner paid $475k; 36% above their basis — modest negotiation headroom, anchor on the comps not their cost.
Risks & watch-outs
- Climate carrying-cost: severe wind risk, 99% chance of damaging wind over 30y; extreme-heat days projected 7→25/yr by 2055 (HVAC capex compounding) — expect insurance premiums to compound above CPI over the hold.
Questions for the listing agent
- What do current leases actually rent for vs. the listed asking? Can we see a recent rent roll and the last 12 months of T-12 income?
- It's been on market 117 days. Have you received any prior offers? Is the seller open to a 13% concession, seller financing, or rate buy-down credit?
- What does the HOA fee cover, when was the last increase, and are there any pending special assessments or reserve-fund shortfalls?
- Why hasn't it sold? Are there any deal-killer items the seller is aware of (foundation, flood, title, zoning, code violations)?
- Is there a deadline driving the sale (1031 exchange, divorce, estate, relocation)? That informs how much negotiation room exists.
- Schools are A-rated — typically a magnet for longer-tenancy family renters. What's the average tenant stay here, and is there a school-zone premium baked into asking?
- The area grade is low — what's the realistic commute time and amenity access for the typical tenant pool here? Any planned neighborhood developments (good or bad) we should know about?
- What's the average days-on-market for RENTAL listings here right now (not sales)? A rising rental-DOM trend means longer vacancies and softer asking-rent achievability than the comps imply.
- What's the recent tenant-quality profile in this submarket — average credit score on applications, eviction rate, late-payment / NSF rate, and stable-employment percentage? A property-management company in the area should have these aggregated.
- How much new for-sale + rental construction is in the pipeline within 1–3 miles? Heavy new supply typically softens prices + rents 12–24 months out; constrained supply supports both.
Investment metrics
- 1% rule
- 0.87% ✗
- Cap rate
- 5.97%
- Cash-on-cash
- -1.17%
- DSCR
- 0.95
- GRM
- 9.6
CMA / ARV
No comps found within radius.
Projected returns pro-forma
-3.0% appreciation · 2.31% rent growth · sell at horizon
- IRR
- -19.0%
- Equity multiple
- 0.34×
- Total profit
- $-119,362
- Equity at exit
- $96,157
- IRR
- -13.0%
- Equity multiple
- 0.26×
- Total profit
- $-133,241
- Equity at exit
- $55,759
Cash invested: $180,572 (down + closing). Projections, not guarantees.
Landlord ↔ Tenant lean methodology
- Overall (STATE)
- 87 Strongly Landlord-Friendly
- State Florida
- 87 Strongly Landlord-Friendly · R+3
- County
- — inherits STATE
- City
- — inherits STATE
ZIP-level market 33414
- Home prices YoY
- -30.2%
- Rents YoY
- 2.3%
- Active inventory
- 616
- Price-to-rent
- 9.6×
Monthly cashflow live
- Estimated rent
- $5,584 high interval (Pro) →
- Mortgage (P&I)
- −$3,382
- Tax from tax record
- −$792 /mo · $9,505/yr
- Insurance
- −$269
- HOA
- −$144
- Vacancy / Maint / Mgmt
- −$1,173
- Net cashflow
- $-175
Break-even live
UW: 25.0% down · 7.5% · 30yr · 1.5% tax · 5.0% vac · 8.0% maint · 8.0% mgmt
Financing live
Cash to close
- Down payment
- $161,225
- Closing costs
- $19,347
- Reserves months
- —
- Total cash needed
- —
Loan-product check · same deal, 3 products live
Conventional
25% down · 7.5% · 30yr
- Down + closing
- —
- Monthly P&I
- —
- Monthly cashflow
- —
- DSCR
- —
- Eligible?
- —
Personal DTI + credit; lowest rate.
DSCR
20% down · 8.5% · 30yr
- Down + closing
- —
- Monthly P&I
- —
- Monthly cashflow
- —
- DSCR
- —
- Eligible?
- —
No personal income docs; deal must DSCR.
Hard money
10% down · 12.0% · 12mo
- Down + closing
- —
- Monthly P&I
- —
- Monthly cashflow
- —
- DSCR
- —
- Eligible?
- —
Short-term bridge; refi at stabilization.
Rent comps 20 comps
| Address | Beds | Baths | Sqft | Rent | $/sqft | DOM | Units | Dist |
|---|---|---|---|---|---|---|---|---|
| 2573 Country Golf Dr Wellington, FL | 3.0 | 2.0 | 1812 | $7,500 | $4.14 | 24d | 1 | 0.15mi |
| 2721 Neaton Ct Wellington, FL | 3.0 | 3.0 | 1850 | $4,800 | $2.59 | 22d | 1 | 0.15mi |
| 2447 Country Golf Dr Wellington, FL | 4.0 | 2.5 | 2125 | $8,000 | $3.76 | 7d | 1 | 0.31mi |
| 15072 Corby Ct Wellington, FL | 3.0 | 2.0 | 1943 | $9,000 | $4.63 | 24d | 1 | 0.32mi |
| 15155 Newquay Ct Wellington, FL | 3.0 | 2.0 | 1943 | $5,000 | $2.57 | 24d | 1 | 0.58mi |
| 1871 Corsica Dr Wellington, FL | 4.0 | 2.0 | 2282 | $7,500 | $3.29 | 24d | 1 | 1.15mi |
| 1520 S Club Dr Wellington, FL | 3.0 | 2.0 | 2462 | $7,500 | $3.05 | 24d | 1 | 1.28mi |
| 13885 Sheffield St Wellington, FL | 4.0 | 2.0 | 2196 | $5,600 | $2.55 | 24d | 1 | 1.29mi |
| 13805 Sheffield St Wellington, FL | 4.0 | 2.5 | 2462 | $4,300 | $1.75 | 18d | 1 | 1.37mi |
| 2963 Werwood Ct Wellington, FL | 4.0 | 2.0 | 2053 | $5,000 | $2.44 | 24d | 1 | 1.38mi |
| 1774 Primrose Ln Wellington, FL | 4.0 | 2.0 | 1715 | $3,500 | $2.04 | 5d | 1 | 1.41mi |
| 1774 Primrose Ln Wellington, FL | 4.0 | 2.0 | 1715 | $3,500 | $2.04 | 24d | 1 | 1.41mi |
| 13796 Yarmouth Dr Wellington, FL | 3.0 | 2.0 | 1384 | $2,500 | $1.81 | 24d | 1 | 1.44mi |
| 13814 Yarmouth Dr Wellington, FL | 3.0 | 2.5 | 1536 | $2,500 | $1.63 | 24d | 1 | 1.44mi |
| 1750 Primrose Ln Wellington, FL | 3.0 | 2.0 | 1714 | $3,600 | $2.10 | 3d | 1 | 1.45mi |
| 1840 Hollyhock Rd Wellington, FL | 3.0 | 2.0 | 2000 | $4,750 | $2.38 | 24d | 1 | 1.46mi |
| 13769 Yarmouth Dr Wellington, FL | 3.0 | 2.0 | 1429 | $2,600 | $1.82 | 15d | 1 | 1.46mi |
| 13769 Yarmouth Dr Wellington, FL | 3.0 | 2.0 | 1429 | $2,600 | $1.82 | 16d | 1 | 1.46mi |
| 2962 Bolton Ct Wellington, FL | 3.0 | 2.0 | 2134 | $3,750 | $1.76 | 24d | 1 | 1.47mi |
| 2981 Dovedale Ct Wellington, FL | 4.0 | 3.0 | 2438 | $9,000 | $3.69 | 24d | 1 | 1.49mi |
HOA detail
- Monthly dues
- $144 · $1,728/yr
- Likely covers
- water
Listing history 35 events
-
2026-06-18days on market $644,900 Active 117 DOM
-
2026-06-17days on market $644,900 Active 116 DOM
-
2026-06-16days on market $644,900 Active 115 DOM
-
2026-06-15days on market $644,900 Active 114 DOM
-
2026-06-13days on market $644,900 Active 112 DOM
-
2026-06-09days on market $644,900 Active 108 DOM
-
2026-06-07days on market $644,900 Active 106 DOM
-
2026-06-04days on market $644,900 Active 103 DOM
-
2026-06-03days on market $644,900 Active 102 DOM
-
2026-06-02price $644,900 Active 100 DOM
-
2026-06-01days on market $665,000 Active 100 DOM
-
2026-05-31days on market $665,000 Active 99 DOM
-
2026-04-17price $665,000
-
2026-03-05price $685,000
-
2026-02-21$710,000 Active
-
2022-06-07soldstatus $475,000
-
2021-07-12status Pending
-
2021-04-01historical
-
2021-04-01historical
-
2021-01-18$300,000 Active
-
2020-07-01status Pending
-
2020-07-01historical
-
2020-06-29$149,000 Active
-
2007-10-04historical
-
2007-08-15$450,000
-
2006-05-01soldstatus $380,000
-
2006-04-24soldstatus $360,000
-
2006-03-15historical
-
2006-01-28$379,000
-
2004-10-05soldstatus $288,000
-
1998-12-21soldstatus $139,900
-
1998-10-30historical
-
1998-05-22$149,900
-
1993-12-29soldstatus $30,000
-
1993-03-24soldstatus $987,600
ⓘ Source: listings_history table (triggers on properties + properties_extension) + one-shot
backfill from property_details.listing_events for pre-trigger history.
Tax reassessment forecast FL · Resets to sale price
- Current annual tax
- $9,505 · $792/mo
- Projected year-2 tax
- $9,505 · $792/mo
- Expected delta
- $0/yr ($0/mo · 0.0%)
ⓘ Screening estimate from a state-policy table — verify with the county assessor before closing.
Climate risk First Street
- Flood 1/10 Low FEMA zone X (unshaded) · 0% chance over 30 yrs
- Wildfire 3/10 Moderate
- Heat 9/10 Extreme 7 d/yr ≥108°F today · 25 d/yr by 30 yrs out
- Wind 10/10 Extreme 99% chance of damaging wind over 30 yrs
- Air quality 2/10 Low 1 unhealthy d/yr today · 2 by 30 yrs out
Nearby sold comps map
Loading sold comps map…
Walkable amenities ~0.75 mi
Loading nearby amenities…
Taxation est. · year 1
- Rental income
- $67,007
- − Mortgage interest
- −$36,124
- − Property taxes
- −$9,505
- − Insurance
- −$3,224
- − Repairs & maintenance
- −$5,361
- − Management
- −$5,361
- − HOA
- −$1,728
- − Depreciation
- −$18,761
- Taxable loss
- −$13,057
- Est. tax savings @ 24.0%
- +$3,134
- After-tax cash flow
- $1,028/yr
For passive investors: Depreciation is non-cash, so a rental often shows a tax loss while cash-flowing — sheltering income. Rental losses are passive: they offset passive income freely, and up to $25,000/yr can offset ordinary (W-2) income if you actively participate and your MAGI is under $100k (phasing out to $0 by $150k); unused losses carry forward. On sale, claimed depreciation is recaptured at up to 25%, and gains may owe capital-gains tax (a 1031 exchange can defer both). Figures are a year-1 estimate at your 24.0% rate — not tax advice; consult a CPA.
Schools (NCES district)
- District
- Palm Beach
- NCES district ID
- 1201500
- Math proficiency
- 46% ▼ -16.00%
- Reading proficiency
- 53% ▼ -4.00%
- Median HH income
- $53,943
- Composite
- 42.72/100
- National rank
- #3160
- State rank
- #34 of 73 in FL
Livability — Wellington
- Score
- 73/100
- State rank
- #294
- US rank
- #4986
Category grades
Schools grade is shown separately in the Schools card above.
Census & demographics
- Census place
- Wellington, FL
- County
- Palm Beach County · 1,438,312 people
- City population
- 60,184
- Metro
- Miami-Fort Lauderdale-Pompano Beach, FL
- Population (ZIP)
- 60,184
- Household income
- $112,241
- Rent vs Own
- Severe rent burden
- 1566.0
Population outlook (Palm Beach County) Hauer SSP2
- Today (2025)
- 1,637,487 people
- By 2030
- 1,743,255 · +6.5%
- By 2040
- 1,948,712 · +19.0%
- By 2050
- 2,132,979 · +30.3%
- By 2075
- 2,530,027 · +54.5%
- By 2100
- 2,706,979 · +65.3%
Race, ethnicity, and origin ACS 2023
- Neighborhood character
- Diverse neighborhood (Simpson 0.67)
- Race & ethnicity
- White 47% Hispanic / Latino 29% Two or more races 20% Black 13% Asian 6%
- Hispanic origin (detail)
- Mexican 4% Puerto Rican 5% Cuban 6% Dominican 1% Salvadoran 1%
- Common ancestry
- Hispanic 4% Romanian 3% Lithuanian 2%
- Foreign-born
- 26% · Canada, Jamaica, China
- Languages at home
- 67% English-only · Spanish 23% French/Haitian/Cajun 3% Other Indo-European 3%
Political lean MEDSL · Palm Beach
- 2024 margin
- Toss-up / Even · D 50.0% · R 49.2%
- 2008→2024 swing
- -22.1pp toward R · 2008: 22.9pp · 2024: 0.8pp
- All cycles
- 2024: D+0.8 2020: D+12.8 2016: D+15.3 2012: D+17.0 2008: D+22.9
Not yet ingested
- Civics
- —
Market trends
- HPI YoY
- ▼ -152.58%
- Current HPI
- 352.9366
- Rent YoY
- ▲ 2.31%
- Metro
- Miami-Fort Lauderdale-Pompano Beach, FL
- State GDP YoY
- ▲ 3.28%
- F500 in state
- 36
Industry mix (Fortune 500 HQ in FL)
| Industry | F500 HQs | Revenue |
|---|---|---|
| Industrial Technology | 2 | $29B |
|
||
| Insurance | 2 | $17B |
|
||
| Retail | 1 | $60B |
|
||
| Technology Distribution | 1 | $58B |
|
||
| Homebuilding | 1 | $35B |
|
||
| Technology Manufacturing | 1 | $35B |
|
||
Price history
-32.7% since first listed23 events — show timeline
- 2026-04-17 Price Changed $665,000 MARMLS
- 2026-03-05 Price Changed $685,000 MARMLS
- 2026-02-21 Listed $710,000 MARMLS
- 2022-06-07 Sold (Public Records) $475,000 Public Records
- 2021-07-12 Pending — Beaches MLS
- 2021-04-01 Listing Removed — Beaches MLS
- 2021-04-01 Listing Removed — Beaches MLS
- 2021-01-18 Listed $300,000 Beaches MLS
- 2020-07-01 Pending — MARMLS
- 2020-07-01 Listing Removed — MARMLS
- 2020-06-29 Listed $149,000 MARMLS
- 2007-10-04 Listing Removed — Beaches MLS
- 2007-08-15 Listed $450,000 Beaches MLS
- 2006-05-01 Sold (Public Records) $380,000 Public Records
- 2006-04-24 Sold (MLS) $360,000 Beaches MLS
- 2006-03-15 Listing Removed — Beaches MLS
- 2006-01-28 Listed $379,000 Beaches MLS
- 2004-10-05 Sold (Public Records) $288,000 Public Records
- 1998-12-21 Sold (Public Records) $139,900 Public Records
- 1998-10-30 Listing Removed — Beaches MLS
- 1998-05-22 Listed $149,900 Beaches MLS
- 1993-12-29 Sold (Public Records) $30,000 Public Records
- 1993-03-24 Sold (Public Records) $987,600 Public Records
Property tax history
+5.7%/yrLatest (2025): $9,505 · +2.8% YoY. Source: county tax records.
Cash-flow waterfall
monthlySold comps — $/sqft
last 12 mo · ≤1 miLoading sold comps…