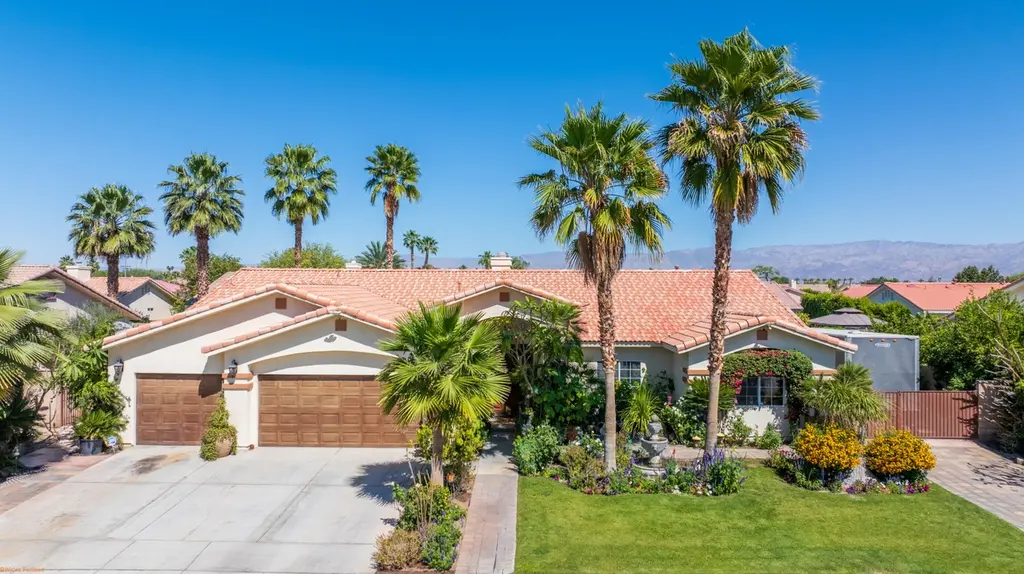
83054 55th Ave · Vista Santa Rosa, CA
Flood risk 1/10 · Minimal
- FEMA flood zone
- X (unshaded)
- Chance of flooding over 30 yrs
- 0.0%
- Est. flood insurance / yr
- $507 – $1,088
Fire risk 7/10 · Major
- Est. fire insurance / yr
- $659 – $1,223
Heat risk 10/10 · Severe
- Hot days now (above 114°F)
- 7 days/yr
- Hot days in 30 yrs
- 19 days/yr
Wind risk 1/10 · Minimal
- Chance of severe wind over 30 yrs
- —
Air-quality risk 4/10 · Minor
- Unhealthy air days now
- 4 days/yr
- Unhealthy air days in 30 yrs
- 5 days/yr
Risk factors via First Street. Map © Google.
Why this score? — see what drove the B- grade
The composite is a weighted blend of 9 inputs, each scored 0–100. Each bar is that input's sub-score; the figure is the points it added to the 100-point composite (weight × sub-score).
- Cash flow +30.0/30.0
- 1% rule +10.0/10.0
- DSCR +10.0/10.0
- Appreciation +10.0/10.0
- Rent growth +2.5/5.0
- Condition / age +2.5/5.0
- Livability +2.2/5.0
- Schools +1.5/10.0
- ARV discount +0.0/15.0
$630,000
🖨 Deal sheet (PDF) 📄 Offer letter ✓ Due diligence
Listing remarks MLS
This is the home you've been waiting for in Vista Santa Rosa! Located just outside the city limits of Indio and La Quinta, enjoy the rare benefit of no HOA, no Mello Roos, and no city taxes saving you thousands each year. This one of a kind property features impressive high ceilings, a grand double door entrance, and a beautiful water fountain upon entry that creates a stunning first impression. The spacious layout offers 4 bedrooms and 3 bathrooms with an open concept design, perfect for modern living and entertaining. Enjoy both a formal dining area and a separate breakfast area. Tile flooring runs throughout the home, adding both style and durability. The property also includes a 3 car garage and RV parking with a private gate. The private backyard provides the perfect space to relax or entertain. This is a unique opportunity you don't want to miss!
Key facts
- Double door entrance
- Open concept design
- Formal dining area
Tags
Neighborhood map
What this means for you Summary
Snapshot
- This is a 4-bed/2.0-bath single-family listed at $630k.
Deal economics
- At list price, monthly cash flow is $5k ($60k/yr) — positive.
- The deal already cash-flows at list — no discount required.
- Meets the 1% rule at list price ($12k rent vs $630k).
- Recommended offer: $592k (6.0% below list) — sets the bar for market timing.
Location & tenants
- Location reads 45/100 on livability (#1,288 in CA) — a working-class tenant base; expect higher turnover. Strengths: housing B+, crime B; Watch: schools F, amenities F, commute F.
- Coachella Valley Unified (rural): math 12% / reading 23% proficiency, ranked #481 of 517 in CA (top 93%) — low school quality limits family demand, transient renter base, plan for 1-2y turnover; 79% free/reduced lunch — lower-income household profile, screen leases tightly.
- Market conditions: 492 active listings in the ZIP; 13 comparable units currently listed for rent nearby; rentals lingering (median 45d on market — plan ~5-8 weeks vacancy on turnover, expect pricing pressure); 85% of comp listings sitting > 30 days — soft ceiling on asking rent; 9,195 units permitted in Riverside County in 2024 (1,512 in 5+ unit buildings).
Forward outlook
- In year one you build about $67k of equity ($4k loan paydown + $63k appreciation (10.0% local appreciation)).
- Riverside County population projected at +22% by 2050 — long-run rental-demand tailwind backs the buy-and-hold thesis.
- At projected returns (10.0% appreciation + 3.0% rent growth), your $176k cash investment doubles in ~2 years — after that, you're playing with house money.
- By year 2, paydown + projected appreciation supports a ~$108k cash-out refi (75% LTV) — recoverable capital for the next deal without selling this one.
Negotiation context
- It's been on market 90 days — a 6% lower offer ($592k) is reasonable based on typical stale-listing flexibility.
- 13 sale attempts since 20y ago with the ask held roughly flat each time — persistent listings suggest the price (not the market) is what's stuck; bring a comps-based counter.
- Current owner paid $224k; list at $630k implies a 182% gain — meaningful room to come down on a strong offer.
Risks & watch-outs
- Climate carrying-cost: major wildfire risk; extreme-heat days projected 7→19/yr by 2055 (HVAC capex compounding) — expect insurance premiums to compound above CPI over the hold.
Questions for the listing agent
- It's been on market 90 days. Have you received any prior offers? Is the seller open to a 6% concession, seller financing, or rate buy-down credit?
- Why hasn't it sold? Are there any deal-killer items the seller is aware of (foundation, flood, title, zoning, code violations)?
- Is there a deadline driving the sale (1031 exchange, divorce, estate, relocation)? That informs how much negotiation room exists.
- Schools are F-rated, which usually means shorter tenancies and higher turnover. Who's the typical renter profile here, and what's been the actual vacancy rate?
- What's the average days-on-market for RENTAL listings here right now (not sales)? A rising rental-DOM trend means longer vacancies and softer asking-rent achievability than the comps imply.
- What's the recent tenant-quality profile in this submarket — average credit score on applications, eviction rate, late-payment / NSF rate, and stable-employment percentage? A property-management company in the area should have these aggregated.
- How much new for-sale + rental construction is in the pipeline within 1–3 miles? Heavy new supply typically softens prices + rents 12–24 months out; constrained supply supports both.
Investment metrics
- 1% rule
- 1.83% ✓
- Cap rate
- 15.84%
- Cash-on-cash
- 34.09%
- DSCR
- 2.52
- GRM
- 4.6
CMA / ARV
- ARV (median comp)
- $531,672
- List price
- $630,000
- Delta
- 18.49%
- Verdict
- OVERPRICED
- Comps
- 12 within 1.0 mi
Show comp detail 2 sales within ~0.75 mi
| Address | Dist | Beds/Ba | Sqft | Sold | Price | $/sf | Match |
|---|---|---|---|---|---|---|---|
| 54859 Bodine Dr | 0.06mi | 4/3.0 | 2,639 (0%) | 17mo | $575,000 | $218 | 79 |
| 83162 55th Ave | 0.09mi | 5/3.5 (+1) | 2,915 (+10%) | 9mo | $595,000 | $204 | 60 |
Match score weights: distance 35% · size 25% · config 20% · recency 20%. Top-matched comps best support the ARV.
Projected returns pro-forma
10.0% appreciation · 3.0% rent growth · sell at horizon
- IRR
- 50.4%
- Equity multiple
- 4.75×
- Total profit
- $662,260
- Equity at exit
- $567,554
- IRR
- 44.0%
- Equity multiple
- 10.63×
- Total profit
- $1,699,304
- Equity at exit
- $1,223,951
Cash invested: $176,400 (down + closing). Projections, not guarantees.
Landlord ↔ Tenant lean methodology
- Overall (STATE)
- 18 Strongly Tenant-Friendly
- State California
- 18 Strongly Tenant-Friendly · D+13
- County
- — inherits STATE
- City
- — inherits STATE
ZIP-level market 92274
- Home prices YoY
- 31.9%
- Active inventory
- 492
- Price-to-rent
- 4.6×
Monthly cashflow live
- Estimated rent
- $11,519 high interval (Pro) →
- Mortgage (P&I)
- −$3,304
- Tax from tax record
- −$523 /mo · $6,278/yr
- Insurance
- −$262
- HOA
- −$0
- Vacancy / Maint / Mgmt
- −$2,419
- Net cashflow
- $5,011
Break-even live
Sensitivity live
| Price | -10% $5,367 | -5% $5,189 | +0% $5,011 | +5% $4,832 | +10% $4,654 |
|---|---|---|---|---|---|
| Rent | -10% $4,101 | -5% $4,556 | +0% $5,011 | +5% $5,466 | +10% $5,921 |
| Rate | -1.0pp $5,328 | -0.5pp $5,171 | base $5,011 | +0.5pp $4,847 | +1.0pp $4,681 |
UW: 25.0% down · 7.5% · 30yr · 1.5% tax · 5.0% vac · 8.0% maint · 8.0% mgmt
Financing live
Cash to close
- Down payment
- $157,500
- Closing costs
- $18,900
- Reserves months
- —
- Total cash needed
- —
Loan-product check · same deal, 3 products live
Conventional
25% down · 7.5% · 30yr
- Down + closing
- —
- Monthly P&I
- —
- Monthly cashflow
- —
- DSCR
- —
- Eligible?
- —
Personal DTI + credit; lowest rate.
DSCR
20% down · 8.5% · 30yr
- Down + closing
- —
- Monthly P&I
- —
- Monthly cashflow
- —
- DSCR
- —
- Eligible?
- —
No personal income docs; deal must DSCR.
Hard money
10% down · 12.0% · 12mo
- Down + closing
- —
- Monthly P&I
- —
- Monthly cashflow
- —
- DSCR
- —
- Eligible?
- —
Short-term bridge; refi at stabilization.
Rent comps 13 comps
| Address | Beds | Baths | Sqft | Rent | $/sqft | DOM | Units | Dist |
|---|---|---|---|---|---|---|---|---|
| 55150 Monroe St La Quinta, CA | 2.0–4.0 | 2.0–4.0 | 1686 | $4,082 | $2.42 | 0d | 35 | 1.02mi |
| 55120 Autumn Valley Ct La Quinta, CA | 4.0 | 4.5 | 3180 | $12,000 | $3.77 | 44d | 1 | 1.10mi |
| 55100 Autumn Valley Ct La Quinta, CA | 3.0 | 4.0 | 3180 | $12,000 | $3.77 | 44d | 1 | 1.11mi |
| 55615 Turnberry Way La Quinta, CA | 4.0 | 4.5 | 3708 | $30,000 | $8.09 | 44d | 1 | 1.16mi |
| 55121 Summer Lynn Ct La Quinta, CA | 4.0 | 4.5 | 3217 | $10,000 | $3.11 | 44d | 1 | 1.20mi |
| 55140 Spring Creek Ct La Quinta, CA | 4.0 | 4.5 | 3075 | $15,000 | $4.88 | 44d | 1 | 1.22mi |
| 81945 Elynor Ct La Quinta, CA | 3.0 | 3.0 | 2673 | $14,000 | $5.24 | 44d | 1 | 1.24mi |
| 81805 Four Seasons Pl La Quinta, CA | 4.0 | 4.0 | 3370 | $7,000 | $2.08 | 44d | 1 | 1.28mi |
| 56705 Village Dr La Quinta, CA | 3.0 | 3.0 | 2987 | $7,775 | $2.60 | 44d | 1 | 1.34mi |
| 81620 Tiburon Dr La Quinta, CA | 4.0 | 3.5 | 3412 | $6,325 | $1.85 | 44d | 1 | 1.46mi |
| 81600 Macbeth St La Quinta, CA | 3.0 | 4.0 | 3131 | $15,000 | $4.79 | 44d | 1 | 1.49mi |
| 81600 Macbeth St La Quinta, CA | 3.0 | 4.0 | 3131 | $15,000 | $4.79 | 6d | 1 | 1.49mi |
| 81670 Haflinger Way La Quinta, CA | 4.0 | 4.5 | 3314 | $15,000 | $4.53 | 44d | 1 | 1.49mi |
Listing history 50 events
-
2026-06-18days on market $630,000 Active 90 DOM
-
2026-06-17days on market $630,000 Active 89 DOM
-
2026-06-16days on market $630,000 Active 88 DOM
-
2026-06-15days on market $630,000 Active 87 DOM
-
2026-06-13days on market $630,000 Active 85 DOM
-
2026-06-13days on market $630,000 Active 84 DOM
-
2026-06-09days on market $630,000 Active 81 DOM
-
2026-06-08days on market $630,000 Active 80 DOM
-
2026-06-07days on market $630,000 Active 79 DOM
-
2026-06-04days on market $630,000 Active 76 DOM
-
2026-06-03days on market $630,000 Active 75 DOM
-
2026-06-02days on market $630,000 Active 74 DOM
-
2026-06-01days on market $630,000 Active 73 DOM
-
2026-05-31days on market $630,000 Active 72 DOM
-
2026-03-20$630,000 Active 864-char remark
Show marketing remark (864 chars)
This is the home you've been waiting for in Vista Santa Rosa! Located just outside the city limits of Indio and La Quinta, enjoy the rare benefit of no HOA, no Mello Roos, and no city taxes saving you thousands each year. This one of a kind property features impressive high ceilings, a grand double door entrance, and a beautiful water fountain upon entry that creates a stunning first impression. The spacious layout offers 4 bedrooms and 3 bathrooms with an open concept design, perfect for modern living and entertaining. Enjoy both a formal dining area and a separate breakfast area. Tile flooring runs throughout the home, adding both style and durability. The property also includes a 3 car garage and RV parking with a private gate. The private backyard provides the perfect space to relax or entertain. This is a unique opportunity you don't want to miss!
-
2023-03-14historical
-
2022-09-13$639,900 Active
-
2014-03-24soldstatus $223,500 Closed
-
2014-02-04status Pending
-
2014-01-31status Active
-
2013-12-03status Pending
-
2013-11-23$220,500 Active
-
2012-11-30historical
-
2012-06-29status Backup Offers Accepted
-
2012-06-29$140,000 Active
-
2011-12-16price $535,000 Expired
-
2011-12-16price $375,000 Cancelled
-
2009-01-30historical
-
2009-01-29soldstatus $245,000
-
2008-12-16historical
-
2008-12-02price $245,000
-
2008-11-13$255,000
-
2008-11-12historical
-
2008-09-26price $249,900
-
2008-09-26status
-
2008-09-20historical
-
2008-09-12$274,900
-
2008-09-11historical
-
2008-08-19price $274,900
-
2008-06-11$299,900
-
2008-01-24historical
-
2008-01-15price $349,900
-
2007-11-21$375,000
-
2007-04-12historical
-
2007-03-28soldstatus $535,000 Closed Sale
-
2007-02-22price $535,000
-
2007-02-18historical
-
2007-01-19$385,000
-
2006-12-04$505,000
-
2006-12-02historical
ⓘ Source: listings_history table (triggers on properties + properties_extension) + one-shot
backfill from property_details.listing_events for pre-trigger history.
Tax reassessment forecast CA · Resets to sale price
- Current annual tax
- $6,278 · $523/mo
- Projected year-2 tax
- $6,278 · $523/mo
- Expected delta
- $0/yr ($0/mo · 0.0%)
ⓘ Screening estimate from a state-policy table — verify with the county assessor before closing.
Climate risk First Street
- Flood 1/10 Low FEMA zone X (unshaded) · 0% chance over 30 yrs
- Wildfire 7/10 Severe
- Heat 10/10 Extreme 7 d/yr ≥114°F today · 19 d/yr by 30 yrs out
- Wind 1/10 Low
- Air quality 4/10 Moderate 4 unhealthy d/yr today · 5 by 30 yrs out
Nearby sold comps map
Loading sold comps map…
Walkable amenities ~0.75 mi
Loading nearby amenities…
Taxation est. · year 1
- Rental income
- $138,230
- − Mortgage interest
- −$35,290
- − Property taxes
- −$6,278
- − Insurance
- −$3,150
- − Repairs & maintenance
- −$11,058
- − Management
- −$11,058
- − Depreciation
- −$18,327
- Taxable income
- $53,068
- Est. tax owed @ 24.0%
- −$12,736
- After-tax cash flow
- $47,392/yr
For passive investors: Depreciation is non-cash, so a rental often shows a tax loss while cash-flowing — sheltering income. Rental losses are passive: they offset passive income freely, and up to $25,000/yr can offset ordinary (W-2) income if you actively participate and your MAGI is under $100k (phasing out to $0 by $150k); unused losses carry forward. On sale, claimed depreciation is recaptured at up to 25%, and gains may owe capital-gains tax (a 1031 exchange can defer both). Figures are a year-1 estimate at your 24.0% rate — not tax advice; consult a CPA.
Schools (NCES district)
- District
- Coachella Valley Unified
- NCES district ID
- 0609070
- Math proficiency
- 12% ▼ -8.00%
- Reading proficiency
- 23% ▼ -6.00%
- Median HH income
- $37,683
- Composite
- 14.62/100
- National rank
- #9408
- State rank
- #481 of 517 in CA
Livability — Vista Santa Rosa
- Score
- 45/100
- State rank
- #1288
- US rank
- #26540
Category grades
Schools grade is shown separately in the Schools card above.
Census & demographics
- Census place
- Vista Santa Rosa, CA
- Population (ZIP)
- 17,909
Population outlook (Riverside County) Hauer SSP2
- Today (2025)
- 2,664,475 people
- By 2030
- 2,802,692 · +5.2%
- By 2040
- 3,050,904 · +14.5%
- By 2050
- 3,256,783 · +22.2%
- By 2075
- 3,655,058 · +37.2%
- By 2100
- 3,766,594 · +41.4%
Race, ethnicity, and origin ACS 2023
- Neighborhood character
- Predominantly Hispanic (88%)
- Race & ethnicity
- Hispanic / Latino 88% Two or more races 49% White 10%
- Hispanic origin (detail)
- Mexican 87%
- Common ancestry
- Italian 1% Portuguese 1%
- Foreign-born
- 42% · Canada
- Languages at home
- 24% English-only · Spanish 76%
Political lean MEDSL · Riverside
- 2024 margin
- Toss-up / Even · D 48.0% · R 49.3% · Other 2.6%
- 2008→2024 swing
- -3.6pp toward R · 2008: 2.3pp · 2024: -1.3pp
- All cycles
- 2024: R+1.3 2020: D+8.0 2016: D+4.3 2012: R+0.4 2008: D+2.3
Not yet ingested
- Civics
- —
Market trends
- HPI YoY
- ▲ 179.97%
- Current HPI
- 744.8454
- Rent YoY
- —
- Metro
- —
- State GDP YoY
- ▲ 3.21%
- F500 in state
- 116
Industry mix (Fortune 500 HQ in CA)
| Industry | F500 HQs | Revenue |
|---|---|---|
| Technology | 27 | $1,492B |
|
||
| Financial Services | 3 | $174B |
|
||
| Retail | 3 | $44B |
|
||
| Insurance | 3 | $26B |
|
||
| Media / Entertainment | 2 | $115B |
|
||
| Pharmaceuticals / Biotech | 2 | $62B |
|
||
Price history
-47.5% since first listed38 events — show timeline
- 2026-03-20 Listed $630,000 GPSMLS
- 2023-03-14 Listing Removed — GPSMLS
- 2022-09-13 Listed $639,900 GPSMLS
- 2014-03-24 Sold (MLS) $223,500 GPSMLS
- 2014-02-04 Pending — GPSMLS
- 2014-01-31 Relisted — GPSMLS
- 2013-12-03 Pending — GPSMLS
- 2013-11-23 Listed $220,500 GPSMLS
- 2012-11-30 Listing Removed — GPSMLS
- 2012-06-29 Pending — GPSMLS
- 2012-06-29 Listed $140,000 GPSMLS
- 2011-12-16 Price Changed $535,000 GPSMLS
- 2011-12-16 Price Changed $375,000 GPSMLS
- 2009-01-30 Listing Removed — GPSMLS
- 2009-01-29 Sold (Public Records) $245,000 Public Records
- 2008-12-16 Contingent — GPSMLS
- 2008-12-02 Price Changed $245,000 GPSMLS
- 2008-11-13 Listed $255,000 GPSMLS
- 2008-11-12 Listing Removed — GPSMLS
- 2008-09-26 Price Changed $249,900 GPSMLS
- 2008-09-26 Relisted — GPSMLS
- 2008-09-20 Listing Removed — GPSMLS
- 2008-09-12 Listed $274,900 GPSMLS
- 2008-09-11 Listing Removed — GPSMLS
- 2008-08-19 Price Changed $274,900 GPSMLS
- 2008-06-11 Listed $299,900 GPSMLS
- 2008-01-24 Listing Removed — GPSMLS
- 2008-01-15 Price Changed $349,900 GPSMLS
- 2007-11-21 Listed $375,000 GPSMLS
- 2007-04-12 Listing Removed — CRMLS
- 2007-03-28 Sold (MLS) $535,000 CRMLS
- 2007-02-22 Price Changed $535,000 CRMLS
- 2007-02-18 Listing Removed — GPSMLS
- 2007-01-19 Listed $385,000 GPSMLS
- 2006-12-04 Listed $505,000 CRMLS
- 2006-12-02 Listing Removed — GPSMLS
- 2006-09-12 Listed $479,900 GPSMLS
- 2002-05-29 Sold (Public Records) $1,200,000 Public Records
Property tax history
+6.3%/yrLatest (2025): $6,278 · +2.8% YoY. Source: county tax records.
Cash-flow waterfall
monthlySold comps — $/sqft
last 12 mo · ≤1 miLoading sold comps…