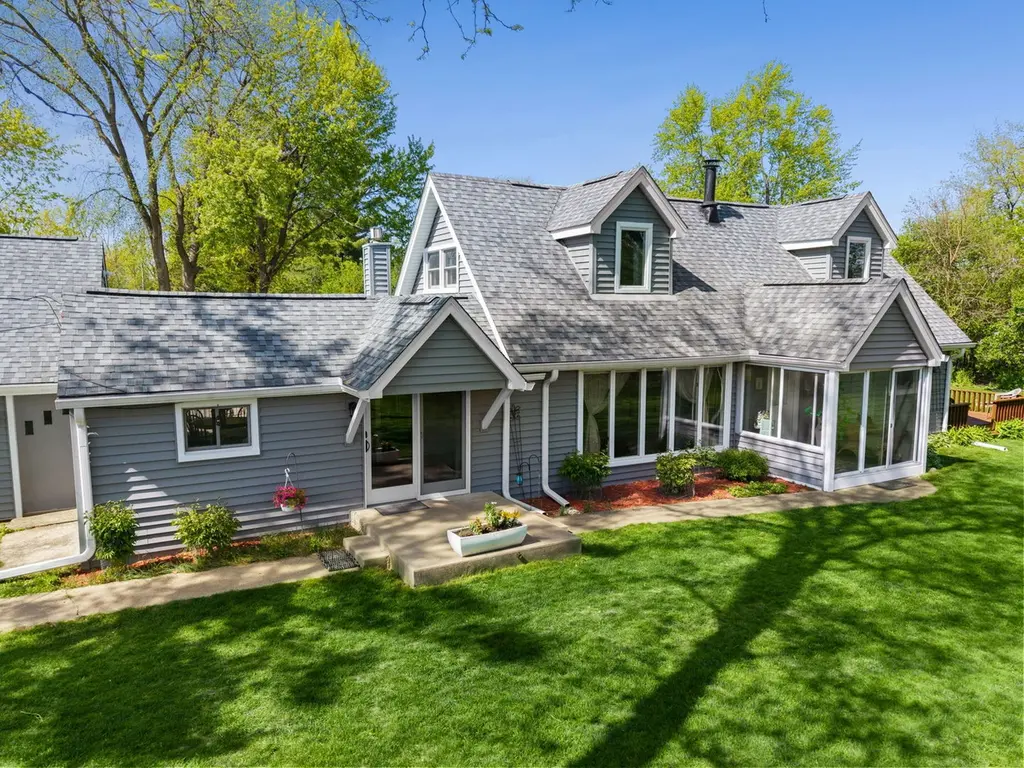
1080 Cardinal Dr S · Lake Zurich, IL
Flood risk 1/10 · Minimal
- FEMA flood zone
- X (unshaded)
- Chance of flooding over 30 yrs
- 0.0%
- Est. flood insurance / yr
- $507 – $1,088
Fire risk 2/10 · Minimal
- Est. fire insurance / yr
- $804 – $1,492
Heat risk 2/10 · Minimal
- Hot days now (above 100°F)
- 7 days/yr
- Hot days in 30 yrs
- 14 days/yr
Wind risk 2/10 · Minimal
- Chance of severe wind over 30 yrs
- —
Air-quality risk 3/10 · Minor
- Unhealthy air days now
- 3 days/yr
- Unhealthy air days in 30 yrs
- 3 days/yr
Risk factors via First Street. Map © Google.
Why this score? — see what drove the D- grade
The composite is a weighted blend of 9 inputs, each scored 0–100. Each bar is that input's sub-score; the figure is the points it added to the 100-point composite (weight × sub-score).
- ARV discount +15.0/15.0
- Cash flow +6.2/30.0
- Schools +4.6/10.0
- Livability +3.8/5.0
- Rent growth +2.5/5.0
- Condition / age +2.5/5.0
- 1% rule +1.9/10.0
- DSCR +0.6/10.0
- Appreciation +0.0/10.0
$549,900
🖨 Deal sheet (PDF) 📄 Offer letter ✓ Due diligence
Listing remarks
Set on a picturesque one-acre lot just minutes from town, this beautifully updated country home offers the perfect blend of charm, comfort, and modern upgrades. Sunlight fills the home, highlighting the stunning updated kitchen with all NEW appliances (2019) complete with heated floors bringing both style and everyday luxury to the heart of the home. The open layout features expansive living spaces, including a cozy family room with a wood-burning fireplace, great room with seamless access to a large deck and screened porch with peaceful, private views. Step outside to enjoy the patio off the eating area for entertaining, BBQ's or unwind in the NEW above-ground pool (2024) perfect for summ
Key facts
- 1 acre lot
- 2 garage spots
- Pool
Property features AI
Finance
- Other: Approximately 2,300 total finished/unfinished square feet (about 1,500 main level and 800 upper); Lot dimensions about 194 x 224 (.50–.99 acre)
- HOA & community: No master association fee required
Exterior
- Parking: Attached garage (garage owned) with 2 garage spaces; Gravel parking areas; Garage door opener
- Utilities: Well water source; Septic tank sewer; 200+ amp electric service
- Home design: Detached single-family home; 1.5-story design; Fee simple ownership; Rehab completed in 2020; Property built approximately 71–80 years ago
- Construction: Vinyl siding; Asphalt roof; Concrete perimeter foundation; Home built before 1978
- Exterior features: Above-ground pool; Deck; Patio; Screened porch; Landscaped grounds; Wooded lot; Rear-of-lot location
Interior
- Kitchen: Range; Microwave; Dishwasher; Refrigerator; Eating-area/table space in kitchen; Ceramic tile flooring in kitchen
- Bedrooms: Master bedroom on main level (full bath); Two additional bedrooms on second level (both with hardwood floors and window treatments)
- Flooring: Hardwood flooring in main living areas and bedrooms; Ceramic tile in dining and kitchen areas; Vinyl flooring in laundry; Other flooring in enclosed porch
- Bathrooms: Two full bathrooms; Whirlpool in one bathroom
- Heating & cooling: Natural gas heating; Steam heating; Baseboard heating; Radiant floor heating; Central air conditioning
- Interior features: First-floor bedroom; First-floor full bath; Whirlpool tub; Wood-burning fireplace in family room; Water-softener (owned); CO detectors; Sump pump; Seven total rooms
- Laundry & utility: Main-level laundry (in unit); Washer; Dryer
Neighborhood map
What this means for you Summary
Snapshot
- This is a 3-bed/1.5-bath single-family listed at $550k.
Deal economics
- At list price, monthly cash flow is $-992 ($-12k/yr) — negative.
- To cash-flow at today's rent, offer at most $375k (31.9% below list).
- To meet the 1% rule (rent ≥ 1% of price), the offer needs to be $381k (30.8% below list).
- Recommended offer: $375k (31.9% below list) — sets the bar for cash-flow.
Location & tenants
- Location reads 76/100 on livability (#175 in IL, #3,345 nationally) — a middle-class / working-renter tenant base. Strengths: crime A+, employment A+, housing A+; Watch: health & safety C-, amenities F, commute F.
- Lake Zurich CUSD 95 (suburban): math 47% / reading 47% proficiency, ranked #44 of 620 in IL (top 7%) — families likely to look elsewhere, expect single-tenant / working-renter base with shorter leases; only 10% free/reduced lunch — higher-income household profile.
- Zoned schools: May Whitney Elem School (math 45% / reading 37%, grade F, #372 of 2,056 statewide, top 18%, 657 students, 0% FRL); Lake Zurich Middle - S Campus (math 41% / reading 50%, grade D+, #89 of 665 statewide, top 14%, 599 students, 0% FRL); Lake Zurich High School (math 54% / reading 58%, grade C, #25 of 693 statewide, top 4%, 1,804 students, 0% FRL).
- Market conditions: 164 active listings in the ZIP; 3 comparable units currently listed for rent nearby; rentals leasing fast (median 1d on market — plan ~1-2 weeks tenant-placement turnaround); high-income renter base; 948 units permitted in Lake County in 2024 (424 in 5+ unit buildings).
Forward outlook
- Local home prices are declining (-3.0%/yr); year-one equity from $4k of loan paydown is wiped out by about $16k of value loss. Plan a longer hold.
- Lake County population projected to shrink 8% by 2050 — rents likely to lag national; underwrite the cash flow, not the appreciation.
Negotiation context
- It's been on market 46 days — a 3% lower offer ($533k) is reasonable based on typical stale-listing flexibility.
- 2 sale attempts with the ask held roughly flat each time — persistent listings suggest the price (not the market) is what's stuck; bring a comps-based counter.
- Current owner paid $324k; list at $550k implies a 69% gain — meaningful room to come down on a strong offer.
Risks & watch-outs
- Watch-outs: built in 1954 — expect roof / HVAC / electrical / plumbing capex.
Questions for the listing agent
- What do current leases actually rent for vs. the listed asking? Can we see a recent rent roll and the last 12 months of T-12 income?
- It's been on market 46 days. Have you received any prior offers? Is the seller open to a 32% concession, seller financing, or rate buy-down credit?
- Built in 1954 — when were the roof, HVAC, electrical panel, plumbing, and water heater last replaced?
- Is there a deadline driving the sale (1031 exchange, divorce, estate, relocation)? That informs how much negotiation room exists.
- Schools are B-rated — typically a magnet for longer-tenancy family renters. What's the average tenant stay here, and is there a school-zone premium baked into asking?
- The area grade is low — what's the realistic commute time and amenity access for the typical tenant pool here? Any planned neighborhood developments (good or bad) we should know about?
- What's the average days-on-market for RENTAL listings here right now (not sales)? A rising rental-DOM trend means longer vacancies and softer asking-rent achievability than the comps imply.
- What's the recent tenant-quality profile in this submarket — average credit score on applications, eviction rate, late-payment / NSF rate, and stable-employment percentage? A property-management company in the area should have these aggregated.
- How much new for-sale + rental construction is in the pipeline within 1–3 miles? Heavy new supply typically softens prices + rents 12–24 months out; constrained supply supports both.
Investment metrics
- 1% rule
- 0.69% ✗
- Cap rate
- 4.13%
- Cash-on-cash
- -7.73%
- DSCR
- 0.66
- GRM
- 12.0
CMA / ARV
- ARV (median comp)
- $760,863
- List price
- $549,900
- Delta
- -27.73%
- Verdict
- UNDERPRICED
- Comps
- 20 within 1.0 mi
Show comp detail 12 sales within ~0.75 mi
| Address | Dist | Beds/Ba | Sqft | Sold | Price | $/sf | Match |
|---|---|---|---|---|---|---|---|
| 715 Fieldstone Cir | 0.39mi | 4/2.5 (+1) | 2,054 (-3%) | 0mo | $625,000 | $304 | 68 |
| 958 Pheasant Ridge Dr | 0.38mi | 4/2.5 (+1) | 2,200 (+4%) | 4mo | $508,000 | $231 | 63 |
| 551 Shaker Ln | 0.24mi | 4/2.5 (+1) | 1,912 (-10%) | 1mo | $577,000 | $302 | 63 |
| 681 Windemere Ln | 0.17mi | 4/2.5 (+1) | 2,333 (+10%) | 4mo | $552,000 | $237 | 62 |
| 1201 Tracie Dr | 0.66mi | 3/2.5 | 2,073 (-2%) | 5mo | $575,000 | $277 | 58 |
| 282 Waterford Dr | 0.60mi | 4/2.5 (+1) | 2,162 (+2%) | 2mo | $677,000 | $313 | 57 |
| 600 Ivy Ct | 0.40mi | 4/2.5 (+1) | 2,303 (+9%) | 4mo | $608,000 | $264 | 54 |
| 695 Trailside Dr | 0.38mi | 4/2.5 (+1) | 1,863 (-12%) | 3mo | $525,000 | $282 | 51 |
| 800 White Birch Ln | 0.72mi | 4/2.0 (+1) | 1,955 (-8%) | 1mo | $420,000 | $215 | 46 |
| 34 E Harbor Dr | 0.55mi | 3/2.5 | 2,424 (+15%) | 3mo | $430,000 | $177 | 43 |
| 530 Cypress Bridge Rd | 0.70mi | 4/2.5 (+1) | 2,340 (+11%) | 0mo | $575,000 | $246 | 40 |
| 533 Surryse Rd | 0.70mi | 4/2.0 (+1) | 1,886 (-11%) | 3mo | $429,900 | $228 | 40 |
Match score weights: distance 35% · size 25% · config 20% · recency 20%. Top-matched comps best support the ARV.
Projected returns pro-forma
-3.0% appreciation · 3.0% rent growth · sell at horizon
- IRR
- -29.8%
- Equity multiple
- 0.01×
- Total profit
- $-152,132
- Equity at exit
- $81,992
- IRR
- -30.7%
- Equity multiple
- -0.38×
- Total profit
- $-213,130
- Equity at exit
- $47,545
Cash invested: $153,972 (down + closing). Projections, not guarantees.
Landlord ↔ Tenant lean methodology
- Overall (STATE)
- 43 Moderately Tenant-Leaning
- State Illinois
- 43 Moderately Tenant-Leaning · D+7
- County
- — inherits STATE
- City
- — inherits STATE
ZIP-level market 60047
- Active inventory
- 164
- Price-to-rent
- 12.0×
Monthly cashflow live
- Estimated rent
- $3,805 medium interval (Pro) →
- Mortgage (P&I)
- −$2,884
- Tax from tax record
- −$886 /mo · $10,628/yr
- Insurance
- −$229
- HOA
- −$0
- Vacancy / Maint / Mgmt
- −$799
- Net cashflow
- $-992
Break-even live
Sensitivity live
| Price | -10% $-681 | -5% $-837 | +0% $-992 | +5% $-1,148 | +10% $-1,304 |
|---|---|---|---|---|---|
| Rent | -10% $-1,293 | -5% $-1,143 | +0% $-992 | +5% $-842 | +10% $-692 |
| Rate | -1.0pp $-715 | -0.5pp $-852 | base $-992 | +0.5pp $-1,135 | +1.0pp $-1,280 |
UW: 25.0% down · 7.5% · 30yr · 1.5% tax · 5.0% vac · 8.0% maint · 8.0% mgmt
Financing live
Cash to close
- Down payment
- $137,475
- Closing costs
- $16,497
- Reserves months
- —
- Total cash needed
- —
Loan-product check · same deal, 3 products live
Conventional
25% down · 7.5% · 30yr
- Down + closing
- —
- Monthly P&I
- —
- Monthly cashflow
- —
- DSCR
- —
- Eligible?
- —
Personal DTI + credit; lowest rate.
DSCR
20% down · 8.5% · 30yr
- Down + closing
- —
- Monthly P&I
- —
- Monthly cashflow
- —
- DSCR
- —
- Eligible?
- —
No personal income docs; deal must DSCR.
Hard money
10% down · 12.0% · 12mo
- Down + closing
- —
- Monthly P&I
- —
- Monthly cashflow
- —
- DSCR
- —
- Eligible?
- —
Short-term bridge; refi at stabilization.
Rent comps 3 comps
| Address | Beds | Baths | Sqft | Rent | $/sqft | DOM | Units | Dist |
|---|---|---|---|---|---|---|---|---|
| 375 Pebble Creek Dr Lake Zurich, IL | 3.0 | 1.5 | 1550 | $4,995 | $3.22 | 0d | 1 | 0.79mi |
| 121 Rosehall Dr Lake Zurich, IL | 3.0 | 3.0 | 2000 | $3,600 | $1.80 | 45d | 1 | 1.07mi |
| 250 Rosehall Dr #260 Lake Zurich, IL | 2.0 | 2.0 | 1489 | $2,500 | $1.68 | 0d | 1 | 1.15mi |
Listing history 17 events
-
2026-06-21days on market $549,900 Active 46 DOM
-
2026-06-18days on market $549,900 Active 43 DOM
-
2026-06-17days on market $549,900 Active 42 DOM
-
2026-06-16days on market $549,900 Active 41 DOM
-
2026-06-15days on market $549,900 Active 40 DOM
-
2026-06-13statusdays on market $549,900 Active 38 DOM
-
2026-06-09days on market $549,900 Contingent - Continue to Show 34 DOM
-
2026-06-08days on market $549,900 Contingent - Continue to Show 33 DOM
-
2026-06-07statusdays on market $549,900 Contingent - Continue to Show 32 DOM
-
2026-06-04days on market $549,900 Active 29 DOM
-
2026-06-03days on market $549,900 Active 28 DOM
-
2026-06-02days on market $549,900 Active 27 DOM
-
2026-06-01days on market $549,900 Active 26 DOM
-
2026-05-31days on market $549,900 Active 25 DOM
-
2026-05-06$549,900 Active 1547-char remark
-
2004-07-15soldstatus $324,500
-
1997-09-12soldstatus $228,000
ⓘ Source: listings_history table (triggers on properties + properties_extension) + one-shot
backfill from property_details.listing_events for pre-trigger history.
Tax reassessment forecast IL · Partial reset (capped growth)
- Current annual tax
- $10,628 · $886/mo
- Projected year-2 tax
- $11,555 · $963/mo
- Expected delta
- +$928/yr (+$77/mo · 8.7%)
ⓘ Screening estimate from a state-policy table — verify with the county assessor before closing.
Climate risk First Street
- Flood 1/10 Low FEMA zone X (unshaded) · 0% chance over 30 yrs
- Wildfire 2/10 Low
- Heat 2/10 Low 7 d/yr ≥100°F today · 14 d/yr by 30 yrs out
- Wind 2/10 Low
- Air quality 3/10 Moderate 3 unhealthy d/yr today · 3 by 30 yrs out
Nearby sold comps map
Loading sold comps map…
Walkable amenities ~0.75 mi
Loading nearby amenities…
Taxation est. · year 1
- Rental income
- $45,663
- − Mortgage interest
- −$30,803
- − Property taxes
- −$10,628
- − Insurance
- −$2,750
- − Repairs & maintenance
- −$3,653
- − Management
- −$3,653
- − Depreciation
- −$15,997
- Taxable loss
- −$21,820
- Est. tax savings @ 24.0%
- +$5,237
- After-tax cash flow
- $-6,671/yr
For passive investors: Depreciation is non-cash, so a rental often shows a tax loss while cash-flowing — sheltering income. Rental losses are passive: they offset passive income freely, and up to $25,000/yr can offset ordinary (W-2) income if you actively participate and your MAGI is under $100k (phasing out to $0 by $150k); unused losses carry forward. On sale, claimed depreciation is recaptured at up to 25%, and gains may owe capital-gains tax (a 1031 exchange can defer both). Figures are a year-1 estimate at your 24.0% rate — not tax advice; consult a CPA.
Schools (NCES district)
- District
- Lake Zurich CUSD 95
- NCES district ID
- 1721900
- Math proficiency
- 47% ▼ -5.00%
- Reading proficiency
- 47% ▼ -7.00%
- Median HH income
- $114,452
- Composite
- 46.47/100
- National rank
- #2437
- State rank
- #44 of 620 in IL
Livability — Lake Zurich
- Score
- 76/100
- State rank
- #175
- US rank
- #3345
Category grades
Schools grade is shown separately in the Schools card above.
Census & demographics
- Census place
- Lake Zurich, IL
- County
- Lake County · 591,991 people
- Metro
- Chicago-Naperville-Elgin, IL-IN-WI
- Population (ZIP)
- 44,240
- Household income
- $176,081
- Rent vs Own
- Severe rent burden
- 377.0
Population outlook (Lake County) Hauer SSP2
- Today (2025)
- 700,217 people
- By 2030
- 693,290 · -1.0%
- By 2040
- 673,588 · -3.8%
- By 2050
- 643,556 · -8.1%
- By 2075
- 562,792 · -19.6%
- By 2100
- 457,715 · -34.6%
Race, ethnicity, and origin ACS 2023
- Neighborhood character
- Predominantly White (78%)
- Race & ethnicity
- White 78% Asian 12% Two or more races 6% Hispanic / Latino 6%
- Hispanic origin (detail)
- Mexican 3%
- Common ancestry
- Romanian 11% Scotch-Irish 3% Portuguese 2%
- Foreign-born
- 18% · Canada, China, South Korea
- Languages at home
- 76% English-only · Russian/Polish/Slavic 8% Spanish 5% Other Indo-European 4%
Political lean MEDSL · Lake
- 2024 margin
- Strong D (+20.8) · D 59.7% · R 38.9% · Other 1.4%
- 2008→2024 swing
- +1.1pp toward D · 2008: 19.6pp · 2024: 20.8pp
- All cycles
- 2024: D+20.8 2020: D+24.1 2016: D+20.3 2012: D+8.1 2008: D+19.6
Not yet ingested
- Civics
- —
Market trends
- HPI YoY
- ▼ -228.82%
- Current HPI
- 204.4326
- Rent YoY
- —
- Metro
- Chicago-Naperville-Elgin, IL-IN-WI
- State GDP YoY
- ▲ 1.59%
- F500 in state
- 60
Industry mix (Fortune 500 HQ in IL)
| Industry | F500 HQs | Revenue |
|---|---|---|
| Insurance | 4 | $201B |
|
||
| Consumer Goods | 4 | $87B |
|
||
| Industrial Machinery | 3 | $64B |
|
||
| Healthcare | 2 | $55B |
|
||
| Retail / Pharmacy | 1 | $148B |
|
||
| Agriculture / Food | 1 | $86B |
|
||
Price history
+141.2% since first listed5 events — show timeline
- 2026-06-11 Relisted — MRED as Distributed by MLS Grid
- 2026-06-05 Contingent — MRED as Distributed by MLS Grid
- 2026-05-06 Listed $549,900 MRED as Distributed by MLS Grid
- 2004-07-15 Sold (Public Records) $324,500 Public Records
- 1997-09-12 Sold (Public Records) $228,000 Public Records
Property tax history
+3.2%/yrLatest (2024): $10,628 · +6.9% YoY. Source: county tax records.
Cash-flow waterfall
monthlySold comps — $/sqft
last 12 mo · ≤1 miLoading sold comps…