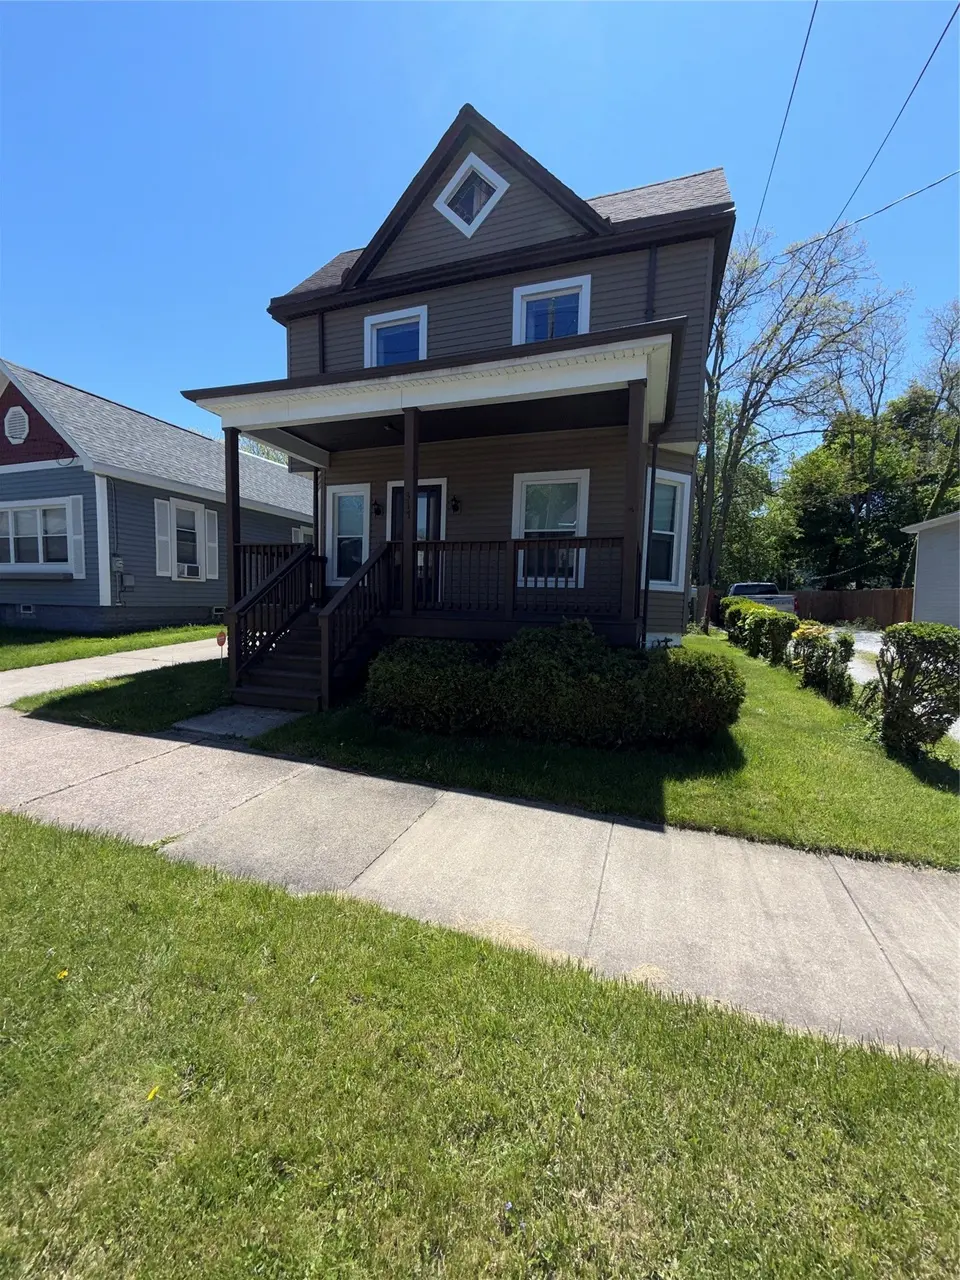
317 W 2nd St · Erie, PA
Flood risk 1/10 · Minimal
- FEMA flood zone
- X (unshaded)
- Chance of flooding over 30 yrs
- 0.0%
- Est. flood insurance / yr
- $473 – $860
Fire risk 1/10 · Minimal
- Est. fire insurance / yr
- $511 – $949
Heat risk 2/10 · Minimal
- Hot days now (above 90°F)
- 7 days/yr
- Hot days in 30 yrs
- 17 days/yr
Wind risk 1/10 · Minimal
- Chance of severe wind over 30 yrs
- —
Air-quality risk 2/10 · Minimal
- Unhealthy air days now
- 1 days/yr
- Unhealthy air days in 30 yrs
- 3 days/yr
Risk factors via First Street. Map © Google.
Why this score? — see what drove the C+ grade
The composite is a weighted blend of 9 inputs, each scored 0–100. Each bar is that input's sub-score; the figure is the points it added to the 100-point composite (weight × sub-score).
- Cash flow +26.8/30.0
- DSCR +9.2/10.0
- 1% rule +7.7/10.0
- Appreciation +7.1/10.0
- Livability +4.2/5.0
- ARV discount +3.6/15.0
- Rent growth +2.5/5.0
- Condition / age +2.5/5.0
- Schools +1.3/10.0
$129,900
🖨 Deal sheet 📄 Offer letter ✓ Due diligence
Listing remarks
Welcome home to this charming 4-bedroom, 1-bath house a few streps away from beautiful lake views. With generations of pride in ownership. This well-maintained home has been in the same family for over 60 years and is now ready for its next chapter. Recent updates include new siding, windows, roof, hot water tank, furnace, and updated electrical service, offering peace of mind for the new owner. All the heavy lifting is done, this property is the perfect opportunity to make lasting memories in a home that has been truly loved for decades.
Key facts
- New furnace
- New siding
- Lake views
Tags
Property features AI
Finance
- Other: Property type: Residential
- Financial info: No investor or income/expense details listed
- HOA & community: No HOA information listed
Exterior
- Parking: Detached or attached garage with 1 parking space
- Security: No security features listed
- Utilities: Public water; Public sewer
- Home design: Single-family residence; Two levels
- Construction: Vinyl siding; Built with common residential construction materials
- Exterior features: Asphalt roof; Lot zoned R-1; Lot dimensions approximately 41 x 165
Interior
- Kitchen: See listing for appliance details
- Bedrooms: See listing for bedroom count and levels
- Flooring: Carpet
- Bathrooms: 1 full bathroom
- Heating & cooling: Forced air heating
- Interior features: Carpet flooring; Fireplace (1)
- Laundry & utility: See listing for laundry details
Neighborhood map
What this means for you Summary
Snapshot
- This is a 3-bed/1.0-bath single-family listed at $130k.
Deal economics
- At list price, monthly cash flow is $356 ($4k/yr) — positive.
- The deal already cash-flows at list — no discount required.
- Meets the 1% rule at list price ($2k rent vs $130k).
- Cap rate 9.6% vs local median 5.2% in Erie — top-decile yield for the area; either an underpriced asset or a hidden risk that comps aren't pricing in. Stress-test before assuming the spread holds.
Location & tenants
- Location reads 83/100 on livability (#109 in PA, #840 nationally) — a professional / high-income tenant draw. Strengths: amenities A+, commute A+, cost of living A+; Watch: crime D+, employment F.
- Erie City SD (urban): math 12% / reading 19% proficiency, ranked #510 of 539 in PA (top 95%) — low school quality limits family demand, transient renter base, plan for 1-2y turnover; 81% free/reduced lunch — lower-income household profile, screen leases tightly.
- Market conditions: Rents flat; 39 active listings in the ZIP; 10 comparable units currently listed for rent nearby; rentals lingering (median 44d on market — plan ~5-8 weeks vacancy on turnover, expect pricing pressure); 100% of comp listings sitting > 30 days — soft ceiling on asking rent; lower-income renter base — watch delinquency; 364 units permitted in Erie County in 2024 (188 in 5+ unit buildings).
- At $1,655/mo this rent would consume 60% of the median local household income ($33k/yr) (locally 776% of renters already pay >50% of income on rent) — very limited rent-growth headroom before tenants either downsize or default.
Forward outlook
- In year one you build about $6k of equity ($898 loan paydown + $5k appreciation (4.2% local appreciation)).
- Erie County population projected at -14% by 2050 — secular population decline; favor cash flow + early exit over multi-decade hold.
- At projected returns (4.2% appreciation + 0.1% rent growth), your $36k cash investment doubles in ~4 years — after that, you're playing with house money.
- By year 6, paydown + projected appreciation supports a ~$34k cash-out refi (75% LTV) — recoverable capital for the next deal without selling this one.
Negotiation context
- Only 5 days on market — expect competitive offers; lowballing is unlikely to land.
- 2 sale attempts with the ask held roughly flat each time — persistent listings suggest the price (not the market) is what's stuck; bring a comps-based counter.
Risks & watch-outs
- Watch-outs: built in 1907 — expect roof / HVAC / electrical / plumbing capex.
Questions for the listing agent
- Built in 1907 — when were the roof, HVAC, electrical panel, plumbing, and water heater last replaced?
- Is there a deadline driving the sale (1031 exchange, divorce, estate, relocation)? That informs how much negotiation room exists.
- Crime grade is D in this area — have there been break-ins, vandalism, or insurance claims at this property in the last 3 years? What carrier currently insures it and at what premium?
- What's the average days-on-market for RENTAL listings here right now (not sales)? A rising rental-DOM trend means longer vacancies and softer asking-rent achievability than the comps imply.
- What's the recent tenant-quality profile in this submarket — average credit score on applications, eviction rate, late-payment / NSF rate, and stable-employment percentage? A property-management company in the area should have these aggregated.
- How much new for-sale + rental construction is in the pipeline within 1–3 miles? Heavy new supply typically softens prices + rents 12–24 months out; constrained supply supports both.
Investment metrics
- 1% rule
- 1.27% ✓
- Cap rate
- 9.58%
- Cash-on-cash
- 11.74%
- DSCR
- 1.52
- GRM
- 6.5
CMA / ARV
- ARV (on-the-fly)
- $119,658
- Comps found
- 12
Show comp detail 12 sales within ~0.75 mi
| Address | Dist | Beds/Ba | Sqft | Sold | Price | $/sf | Match |
|---|---|---|---|---|---|---|---|
| 211 Walnut St | 0.23mi | 4/1.0 (+1) | 1,628 (+5%) | 3mo | $55,000 | $34 | 74 |
| 623 W 5th St | 0.48mi | 4/1.0 (+1) | 1,560 (+0%) | 4mo | $150,000 | $96 | 69 |
| 458 W 2nd St | 0.22mi | 3/1.0 | 1,368 (-12%) | 10mo | $130,000 | $95 | 61 |
| 539 W 3rd St | 0.33mi | 4/2.0 (+1) | 1,668 (+7%) | 9mo | $82,000 | $49 | 56 |
| 917 Walnut St | 0.60mi | 3/1.0 | 1,632 (+5%) | 11mo | $105,000 | $64 | 54 |
| 418 W 9th St | 0.52mi | 4/1.5 (+1) | 1,742 (+12%) | 0mo | $265,000 | $152 | 48 |
| 910 Walnut St | 0.59mi | 4/1.0 (+1) | 1,674 (+8%) | 8mo | $105,000 | $63 | 48 |
| 905 Walnut St | 0.58mi | 3/1.5 | 1,756 (+13%) | 8mo | $135,000 | $77 | 42 |
| 641 W 3rd St | 0.47mi | 3/1.5 | 1,320 (-15%) | 18mo | $135,000 | $102 | 36 |
| 303 Liberty St | 0.58mi | 4/1.0 (+1) | 1,320 (-15%) | 13mo | $129,000 | $98 | 32 |
| 301 Holland St | 0.61mi | 4/1.0 (+1) | 1,320 (-15%) | 12mo | $55,000 | $42 | 32 |
| 920 W 4th St | 0.73mi | 4/1.0 (+1) | 1,364 (-12%) | 12mo | $58,000 | $43 | 30 |
Match score weights: distance 35% · size 25% · config 20% · recency 20%. Top-matched comps best support the ARV.
Projected returns pro-forma
4.17% appreciation · 0.1% rent growth · sell at horizon
- IRR
- 19.4%
- Equity multiple
- 2.15×
- Total profit
- $41,897
- Equity at exit
- $67,152
- IRR
- 18.3%
- Equity multiple
- 3.81×
- Total profit
- $102,281
- Equity at exit
- $110,875
Cash invested: $36,372 (down + closing). Projections, not guarantees.
Landlord ↔ Tenant lean methodology
- Overall (STATE)
- 62 Landlord-Friendly
- State Pennsylvania
- 62 Landlord-Friendly · EVEN
- County
- — inherits STATE
- City
- — inherits STATE
ZIP-level market 16507
- Home prices YoY
- 2.6%
- Rents YoY
- 0.1%
- Active inventory
- 39
- Price-to-rent
- 6.5×
Monthly cashflow live
- Estimated rent
- $1,655 high interval (Pro) →
- Mortgage (P&I)
- −$681
- Tax from tax record
- −$217 /mo · $2,599/yr
- Insurance
- −$54
- HOA
- −$0
- Vacancy / Maint / Mgmt
- −$348
- Net cashflow
- $356
Break-even live
UW: 25.0% down · 7.5% · 30yr · 1.5% tax · 5.0% vac · 8.0% maint · 8.0% mgmt
Financing live
Cash to close
- Down payment
- $32,475
- Closing costs
- $3,897
- Reserves months
- —
- Total cash needed
- —
Loan-product check · same deal, 3 products live
Conventional
25% down · 7.5% · 30yr
- Down + closing
- —
- Monthly P&I
- —
- Monthly cashflow
- —
- DSCR
- —
- Eligible?
- —
Personal DTI + credit; lowest rate.
DSCR
20% down · 8.5% · 30yr
- Down + closing
- —
- Monthly P&I
- —
- Monthly cashflow
- —
- DSCR
- —
- Eligible?
- —
No personal income docs; deal must DSCR.
Hard money
10% down · 12.0% · 12mo
- Down + closing
- —
- Monthly P&I
- —
- Monthly cashflow
- —
- DSCR
- —
- Eligible?
- —
Short-term bridge; refi at stabilization.
Rent comps 10 comps
| Address | Beds | Baths | Sqft | Rent | $/sqft | DOM | Units | Dist |
|---|---|---|---|---|---|---|---|---|
| 16 W 5th St Apt 504 Erie, PA | 2.0 | 1.5 | 1072 | $2,499 | $2.33 | 43d | 1 | 0.39mi |
| 100 Erie Insurance Pl Erie, PA | 3.0 | 1.0 | 1120 | $1,425 | $1.27 | 43d | 1 | 0.52mi |
| 538 W 8th St Unit 1 Erie, PA | 3.0 | 1.0 | 2000 | $1,650 | $0.82 | 43d | 1 | 0.55mi |
| 923 Chestnut St Unit 2 Erie, PA | 4.0 | 2.0 | 1100 | $1,150 | $1.05 | 43d | 1 | 0.58mi |
| 729 W 9th St Erie, PA | 4.0 | 2.0 | 1782 | $3,000 | $1.68 | 43d | 1 | 0.81mi |
| 223 E 9th St Erie, PA | 2.0 | 2.0 | 1564 | $1,300 | $0.83 | 43d | 1 | 0.82mi |
| 1164 W 7th St Erie, PA | 3.0 | 1.0 | 1248 | $1,600 | $1.28 | 43d | 1 | 1.16mi |
| 622 E 4th St Erie, PA | 3.0 | 1.0 | 1500 | $1,250 | $0.83 | 43d | 1 | 1.17mi |
| 1610 Poplar St Unit Downstairs Erie, PA | 3.0 | 1.0 | 1200 | $875 | $0.73 | 43d | 1 | 1.18mi |
| 1257 W 6th St Erie, PA | 2.0 | 1.0 | 1100 | $1,350 | $1.23 | 43d | 1 | 1.27mi |
Listing history 3 events
-
2026-05-21status Pending
-
2026-05-17status Active
-
2026-05-11$129,900 Active
ⓘ Source: listings_history table (triggers on properties + properties_extension) + one-shot
backfill from property_details.listing_events for pre-trigger history.
Tax reassessment forecast PA · Partial reset (capped growth)
- Current annual tax
- $2,599 · $217/mo
- Projected year-2 tax
- $2,599 · $217/mo
- Expected delta
- $0/yr ($0/mo · 0.0%)
ⓘ Screening estimate from a state-policy table — verify with the county assessor before closing.
Climate risk First Street
- Flood 1/10 Low FEMA zone X (unshaded) · 0% chance over 30 yrs
- Wildfire 1/10 Low
- Heat 2/10 Low 7 d/yr ≥90°F today · 17 d/yr by 30 yrs out
- Wind 1/10 Low
- Air quality 2/10 Low 1 unhealthy d/yr today · 3 by 30 yrs out
Nearby sold comps map
Loading sold comps map…
Walkable amenities ~0.75 mi
Loading nearby amenities…
Taxation est. · year 1
- Rental income
- $19,865
- − Mortgage interest
- −$7,276
- − Property taxes
- −$2,599
- − Insurance
- −$650
- − Repairs & maintenance
- −$1,589
- − Management
- −$1,589
- − Depreciation
- −$3,779
- Taxable income
- $2,383
- Est. tax owed @ 24.0%
- −$572
- After-tax cash flow
- $3,699/yr
For passive investors: Depreciation is non-cash, so a rental often shows a tax loss while cash-flowing — sheltering income. Rental losses are passive: they offset passive income freely, and up to $25,000/yr can offset ordinary (W-2) income if you actively participate and your MAGI is under $100k (phasing out to $0 by $150k); unused losses carry forward. On sale, claimed depreciation is recaptured at up to 25%, and gains may owe capital-gains tax (a 1031 exchange can defer both). Figures are a year-1 estimate at your 24.0% rate — not tax advice; consult a CPA.
Schools (NCES district)
- District
- Erie City SD
- NCES district ID
- 4209300
- Math proficiency
- 12% ▼ -11.00%
- Reading proficiency
- 19% ▼ -16.00%
- Median HH income
- $33,625
- Composite
- 12.59/100
- National rank
- #9617
- State rank
- #510 of 539 in PA
Livability — Erie
- Score
- 83/100
- State rank
- #109
- US rank
- #840
Category grades
Schools grade is shown separately in the Schools card above.
Census & demographics
- Census place
- Erie, PA
- County
- Erie County · 92,215 people
- City population
- 92,215
- Metro
- Erie, PA
- Population (ZIP)
- 8,597
- Household income
- $33,361
- Rent vs Own
- Severe rent burden
- 776.0
Population outlook (Erie County) Hauer SSP2
- Today (2025)
- 272,159 people
- By 2030
- 266,299 · -2.2%
- By 2040
- 250,987 · -7.8%
- By 2050
- 234,925 · -13.7%
- By 2075
- 199,164 · -26.8%
- By 2100
- 162,985 · -40.1%
Race, ethnicity, and origin ACS 2023
- Neighborhood character
- Diverse neighborhood (Simpson 0.60)
- Race & ethnicity
- White 58% Black 24% Two or more races 9% Hispanic / Latino 8% Asian 3%
- Hispanic origin (detail)
- Mexican 1% Puerto Rican 4%
- Common ancestry
- Romanian 10% Scotch-Irish 1% Lithuanian 1%
- Foreign-born
- 6% · Canada, Vietnam, China
- Languages at home
- 90% English-only · Spanish 5% Vietnamese 1% Russian/Polish/Slavic 1%
Political lean MEDSL · Erie
- 2024 margin
- Toss-up / Even · D 49.0% · R 50.0%
- 2008→2024 swing
- -20.9pp toward R · 2008: 19.9pp · 2024: -1.0pp
- All cycles
- 2024: R+1.0 2020: D+1.0 2016: R+2.0 2012: D+16.9 2008: D+19.9
Not yet ingested
- Civics
- —
Market trends
- HPI YoY
- ▲ 4.17%
- Current HPI
- 163.92
- Rent YoY
- ▲ 0.10%
- Metro
- Erie, PA
- State GDP YoY
- ▲ 1.68%
- F500 in state
- 34
Industry mix (Fortune 500 HQ in PA)
| Industry | F500 HQs | Revenue |
|---|---|---|
| Healthcare | 2 | $309B |
|
||
| Insurance | 2 | $27B |
|
||
| Telecommunications / Media | 1 | $124B |
|
||
| Industrial Distribution | 1 | $22B |
|
||
| Financial Services | 1 | $20B |
|
||
| Chemicals / Materials | 1 | $18B |
|
||
Price history
3 events — show timeline
- 2026-05-21 Pending — GEBOR
- 2026-05-17 Relisted — GEBOR
- 2026-05-11 Listed $129,900 GEBOR
Property tax history
+1.9%/yrLatest (2026): $2,599 · +3.4% YoY. Source: county tax records.
Cash-flow waterfall
monthlySold comps — $/sqft
last 12 mo · ≤1 miLoading sold comps…