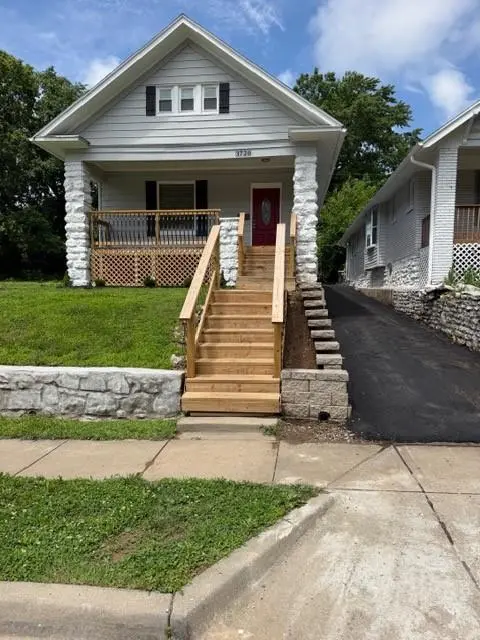
3720 Wayne Ave · Kansas City, MO
Flood risk 1/10 · Minimal
- FEMA flood zone
- X (unshaded)
- Chance of flooding over 30 yrs
- 0.0%
- Est. flood insurance / yr
- $473 – $860
Fire risk 1/10 · Minimal
- Est. fire insurance / yr
- $1,054 – $1,958
Heat risk 4/10 · Minor
- Hot days now (above 106°F)
- 7 days/yr
- Hot days in 30 yrs
- 17 days/yr
Wind risk 2/10 · Minimal
- Chance of severe wind over 30 yrs
- —
Air-quality risk 3/10 · Minor
- Unhealthy air days now
- 2 days/yr
- Unhealthy air days in 30 yrs
- 3 days/yr
Risk factors via First Street. Map © Google.
Why this score? — see what drove the F grade
The composite is a weighted blend of 9 inputs, each scored 0–100. Each bar is that input's sub-score; the figure is the points it added to the 100-point composite (weight × sub-score).
- Cash flow +14.8/30.0
- Rent growth +4.9/5.0
- DSCR +4.5/10.0
- Livability +3.9/5.0
- 1% rule +2.9/10.0
- Condition / age +2.5/5.0
- Schools +1.5/10.0
- ARV discount +0.0/15.0
- Appreciation +0.0/10.0
$205,000
🖨 Deal sheet 📄 Offer letter ✓ Due diligence
Listing remarks
Beautiful Newly Remodeled Bungalow in the Paseo Heights Neighborhood, This 3 Bedroom 2 Bath Home has great Curve Appeal and Maintence Free for years to come with Metal Siding, New HVAC, Plumbing, Electrical, Gutters and Newer Roof. The Exterior updates includes New Paint, Landscape, and Driveway Coating. The Interior offers an elegant paint color with a New Kitchen, Granite Countertops, Tile Backsplash, Sink, Faucet, Stainless Appliance, Tile Flooring in Kitchen and Bathrooms, New Tub, Shower, Vanities, Mirrors, Toilets, LED Lights/Fans, Door, Window Covering, Refinished Wood floors, Carpet, and Freshly Painted Basement. Close to Downtown, The Plaza Area, Shopping and Dining
Key facts
- New kitchen
- Metal siding
- New hvac
Tags
Property features AI
Finance
- Other: Lot approximately 8,845 square feet
- HOA & community: No association fees
Exterior
- Parking: Off-street parking
- Security: Security system; Smoke detectors
- Utilities: Public water; Public sewer
- Home design: Single-family residence; Residential property type; Bungalow style
- Construction: Metal siding; Composition roof
- Exterior features: Off-street parking; Not in a flood plain
Interior
- Kitchen: Dishwasher; Garbage disposal; Microwave; Refrigerator; Electric range; Stainless steel appliances
- Bedrooms: 3 bedrooms
- Flooring: Carpet; Tile; Wood
- Bathrooms: 2 full bathrooms
- Heating & cooling: Natural gas heating; Electric cooling (air conditioning)
- Interior features: Window coverings; Thermal windows; Bungalow floor plan; Security system; Smoke detectors; Living/Dining combo
- Laundry & utility: Laundry in basement
Neighborhood map
What this means for you Summary
Snapshot
- This is a 4-bed/1.0-bath single-family listed at $205k.
Deal economics
- At list price, monthly cash flow is $55 ($663/yr) — positive.
- The deal already cash-flows at list — no discount required.
- To meet the 1% rule (rent ≥ 1% of price), the offer needs to be $161k (21.5% below list).
- Recommended offer: $161k (21.5% below list) — sets the bar for 1% rule.
- Cap rate 6.6% vs local median 3.9% in Kansas City — top-decile yield for the area; either an underpriced asset or a hidden risk that comps aren't pricing in. Stress-test before assuming the spread holds.
Location & tenants
- Location reads 78/100 on livability (#28 in MO, #2,671 nationally) — a middle-class / working-renter tenant base. Strengths: amenities A+, commute A+, cost of living A+; Watch: crime F.
- Kansas City 33 (urban): math 12% / reading 24% proficiency, ranked #308 of 324 in MO (top 95%) — low school quality limits family demand, transient renter base, plan for 1-2y turnover; 75% free/reduced lunch — lower-income household profile, screen leases tightly.
- Zoned schools: Faxon Elementary (math 8% / reading 17%, grade F, #1,007 of 1,115 statewide, top 91%, 301 students, 99% FRL); Central High School (math 2% / reading 17%, grade F, #507 of 521 statewide, top 98%, 535 students, 99% FRL) — zoned schools average 99% FRL vs 75% district-wide (24 pts higher); higher-poverty schools than district average — tighter screening recommended.
- Market conditions: Rents rising fast (+9.5%/yr); 97 active listings in the ZIP; 40 comparable units currently listed for rent nearby; rentals at typical pace (median 24d on market — plan ~3-4 weeks tenant-placement turnaround); lower-income renter base — watch delinquency; 4,002 units permitted in Jackson County in 2024 (2,271 in 5+ unit buildings).
- At $1,610/mo this rent would consume 46% of the median local household income ($42k/yr) (locally 853% of renters already pay >50% of income on rent) — very limited rent-growth headroom before tenants either downsize or default.
Forward outlook
- Local home prices are declining (-3.0%/yr); year-one equity from $1k of loan paydown is wiped out by about $6k of value loss. Plan a longer hold.
- Jackson County population projected at +4% by 2050 — modest demand growth; plan on rents tracking national, not racing it.
Negotiation context
- It's been on market 16 days — a 2% lower offer ($202k) is reasonable based on typical stale-listing flexibility.
Risks & watch-outs
- Watch-outs: built in 1910 — expect roof / HVAC / electrical / plumbing capex.
Questions for the listing agent
- Built in 1910 — when were the roof, HVAC, electrical panel, plumbing, and water heater last replaced?
- Is there a deadline driving the sale (1031 exchange, divorce, estate, relocation)? That informs how much negotiation room exists.
- Crime grade is F in this area — have there been break-ins, vandalism, or insurance claims at this property in the last 3 years? What carrier currently insures it and at what premium?
- The area grade is low — what's the realistic commute time and amenity access for the typical tenant pool here? Any planned neighborhood developments (good or bad) we should know about?
- What's the average days-on-market for RENTAL listings here right now (not sales)? A rising rental-DOM trend means longer vacancies and softer asking-rent achievability than the comps imply.
- What's the recent tenant-quality profile in this submarket — average credit score on applications, eviction rate, late-payment / NSF rate, and stable-employment percentage? A property-management company in the area should have these aggregated.
- How much new for-sale + rental construction is in the pipeline within 1–3 miles? Heavy new supply typically softens prices + rents 12–24 months out; constrained supply supports both.
Investment metrics
- 1% rule
- 0.79% ✗
- Cap rate
- 6.62%
- Cash-on-cash
- 1.15%
- DSCR
- 1.05
- GRM
- 10.6
CMA / ARV
- ARV (on-the-fly)
- $171,054
- Comps found
- 12
Show comp detail 12 sales within ~0.75 mi
| Address | Dist | Beds/Ba | Sqft | Sold | Price | $/sf | Match |
|---|---|---|---|---|---|---|---|
| 1605 E 37th St | 0.06mi | 3/1.5 (-1) | 1,338 (-8%) | 4mo | $115,000 | $86 | 72 |
| 3509 Brooklyn Ave | 0.49mi | 4/2.0 | 1,418 (-3%) | 3mo | $130,000 | $92 | 66 |
| 3920 Paseo Blvd | 0.28mi | 4/1.5 | 1,630 (+12%) | 1mo | $190,000 | $117 | 64 |
| 2112 E 36th St | 0.42mi | 3/2.0 (-1) | 1,343 (-8%) | 2mo | $150,000 | $112 | 56 |
| 3910 Wabash Ave | 0.61mi | 4/2.0 | 1,366 (-7%) | 1mo | $10,000 | $7 | 56 |
| 3320 Tracy Ave | 0.56mi | 3/3.0 (-1) | 1,435 (-2%) | 4mo | $260,000 | $181 | 55 |
| 3337 Flora Ave | 0.46mi | 3/2.0 (-1) | 1,600 (+9%) | 2mo | $178,900 | $112 | 52 |
| 3431 Wabash Ave | 0.69mi | 3/1.5 (-1) | 1,533 (+5%) | 3mo | $214,900 | $140 | 50 |
| 3915 Charlotte St | 0.58mi | 3/1.5 (-1) | 1,624 (+11%) | 3mo | $338,000 | $208 | 45 |
| 4239 Tracy Ave | 0.69mi | 3/2.5 (-1) | 1,602 (+10%) | 1mo | $425,000 | $265 | 40 |
| 4030 Charlotte St | 0.69mi | 3/2.0 (-1) | 1,296 (-11%) | 2mo | $250,000 | $193 | 38 |
| 4102 Charlotte St | 0.72mi | 3/2.5 (-1) | 1,622 (+11%) | 1mo | $189,000 | $117 | 37 |
Match score weights: distance 35% · size 25% · config 20% · recency 20%. Top-matched comps best support the ARV.
Projected returns pro-forma
-3.0% appreciation · 8.0% rent growth · sell at horizon
- IRR
- -9.7%
- Equity multiple
- 0.63×
- Total profit
- $-21,291
- Equity at exit
- $30,566
- IRR
- 4.8%
- Equity multiple
- 1.42×
- Total profit
- $24,315
- Equity at exit
- $17,725
Cash invested: $57,400 (down + closing). Projections, not guarantees.
Landlord ↔ Tenant lean methodology
- Overall (STATE)
- 81 Strongly Landlord-Friendly
- State Missouri
- 81 Strongly Landlord-Friendly · R+10
- County
- — inherits STATE
- City
- — inherits STATE
ZIP-level market 64109
- Rents YoY
- 9.5%
- Active inventory
- 97
- Price-to-rent
- 10.6×
Monthly cashflow live
- Estimated rent
- $1,610 high interval (Pro) →
- Mortgage (P&I)
- −$1,075
- Tax from tax record
- −$56 /mo · $674/yr
- Insurance
- −$85
- HOA
- −$0
- Vacancy / Maint / Mgmt
- −$338
- Net cashflow
- $55
Break-even live
UW: 25.0% down · 7.5% · 30yr · 1.5% tax · 5.0% vac · 8.0% maint · 8.0% mgmt
Financing live
Cash to close
- Down payment
- $51,250
- Closing costs
- $6,150
- Reserves months
- —
- Total cash needed
- —
Loan-product check · same deal, 3 products live
Conventional
25% down · 7.5% · 30yr
- Down + closing
- —
- Monthly P&I
- —
- Monthly cashflow
- —
- DSCR
- —
- Eligible?
- —
Personal DTI + credit; lowest rate.
DSCR
20% down · 8.5% · 30yr
- Down + closing
- —
- Monthly P&I
- —
- Monthly cashflow
- —
- DSCR
- —
- Eligible?
- —
No personal income docs; deal must DSCR.
Hard money
10% down · 12.0% · 12mo
- Down + closing
- —
- Monthly P&I
- —
- Monthly cashflow
- —
- DSCR
- —
- Eligible?
- —
Short-term bridge; refi at stabilization.
Rent comps 40 comps
| Address | Beds | Baths | Sqft | Rent | $/sqft | DOM | Units | Dist |
|---|---|---|---|---|---|---|---|---|
| 3609 Wayne Ave Kansas City, MO | 3.0 | 1.5 | 1118 | $1,900 | $1.70 | 23d | 1 | 0.13mi |
| 2002 E 35th St Kansas City, MO | 3.0 | 2.0 | 1426 | $1,295 | $0.91 | 7d | 1 | 0.40mi |
| 2018 E 35th St Kansas City, MO | 3.0 | 2.0 | 1502 | $1,800 | $1.20 | 2d | 1 | 0.42mi |
| 3314 Tracy Ave Unit B Kansas City, MO | 3.0 | 1.0 | 1100 | $947 | $0.86 | 21d | 1 | 0.56mi |
| 3314 Tracy Ave Kansas City, MO | 3.0 | 1.0 | 1100 | $947 | $0.86 | 7d | 1 | 0.56mi |
| 4014 Park Ave Kansas City, MO | 3.0 | 2.0 | 1271 | $1,273 | $1.00 | 43d | 1 | 0.57mi |
| 3902 Wabash Ave Kansas City, MO | 4.0 | 2.0 | 1400 | $1,850 | $1.32 | 43d | 1 | 0.60mi |
| 4112 Park Ave Kansas City, MO | 4.0 | 2.0 | 1700 | $1,800 | $1.06 | 14d | 1 | 0.66mi |
| 4228 Virginia Ave Kansas City, MO | 3.0 | 1.0 | 1200 | $1,250 | $1.04 | 10d | 1 | 0.69mi |
| 4232 Virginia Ave Unit 3 Kansas City, MO | 3.0 | 1.0 | 1296 | $1,100 | $0.85 | 12d | 1 | 0.70mi |
| 4219 Woodland Ave Kansas City, MO | 4.0 | 2.0 | 1566 | $1,900 | $1.21 | 1d | 1 | 0.70mi |
| 4107 Olive St Kansas City, MO | 3.0 | 1.5 | 1271 | $1,578 | $1.24 | 7d | 1 | 0.71mi |
| 2120 Linwood Blvd Kansas City, MO | 3.0 | 1.0 | 1326 | $1,400 | $1.06 | 43d | 1 | 0.76mi |
| 4220 Harrison St Unit 1S Kansas City, MO | 3.0 | 2.0 | 1200 | $1,795 | $1.50 | 7d | 1 | 0.79mi |
| 520 E Armour Blvd Kansas City, MO | 3.0 | 1.0–2.0 | 882 | $2,630 | $2.98 | 1d | 22 | 0.83mi |
| 520 E Armour Blvd Kansas City, MO | 3.0 | 1.0–2.0 | 782 | $1,970 | $2.52 | 16d | 19 | 0.83mi |
| 3817 S Benton Ave Kansas City, MO | 4.0 | 1.5 | 1380 | $1,650 | $1.20 | 23d | 1 | 0.83mi |
| 3630 Agnes Ave Kansas City, MO | 3.0 | 2.0 | 1448 | $1,500 | $1.04 | 10d | 1 | 0.86mi |
| 3333 Gillham Rd Kansas City, MO | 4.0 | 2.0 | 1500 | $2,000 | $1.33 | 14d | 1 | 0.87mi |
| 3009 Garfield Ave Kansas City, MO | 3.0 | 1.5 | 1334 | $1,425 | $1.07 | 43d | 1 | 0.93mi |
| 3840 Bellefontaine Ave Kansas City, MO | 3.0 | 1.0 | 1500 | $1,500 | $1.00 | 16d | 1 | 0.94mi |
| 3524 Bellefontaine Ave Kansas City, MO | 3.0 | 1.0 | 1228 | $1,350 | $1.10 | 43d | 1 | 0.94mi |
| 3346 Agnes Ave Kansas City, MO | 3.0 | 1.0 | 1400 | $1,200 | $0.86 | 7d | 1 | 0.94mi |
| 404 E 41st St Kansas City, MO | 4.0 | 3.0 | 1711 | $2,650 | $1.55 | 19d | 1 | 0.96mi |
| 3330 Agnes Ave Kansas City, MO | 3.0 | 1.0 | 1000 | $1,410 | $1.41 | 43d | 1 | 0.96mi |
| 4119 S Benton Ave Kansas City, MO | 4.0 | 2.0 | 1700 | $1,800 | $1.06 | 43d | 1 | 0.98mi |
| 3304 Agnes Ave Unit Downstairs Kansas City, MO | 3.0 | 1.0 | 1150 | $1,095 | $0.95 | 43d | 1 | 0.99mi |
| 4138 Locust St Kansas City, MO | 4.0 | 2.0 | 1763 | $2,600 | $1.47 | 7d | 1 | 1.00mi |
| 3830 Warwick Blvd Unit 1S Kansas City, MO | 3.0 | 2.0 | 1500 | $1,600 | $1.07 | 14d | 1 | 1.03mi |
| 4116 Bellefontaine Ave Kansas City, MO | 3.0 | 1.0 | 1234 | $1,000 | $0.81 | 23d | 1 | 1.05mi |
| 1500 E 46th St Kansas City, MO | 1.0–3.0 | 1.0 | 803 | $1,275 | $1.59 | 43d | 1 | 1.09mi |
| 3818 Indiana Ave Kansas City, MO | 3.0 | 1.5 | 1223 | $1,147 | $0.94 | 43d | 1 | 1.11mi |
| 3419 College Ave Kansas City, MO | 4.0 | 1.0 | 1608 | $1,300 | $0.81 | 1d | 1 | 1.13mi |
| 4610 Forest Ave Kansas City, MO | 3.0 | 2.0 | 1365 | $2,450 | $1.79 | 43d | 1 | 1.17mi |
| 4144 College Ave Kansas City, MO | 3.0 | 1.0 | 1108 | $1,095 | $0.99 | 23d | 1 | 1.19mi |
| 3739 Bales Ave Kansas City, MO | 3.0 | 2.0 | 1400 | $1,575 | $1.12 | 23d | 1 | 1.20mi |
| 2729 Grove St Kansas City, MO | 3.0 | 2.0 | 1510 | $1,375 | $0.91 | 43d | 1 | 1.20mi |
| 3205 E 31st St Kansas City, MO | 4.0 | 1.0 | 1800 | $1,325 | $0.74 | 23d | 1 | 1.26mi |
| 2724 Brooklyn Ave Kansas City, MO | 3.0 | 2.5 | 1398 | $1,440 | $1.03 | 23d | 1 | 1.26mi |
| 118 W Armour Blvd Kansas City, MO | 1.0–3.0 | 1.0–2.0 | 934 | $2,095 | $2.24 | 23d | 7 | 1.27mi |
Listing history 12 events
-
2026-06-18days on market $205,000 Active 16 DOM
-
2026-06-17days on market $205,000 Active 15 DOM
-
2026-06-16days on market $205,000 Active 14 DOM
-
2026-06-15days on market $205,000 Active 13 DOM
-
2026-06-13days on market $205,000 Active 11 DOM
-
2026-06-09days on market $205,000 Active 7 DOM
-
2026-06-08days on market $205,000 Active 6 DOM
-
2026-06-07days on market $205,000 Active 5 DOM
-
2026-06-05days on market $205,000 Active 2 DOM
-
2026-06-03remarks 683-char remark
-
2026-06-02remarks 677-char remark
-
2026-06-02$205,000 Active 1 DOM
ⓘ Source: listings_history table (triggers on properties + properties_extension) + one-shot
backfill from property_details.listing_events for pre-trigger history.
Tax reassessment forecast MO · Resets to sale price
- Current annual tax
- $674 · $56/mo
- Projected year-2 tax
- $1,988 · $166/mo
- Expected delta
- +$1,314/yr (+$110/mo · 194.8%)
ⓘ Screening estimate from a state-policy table — verify with the county assessor before closing.
Climate risk First Street
- Flood 1/10 Low FEMA zone X (unshaded) · 0% chance over 30 yrs
- Wildfire 1/10 Low
- Heat 4/10 Moderate 7 d/yr ≥106°F today · 17 d/yr by 30 yrs out
- Wind 2/10 Low
- Air quality 3/10 Moderate 2 unhealthy d/yr today · 3 by 30 yrs out
Nearby sold comps map
Loading sold comps map…
Walkable amenities ~0.75 mi
Loading nearby amenities…
Taxation est. · year 1
- Rental income
- $19,320
- − Mortgage interest
- −$11,483
- − Property taxes
- −$674
- − Insurance
- −$1,025
- − Repairs & maintenance
- −$1,546
- − Management
- −$1,546
- − Depreciation
- −$5,964
- Taxable loss
- −$2,918
- Est. tax savings @ 24.0%
- +$700
- After-tax cash flow
- $1,363/yr
For passive investors: Depreciation is non-cash, so a rental often shows a tax loss while cash-flowing — sheltering income. Rental losses are passive: they offset passive income freely, and up to $25,000/yr can offset ordinary (W-2) income if you actively participate and your MAGI is under $100k (phasing out to $0 by $150k); unused losses carry forward. On sale, claimed depreciation is recaptured at up to 25%, and gains may owe capital-gains tax (a 1031 exchange can defer both). Figures are a year-1 estimate at your 24.0% rate — not tax advice; consult a CPA.
Schools (NCES district)
- District
- Kansas City 33
- NCES district ID
- 2916400
- Math proficiency
- 12% ▼ -8.00%
- Reading proficiency
- 24% ▬ 0.00%
- Median HH income
- $35,227
- Composite
- 14.8/100
- National rank
- #9387
- State rank
- #308 of 324 in MO
Livability — Kansas City
- Score
- 78/100
- State rank
- #28
- US rank
- #2671
Category grades
Schools grade is shown separately in the Schools card above.
Census & demographics
- Census place
- Kansas City, MO
- County
- Jackson County · 687,798 people
- City population
- 439,467
- Metro
- Kansas City, MO-KS
- Population (ZIP)
- 10,043
- Household income
- $41,943
- Rent vs Own
- Severe rent burden
- 853.0
Population outlook (Jackson County) Hauer SSP2
- Today (2025)
- 719,589 people
- By 2030
- 731,456 · +1.6%
- By 2040
- 746,689 · +3.8%
- By 2050
- 749,289 · +4.1%
- By 2075
- 736,227 · +2.3%
- By 2100
- 668,210 · -7.1%
Race, ethnicity, and origin ACS 2023
- Neighborhood character
- Diverse neighborhood (Simpson 0.64)
- Race & ethnicity
- Black 45% White 39% Hispanic / Latino 9% Two or more races 4% Asian 2%
- Hispanic origin (detail)
- Mexican 7%
- Common ancestry
- Slovak 1% Romanian 1% Lithuanian 1%
- Foreign-born
- 7% · Canada, Philippines, China
- Languages at home
- 88% English-only · Spanish 5% Other Asian/Pacific 3% Arabic 1%
Political lean MEDSL · Jackson
- 2024 margin
- D (+19.3) · D 58.9% · R 39.5% · Other 1.6%
- 2008→2024 swing
- -6.1pp toward R · 2008: 25.4pp · 2024: 19.3pp
- All cycles
- 2024: D+19.3 2020: D+22.0 2016: D+16.6 2012: D+19.0 2008: D+25.4
Not yet ingested
- Civics
- —
Market trends
- HPI YoY
- ▼ -275.12%
- Current HPI
- 243.6094
- Rent YoY
- ▲ 9.50%
- Metro
- Kansas City, MO-KS
- State GDP YoY
- ▲ 1.84%
- F500 in state
- 20
Industry mix (Fortune 500 HQ in MO)
| Industry | F500 HQs | Revenue |
|---|---|---|
| Healthcare | 1 | $163B |
|
||
| Insurance | 1 | $21B |
|
||
| Industrial Technology | 1 | $17B |
|
||
| Retail | 1 | $16B |
|
||
| Industrial Distribution | 1 | $10B |
|
||
| Utilities | 1 | $9B |
|
||
Price history
3 events — show timeline
- 2026-06-02 Listed $205,000 Heartland MLS as Distributed by MLS Grid
- 2026-01-29 Sold (Public Records) — Public Records
- 1990-02-22 Sold (Public Records) — Public Records
Property tax history
+12.2%/yrLatest (2025): $674 · -35.3% YoY. Source: county tax records.
Cash-flow waterfall
monthlySold comps — $/sqft
last 12 mo · ≤1 miLoading sold comps…