27 Crestwood Dr #80 · Middletown, IN
Flood risk 1/10 · Minimal
- FEMA flood zone
- X (unshaded)
- Chance of flooding over 30 yrs
- 0.0%
- Est. flood insurance / yr
- $507 – $1,088
Fire risk 1/10 · Minimal
- Est. fire insurance / yr
- $717 – $1,331
Heat risk 3/10 · Minor
- Hot days now (above 99°F)
- 7 days/yr
- Hot days in 30 yrs
- 18 days/yr
Wind risk 2/10 · Minimal
- Chance of severe wind over 30 yrs
- 1.0%
Air-quality risk 3/10 · Minor
- Unhealthy air days now
- 2 days/yr
- Unhealthy air days in 30 yrs
- 4 days/yr
Risk factors via First Street. Map © Google.
Why this score? — see what drove the B grade
The composite is a weighted blend of 9 inputs, each scored 0–100. Each bar is that input's sub-score; the figure is the points it added to the 100-point composite (weight × sub-score).
- Cash flow +30.0/30.0
- 1% rule +10.0/10.0
- DSCR +10.0/10.0
- ARV discount +7.5/15.0
- Condition / age +4.0/5.0
- Schools +3.6/10.0
- Livability +3.4/5.0
- Rent growth +2.5/5.0
- Appreciation +0.0/10.0
$68,999
🖨 Deal sheet (PDF) 📄 Offer letter ✓ Due diligence
Key facts
- Built 2026
- Listed 15 days
Property features AI
Finance
- Financial info: List price $68,999
Exterior
- Home design: Spec home (Plan: Cornerstone 66); Address: 27 Crestwood Dr #80, Middletown, IN 47356
- Construction: 1,056 living area (square footage provided)
- Exterior features: Shake roof
Interior
- Bedrooms: 3 bedrooms
- Bathrooms: 2 full bathrooms
- Heating & cooling: Natural gas forced air heating; Central air conditioning
- Interior features: Active listing (Standard status: Active)
Neighborhood map
What this means for you Summary
Snapshot
- This is a 3-bed/2.0-bath single-family listed at $69k. Condition is rated good.
Deal economics
- At list price, monthly cash flow is $440 ($5k/yr) — positive.
- The deal already cash-flows at list — no discount required.
- Meets the 1% rule at list price ($1k rent vs $69k).
- Recommended offer: $68k (1.5% below list) — sets the bar for market timing.
- Cap rate 13.9% vs local median 5.0% in Middletown — top-decile yield for the area; either an underpriced asset or a hidden risk that comps aren't pricing in. Stress-test before assuming the spread holds.
Location & tenants
- Location reads 67/100 on livability (#235 in IN) — a middle-class / working-renter tenant base. Strengths: crime A+, cost of living A+, housing A+; Watch: schools C-, amenities F, commute F.
- Shenandoah School Corporation (rural): math 38% / reading 46% proficiency, ranked #118 of 301 in IN (top 39%) — families likely to look elsewhere, expect single-tenant / working-renter base with shorter leases.
- Market conditions: 36 active listings in the ZIP; 1 comparable units currently listed for rent nearby; 47 units permitted in Henry County in 2024 (0 in 5+ unit buildings).
Forward outlook
- Local home prices are declining (-3.0%/yr); year-one equity from $477 of loan paydown is wiped out by about $2k of value loss. Plan a longer hold.
- Henry County population projected at -12% by 2050 — secular population decline; favor cash flow + early exit over multi-decade hold.
- At projected returns (-3.0% appreciation + 3.0% rent growth), your $19k cash investment doubles in ~5 years — after that, you're playing with house money.
Negotiation context
- It's been on market 16 days — a 2% lower offer ($68k) is reasonable based on typical stale-listing flexibility.
Questions for the listing agent
- Is there a deadline driving the sale (1031 exchange, divorce, estate, relocation)? That informs how much negotiation room exists.
- What's the average days-on-market for RENTAL listings here right now (not sales)? A rising rental-DOM trend means longer vacancies and softer asking-rent achievability than the comps imply.
- What's the recent tenant-quality profile in this submarket — average credit score on applications, eviction rate, late-payment / NSF rate, and stable-employment percentage? A property-management company in the area should have these aggregated.
- How much new for-sale + rental construction is in the pipeline within 1–3 miles? Heavy new supply typically softens prices + rents 12–24 months out; constrained supply supports both.
Investment metrics
- 1% rule
- 1.68% ✓
- Cap rate
- 13.94%
- Cash-on-cash
- 27.30%
- DSCR
- 2.21
- GRM
- 5.0
CMA / ARV
- ARV (on-the-fly)
- $179,520
- Comps found
- 8
Show comp detail 8 sales within ~0.75 mi
| Address | Dist | Beds/Ba | Sqft | Sold | Price | $/sf | Match |
|---|---|---|---|---|---|---|---|
| 9393 N County Road 800 W | 0.15mi | 3/1.0 | 975 (-8%) | 13mo | $210,000 | $215 | 65 |
| 8525 W State Road 236 | 0.47mi | 3/1.0 | 1,025 (-3%) | 7mo | $196,500 | $192 | 64 |
| 1213 W Mill St | 0.43mi | 3/1.0 | 1,107 (+5%) | 8mo | $195,000 | $176 | 62 |
| 511 Maple St | 0.47mi | 3/1.0 | 1,104 (+4%) | 6mo | $90,000 | $82 | 61 |
| 902 Progress St | 0.51mi | 3/2.0 | 1,195 (+13%) | 1mo | $154,000 | $129 | 54 |
| 511 N 10th St | 0.45mi | 3/1.0 | 1,118 (+6%) | 20mo | $190,000 | $170 | 48 |
| 930 Progress St | 0.51mi | 3/1.0 | 988 (-6%) | 16mo | $135,000 | $137 | 48 |
| 510 N 12th St | 0.50mi | 3/1.5 | 1,131 (+7%) | 18mo | $191,500 | $169 | 48 |
Match score weights: distance 35% · size 25% · config 20% · recency 20%. Top-matched comps best support the ARV.
Projected returns pro-forma
-3.0% appreciation · 3.0% rent growth · sell at horizon
- IRR
- 21.3%
- Equity multiple
- 1.87×
- Total profit
- $16,833
- Equity at exit
- $10,288
- IRR
- 29.4%
- Equity multiple
- 3.63×
- Total profit
- $50,778
- Equity at exit
- $5,966
Cash invested: $19,320 (down + closing). Projections, not guarantees.
Landlord ↔ Tenant lean methodology
- Overall (STATE)
- 90 Strongly Landlord-Friendly
- State Indiana
- 90 Strongly Landlord-Friendly · R+11
- County
- — inherits STATE
- City
- — inherits STATE
ZIP-level market 47356
- Home prices YoY
- -18.9%
- Active inventory
- 36
- Price-to-rent
- 5.0×
Monthly cashflow live
- Estimated rent
- $1,160 medium interval (Pro) →
- Mortgage (P&I)
- −$362
- Tax est. 1.5%
- −$86 /mo · $1,035/yr
- Insurance
- −$29
- HOA
- −$0
- Vacancy / Maint / Mgmt
- −$244
- Net cashflow
- $440
Break-even live
Sensitivity live
| Price | -10% $487 | -5% $463 | +0% $440 | +5% $416 | +10% $392 |
|---|---|---|---|---|---|
| Rent | -10% $348 | -5% $394 | +0% $440 | +5% $485 | +10% $531 |
| Rate | -1.0pp $474 | -0.5pp $457 | base $440 | +0.5pp $422 | +1.0pp $403 |
UW: 25.0% down · 7.5% · 30yr · 1.5% tax · 5.0% vac · 8.0% maint · 8.0% mgmt
Financing live
Cash to close
- Down payment
- $17,250
- Closing costs
- $2,070
- Reserves months
- —
- Total cash needed
- —
Loan-product check · same deal, 3 products live
Conventional
25% down · 7.5% · 30yr
- Down + closing
- —
- Monthly P&I
- —
- Monthly cashflow
- —
- DSCR
- —
- Eligible?
- —
Personal DTI + credit; lowest rate.
DSCR
20% down · 8.5% · 30yr
- Down + closing
- —
- Monthly P&I
- —
- Monthly cashflow
- —
- DSCR
- —
- Eligible?
- —
No personal income docs; deal must DSCR.
Hard money
10% down · 12.0% · 12mo
- Down + closing
- —
- Monthly P&I
- —
- Monthly cashflow
- —
- DSCR
- —
- Eligible?
- —
Short-term bridge; refi at stabilization.
Rent comps 1 comps
| Address | Beds | Baths | Sqft | Rent | $/sqft | DOM | Units | Dist |
|---|---|---|---|---|---|---|---|---|
| 5 S Crestwood Dr Middletown, IN | 3.0 | 2.0 | 1216 | $1,160 | $0.95 | 0d | 1 | 0.15mi |
Listing history 11 events
-
2026-06-21days on market $68,999 Active 16 DOM
-
2026-06-19days on market $68,999 Active 14 DOM
-
2026-06-18days on market $68,999 Active 13 DOM
-
2026-06-17days on market $68,999 Active 12 DOM
-
2026-06-16days on market $68,999 Active 11 DOM
-
2026-06-15days on market $68,999 Active 10 DOM
-
2026-06-14days on market $68,999 Active 8 DOM
-
2026-06-12days on market $68,999 Active 7 DOM
-
2026-06-09days on market $68,999 Active 4 DOM
-
2026-06-08days on market $68,999 Active 3 DOM
-
2026-06-07$68,999 Active 2 DOM
ⓘ Source: listings_history table (triggers on properties + properties_extension) + one-shot
backfill from property_details.listing_events for pre-trigger history.
Climate risk First Street
- Flood 1/10 Low FEMA zone X (unshaded) · 0% chance over 30 yrs
- Wildfire 1/10 Low
- Heat 3/10 Moderate 7 d/yr ≥99°F today · 18 d/yr by 30 yrs out
- Wind 2/10 Low 100% chance of damaging wind over 30 yrs
- Air quality 3/10 Moderate 2 unhealthy d/yr today · 4 by 30 yrs out
Nearby sold comps map
Loading sold comps map…
Walkable amenities ~0.75 mi
Loading nearby amenities…
Taxation est. · year 1
- Rental income
- $13,920
- − Mortgage interest
- −$3,865
- − Property taxes
- −$1,035
- − Insurance
- −$345
- − Repairs & maintenance
- −$1,114
- − Management
- −$1,114
- − Depreciation
- −$2,007
- Taxable income
- $4,441
- Est. tax owed @ 24.0%
- −$1,066
- After-tax cash flow
- $4,209/yr
For passive investors: Depreciation is non-cash, so a rental often shows a tax loss while cash-flowing — sheltering income. Rental losses are passive: they offset passive income freely, and up to $25,000/yr can offset ordinary (W-2) income if you actively participate and your MAGI is under $100k (phasing out to $0 by $150k); unused losses carry forward. On sale, claimed depreciation is recaptured at up to 25%, and gains may owe capital-gains tax (a 1031 exchange can defer both). Figures are a year-1 estimate at your 24.0% rate — not tax advice; consult a CPA.
Condition & rehab AI · 12 photos
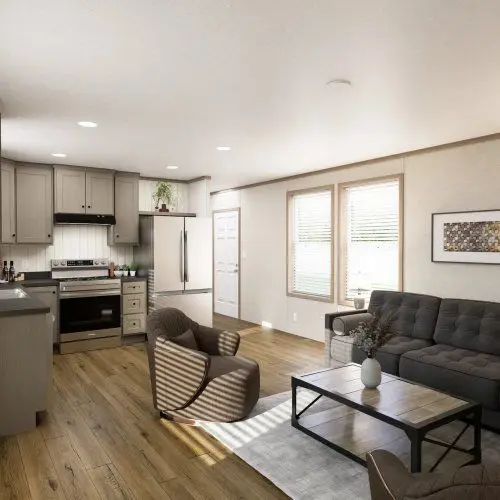
This home is in excellent condition with modern finishes and a good curb appeal. It is move-in ready and would benefit from some exterior painting and landscaping to further enhance its value.
Value-add opportunities
- Both Painting exterior siding — Enhances curb appeal and value
- Both Landscaping improvements — Enhances curb appeal and value
- Both New flooring in bathrooms — Improves aesthetics and functionality
- Both New kitchen appliances — Enhances functionality and appeal
Renovation cost estimate screening
Value-add ROI direction
- Both Painting exterior siding — Enhances curb appeal and value ↑
- Both Landscaping improvements — Enhances curb appeal and value ↑
- Both New flooring in bathrooms — Improves aesthetics and functionality ↑
- Both New kitchen appliances — Enhances functionality and appeal ↑
ⓘ Cost ranges are severity-bucket heuristics (US national rule-of-thumb). Get contractor quotes + a written scope before underwriting a rehab budget.
Schools (NCES district)
- District
- Shenandoah School Corporation
- NCES district ID
- 1808280
- Math proficiency
- 38% ▼ -15.00%
- Reading proficiency
- 46% ▼ -9.00%
- Median HH income
- $50,961
- Composite
- 36.22/100
- National rank
- #4723
- State rank
- #118 of 301 in IN
Livability — Middletown
- Score
- 67/100
- State rank
- #235
- US rank
- #10188
Category grades
Schools grade is shown separately in the Schools card above.
Census & demographics
- Census place
- Middletown, IN
- Population (ZIP)
- 5,508
Population outlook (Henry County) Hauer SSP2
- Today (2025)
- 48,028 people
- By 2030
- 47,125 · -1.9%
- By 2040
- 44,820 · -6.7%
- By 2050
- 42,207 · -12.1%
- By 2075
- 35,814 · -25.4%
- By 2100
- 26,779 · -44.2%
Race, ethnicity, and origin ACS 2023
- Neighborhood character
- Predominantly White (90%)
- Race & ethnicity
- White 90% Two or more races 5% Hispanic / Latino 3% Black 2%
- Common ancestry
- Serbian 3% Iranian 2% Slovak 2%
- Foreign-born
- 2%
- Languages at home
- 99% English-only · Spanish 1%
Political lean MEDSL · Henry
- 2024 margin
- Solid R (+47.7) · D 25.3% · R 73.0% · Other 1.7%
- 2008→2024 swing
- -43.8pp toward R · 2008: -3.9pp · 2024: -47.7pp
- All cycles
- 2024: R+47.7 2020: R+45.2 2016: R+43.7 2012: R+17.0 2008: R+3.9
Not yet ingested
- Civics
- —
Market trends
- HPI YoY
- ▼ -55.87%
- Current HPI
- 240.0691
- Rent YoY
- —
- Metro
- —
- State GDP YoY
- ▲ 2.90%
- F500 in state
- 18
Industry mix (Fortune 500 HQ in IN)
| Industry | F500 HQs | Revenue |
|---|---|---|
| Industrial Machinery | 2 | $37B |
|
||
| Healthcare | 1 | $177B |
|
||
| Pharmaceuticals | 1 | $45B |
|
||
| Metals / Steel | 1 | $18B |
|
||
| Agriculture | 1 | $17B |
|
||
| Packaging | 1 | $12B |
|
||
Cash-flow waterfall
monthlySold comps — $/sqft
last 12 mo · ≤1 miLoading sold comps…