 Multi-family
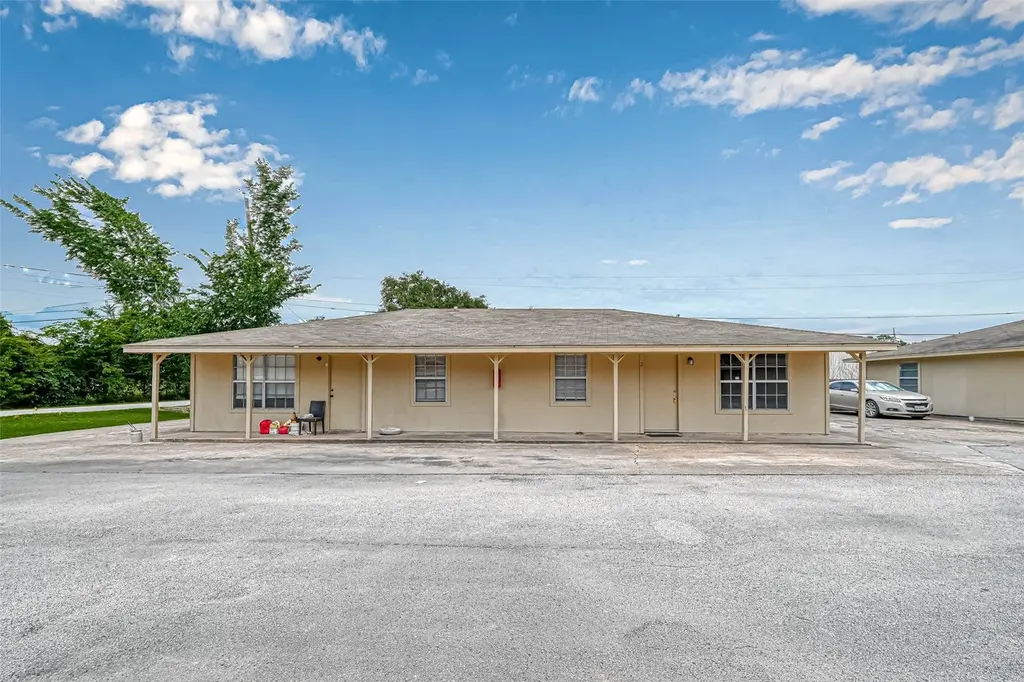
8430 Round Rock Dr #8 · Houston, TX
Flood risk 8/10 · Major
- FEMA flood zone
- X (unshaded)
- Chance of flooding over 30 yrs
- 0.99%
- Est. flood insurance / yr
- $507 – $1,088
Fire risk 3/10 · Minor
- Est. fire insurance / yr
- $1,222 – $2,270
Heat risk 9/10 · Severe
- Hot days now (above 109°F)
- 7 days/yr
- Hot days in 30 yrs
- 24 days/yr
Wind risk 9/10 · Severe
- Chance of severe wind over 30 yrs
- 99.0%
Air-quality risk 2/10 · Minimal
- Unhealthy air days now
- 2 days/yr
- Unhealthy air days in 30 yrs
- 2 days/yr
Risk factors via First Street. Map © Google.
Why this score? — see what drove the B grade
The composite is a weighted blend of 9 inputs, each scored 0–100. Each bar is that input's sub-score; the figure is the points it added to the 100-point composite (weight × sub-score).
- Cash flow +30.0/30.0
- 1% rule +10.0/10.0
- DSCR +10.0/10.0
- ARV discount +7.5/15.0
- Appreciation +4.4/10.0
- Livability +3.7/5.0
- Condition / age +2.5/5.0
- Schools +2.0/10.0
- Rent growth +1.7/5.0
$875,000
🖨 Deal sheet (PDF) 📄 Offer letter ✓ Due diligence
Multi-family units
County records classify this as Multi-Family (5+ Unit). Listing-text estimate: 1 unit. estimate disagrees with records
5+ unit building — per-unit beds/baths from public records are typically unavailable; the breakdown below (if shown) is an estimate from the listing text.
Listing remarks
100% occupied income-producing 8-unit multifamily for a serious, qualified buyer. Property consists of 8 units, each 2 bed / 1 bath, with long-term tenants in place. Priced at a 1.14% rent-to-price ratio based on existing rents, not projections. Relatively newer roofs, new HVAC, and updated interiors. Current upside includes potential rent increases, pet fees, onsite laundry income, and implementing RUBS for water since units are not separately metered. Monthly expenses: $400 water, $490 trash, $200 landscaping, $100 pest control, $1,148 insurance. No HOA, no deed restrictions, and no short-term rental restrictions. Showings only with proof of funds and an acceptable offer. Please do not di
Key facts
- No deed restriction
- New hvac
- Updated interior
Tags
Property features AI
Finance
- Financial info: Property contains 8 total units
Exterior
- Utilities: Cable available; Electricity available; Natural gas available; Water available
- Home design: Residential income property; Single building containing multiple units
- Construction: Built in 1957; Vinyl siding; Wood siding; Composition roof
- Exterior features: Private entrances; Near public transit; Other lot features
Interior
- Kitchen: Microwave; Refrigerator
- Bedrooms: Unit type example: 2 bedrooms (one unit type listed); property contains 8 units total
- Flooring: Laminate flooring; Tile flooring; Vinyl flooring
- Heating & cooling: Central heating (electric); Central air (electric)
- Interior features: Ceiling fans; Programmable thermostat; Insulated doors; Satellite dish; Wheelchair access
Neighborhood map
What this means for you Summary
Snapshot
- This is a 16-bed/?-bath multifamily listed at $875k.
Deal economics
- At list price, monthly cash flow is $5k ($55k/yr) — positive.
- The deal already cash-flows at list — no discount required.
- Meets the 1% rule at list price ($13k rent vs $875k).
- Recommended offer: $849k (3.0% below list) — sets the bar for market timing.
- Cap rate 12.6% vs local median 3.1% in Houston — top-decile yield for the area; either an underpriced asset or a hidden risk that comps aren't pricing in. Stress-test before assuming the spread holds.
Location & tenants
- Location reads 74/100 on livability (#184 in TX, #4,771 nationally) — a middle-class / working-renter tenant base. Strengths: amenities A+, cost of living A+, housing A+; Watch: crime F.
- Sheldon ISD (suburban): math 19% / reading 25% proficiency, ranked #746 of 826 in TX (top 90%) — low school quality limits family demand, transient renter base, plan for 1-2y turnover; 72% free/reduced lunch — lower-income household profile, screen leases tightly.
- Zoned schools: Sheldon Lake El (math 30% / reading 27%, grade F, #2,706 of 4,322 statewide, top 63%, 665 students, 86% FRL); C E King Middle (math 13% / reading 24%, grade F, #1,478 of 1,662 statewide, top 90%, 1,311 students, 90% FRL); C E King H S (math 19% / reading 30%, grade F, #1,264 of 1,632 statewide, top 82%, 3,473 students, 82% FRL).
- Market conditions: Rents falling (-3.3%/yr); 159 active listings in the ZIP; 29,883 units permitted in Harris County in 2024 (8,621 in 5+ unit buildings).
- At $13,126/mo this rent would consume 250% of the median local household income ($63k/yr) (locally 993% of renters already pay >50% of income on rent) — very limited rent-growth headroom before tenants either downsize or default.
Forward outlook
- Local home prices are declining (-1.2%/yr); year-one equity from $6k of loan paydown is wiped out by about $11k of value loss. Plan a longer hold.
- Harris County population projected at +47% by 2050 — long-run rental-demand tailwind backs the buy-and-hold thesis.
- At projected returns (-1.2% appreciation + 0.0% rent growth), your $245k cash investment doubles in ~5 years — after that, you're playing with house money.
Negotiation context
- It's been on market 38 days — a 3% lower offer ($849k) is reasonable based on typical stale-listing flexibility.
- 7 sale attempts since 2y ago with the ask held roughly flat each time — persistent listings suggest the price (not the market) is what's stuck; bring a comps-based counter.
Risks & watch-outs
- Watch-outs: flood insurance adds $66/mo; built in 1957 — expect roof / HVAC / electrical / plumbing capex.
- Climate carrying-cost: severe flood risk; severe wind risk, 99% chance of damaging wind over 30y; extreme-heat days projected 7→24/yr by 2055 (HVAC capex compounding) — expect insurance premiums to compound above CPI over the hold.
Questions for the listing agent
- It's been on market 38 days. Have you received any prior offers? Is the seller open to a 3% concession, seller financing, or rate buy-down credit?
- Built in 1957 — when were the roof, HVAC, electrical panel, plumbing, and water heater last replaced?
- What's the actual annual flood-insurance premium (NFIP or private), and is the property in a SFHA with mandatory coverage?
- Is there a deadline driving the sale (1031 exchange, divorce, estate, relocation)? That informs how much negotiation room exists.
- Schools are D-rated, which usually means shorter tenancies and higher turnover. Who's the typical renter profile here, and what's been the actual vacancy rate?
- Crime grade is F in this area — have there been break-ins, vandalism, or insurance claims at this property in the last 3 years? What carrier currently insures it and at what premium?
- What's the average days-on-market for RENTAL listings here right now (not sales)? A rising rental-DOM trend means longer vacancies and softer asking-rent achievability than the comps imply.
- What's the recent tenant-quality profile in this submarket — average credit score on applications, eviction rate, late-payment / NSF rate, and stable-employment percentage? A property-management company in the area should have these aggregated.
- How much new apartment / multifamily construction is in the pipeline within 1–3 miles? Heavy new supply (>2% of stock underway) typically softens rents 12–24 months out; light construction supports rent growth.
Investment metrics
- 1% rule
- 1.50% ✓
- Cap rate
- 12.65%
- Cash-on-cash
- 22.69%
- DSCR
- 2.01
- GRM
- 5.6
CMA / ARV
No comps found within radius.
Projected returns pro-forma
-1.2% appreciation · 0.0% rent growth · sell at horizon
- IRR
- 16.7%
- Equity multiple
- 1.73×
- Total profit
- $178,531
- Equity at exit
- $202,672
- IRR
- 20.6%
- Equity multiple
- 2.81×
- Total profit
- $444,598
- Equity at exit
- $205,626
Cash invested: $245,000 (down + closing). Projections, not guarantees.
Landlord ↔ Tenant lean methodology
- Overall (STATE)
- 87 Strongly Landlord-Friendly
- State Texas
- 87 Strongly Landlord-Friendly · R+5
- County
- — inherits STATE
- City
- — inherits STATE
ZIP-level market 77049
- Home prices YoY
- -0.5%
- Rents YoY
- -3.3%
- Active inventory
- 159
- Price-to-rent
- 44.4×
Monthly cashflow live
- Estimated rent
- $13,126 high interval (Pro) →
- Mortgage (P&I)
- −$4,589
- Tax from tax record
- −$783 /mo · $9,397/yr
- Insurance
- −$365
- Flood insurance flood zone
- −$66 /mo · $798/yr
- HOA
- −$0
- Vacancy / Maint / Mgmt
- −$2,756
- Net cashflow
- $4,567
Break-even live
Sensitivity live
| Price | -10% $5,062 | -5% $4,814 | +0% $4,567 | +5% $4,319 | +10% $4,071 |
|---|---|---|---|---|---|
| Rent | -10% $3,530 | -5% $4,048 | +0% $4,567 | +5% $5,085 | +10% $5,604 |
| Rate | -1.0pp $5,007 | -0.5pp $4,789 | base $4,567 | +0.5pp $4,340 | +1.0pp $4,109 |
8-unit breakdown (identical units grouped — click to expand)
| Units | Beds | Baths | Est. rent |
|---|---|---|---|
| 8× units | 2 | 1 | $13,128 |
| #1 | 2 | 1 | $1,641 |
| #2 | 2 | 1 | $1,641 |
| #3 | 2 | 1 | $1,641 |
| #4 | 2 | 1 | $1,641 |
| #5 | 2 | 1 | $1,641 |
| #6 | 2 | 1 | $1,641 |
| #7 | 2 | 1 | $1,641 |
| #8 | 2 | 1 | $1,641 |
| Total (8 units) | $13,126 | ||
UW: 25.0% down · 7.5% · 30yr · 1.5% tax · 5.0% vac · 8.0% maint · 8.0% mgmt
Financing live
Cash to close
- Down payment
- $218,750
- Closing costs
- $26,250
- Reserves months
- —
- Total cash needed
- —
Loan-product check · same deal, 3 products live
Conventional
25% down · 7.5% · 30yr
- Down + closing
- —
- Monthly P&I
- —
- Monthly cashflow
- —
- DSCR
- —
- Eligible?
- —
Personal DTI + credit; lowest rate.
DSCR
20% down · 8.5% · 30yr
- Down + closing
- —
- Monthly P&I
- —
- Monthly cashflow
- —
- DSCR
- —
- Eligible?
- —
No personal income docs; deal must DSCR.
Hard money
10% down · 12.0% · 12mo
- Down + closing
- —
- Monthly P&I
- —
- Monthly cashflow
- —
- DSCR
- —
- Eligible?
- —
Short-term bridge; refi at stabilization.
Listing history 30 events
-
2026-06-21days on market $875,000 Active 38 DOM
-
2026-06-18days on market $875,000 Active 35 DOM
-
2026-06-17days on market $875,000 Active 34 DOM
-
2026-06-16days on market $875,000 Active 33 DOM
-
2026-06-15days on market $875,000 Active 32 DOM
-
2026-06-13days on market $875,000 Active 30 DOM
-
2026-06-09days on market $875,000 Active 26 DOM
-
2026-06-08days on market $875,000 Active 25 DOM
-
2026-06-07days on market $875,000 Active 24 DOM
-
2026-06-04days on market $875,000 Active 21 DOM
-
2026-06-03days on market $875,000 Active 20 DOM
-
2026-06-02days on market $875,000 Active 19 DOM
-
2026-06-01days on market $875,000 Active 18 DOM
-
2026-05-31days on market $875,000 Active 17 DOM
-
2026-05-14$875,000 Active 946-char remark
-
2024-09-25historical $1,200
-
2024-09-15$1,200
-
2024-08-14historical $1,250
-
2024-08-14$1,250
-
2024-08-09historical $1,250
-
2024-07-31$1,250
-
2024-07-08historical $1,250
-
2024-06-19$1,250
-
2024-05-24historical $1,250
-
2024-05-07$1,250
-
2024-05-06historical $1,300
-
2024-04-23$1,300
-
2023-04-25soldstatus
-
2023-04-24soldstatus
-
1994-12-13soldstatus
ⓘ Source: listings_history table (triggers on properties + properties_extension) + one-shot
backfill from property_details.listing_events for pre-trigger history.
Tax reassessment forecast TX · Resets to sale price
- Current annual tax
- $9,397 · $783/mo
- Projected year-2 tax
- $16,012 · $1,334/mo
- Expected delta
- +$6,615/yr (+$551/mo · 70.4%)
ⓘ Screening estimate from a state-policy table — verify with the county assessor before closing.
Climate risk First Street
- Flood 8/10 Severe FEMA zone X (unshaded) · 99% chance over 30 yrs
- Wildfire 3/10 Moderate
- Heat 9/10 Extreme 7 d/yr ≥109°F today · 24 d/yr by 30 yrs out
- Wind 9/10 Extreme 99% chance of damaging wind over 30 yrs
- Air quality 2/10 Low 2 unhealthy d/yr today · 2 by 30 yrs out
Nearby sold comps map
Loading sold comps map…
Walkable amenities ~0.75 mi
Loading nearby amenities…
Taxation est. · year 1
- Rental income
- $157,512
- − Mortgage interest
- −$49,014
- − Property taxes
- −$9,397
- − Insurance
- −$5,172
- − Repairs & maintenance
- −$12,601
- − Management
- −$12,601
- − Depreciation
- −$25,455
- Taxable income
- $43,272
- Est. tax owed @ 24.0%
- −$10,385
- After-tax cash flow
- $44,416/yr
For passive investors: Depreciation is non-cash, so a rental often shows a tax loss while cash-flowing — sheltering income. Rental losses are passive: they offset passive income freely, and up to $25,000/yr can offset ordinary (W-2) income if you actively participate and your MAGI is under $100k (phasing out to $0 by $150k); unused losses carry forward. On sale, claimed depreciation is recaptured at up to 25%, and gains may owe capital-gains tax (a 1031 exchange can defer both). Figures are a year-1 estimate at your 24.0% rate — not tax advice; consult a CPA.
Schools (NCES district)
- District
- Sheldon ISD
- NCES district ID
- 4839990
- Math proficiency
- 19% ▼ -18.00%
- Reading proficiency
- 25% ▼ -10.00%
- Median HH income
- $49,443
- Composite
- 19.5/100
- National rank
- #8772
- State rank
- #746 of 826 in TX
Livability — Houston
- Score
- 74/100
- State rank
- #184
- US rank
- #4771
Category grades
Schools grade is shown separately in the Schools card above.
Census & demographics
- County
- Harris County · 4,702,590 people
- City population
- 3,226,434
- Metro
- Houston-The Woodlands-Sugar Land, TX
- Population (ZIP)
- 40,418
- Household income
- $62,971
- Rent vs Own
- Severe rent burden
- 993.0
Population outlook (Harris County) Hauer SSP2
- Today (2025)
- 5,571,493 people
- By 2030
- 6,089,821 · +9.3%
- By 2040
- 7,142,806 · +28.2%
- By 2050
- 8,185,864 · +46.9%
- By 2075
- 10,574,329 · +89.8%
- By 2100
- 12,109,958 · +117.4%
Race, ethnicity, and origin ACS 2023
- Neighborhood character
- Predominantly Hispanic (66%)
- Race & ethnicity
- Hispanic / Latino 66% Two or more races 32% Black 19% White 10% Asian 3%
- Hispanic origin (detail)
- Mexican 55%
- Common ancestry
- Lithuanian 1%
- Foreign-born
- 26% · Canada, China, Vietnam
- Languages at home
- 43% English-only · Spanish 54% Other Asian/Pacific 1% Chinese 1%
Political lean MEDSL · Harris
- 2024 margin
- Lean D (+5.5) · D 52.0% · R 46.4% · Other 1.6%
- 2008→2024 swing
- +3.9pp toward D · 2008: 1.6pp · 2024: 5.5pp
- All cycles
- 2024: D+5.5 2020: D+13.3 2016: D+12.4 2012: D+0.1 2008: D+1.6
Not yet ingested
- Civics
- —
Market trends
- HPI YoY
- ▼ -1.20%
- Current HPI
- 248.1111
- Rent YoY
- ▼ -3.31%
- Metro
- Houston-The Woodlands-Sugar Land, TX
- State GDP YoY
- ▲ 3.95%
- F500 in state
- 110
Industry mix (Fortune 500 HQ in TX)
| Industry | F500 HQs | Revenue |
|---|---|---|
| Energy | 16 | $1,198B |
|
||
| Technology | 5 | $198B |
|
||
| Engineering / Construction | 4 | $72B |
|
||
| Energy Services | 3 | $60B |
|
||
| Utilities | 3 | $41B |
|
||
| Healthcare | 2 | $330B |
|
||
Price history
+67207.7% since first listed16 events — show timeline
- 2026-05-14 Listed $875,000 HARMLS
- 2024-09-25 Rental Removed $1,200 HARMLS
- 2024-09-15 Listed for Rent $1,200 HARMLS
- 2024-08-14 Rental Removed $1,250 HARMLS
- 2024-08-14 Listed for Rent $1,250 HARMLS
- 2024-08-09 Rental Removed $1,250 HARMLS
- 2024-07-31 Listed for Rent $1,250 HARMLS
- 2024-07-08 Rental Removed $1,250 HARMLS
- 2024-06-19 Listed for Rent $1,250 HARMLS
- 2024-05-24 Rental Removed $1,250 HARMLS
- 2024-05-07 Listed for Rent $1,250 HARMLS
- 2024-05-06 Rental Removed $1,300 HARMLS
- 2024-04-23 Listed for Rent $1,300 HARMLS
- 2023-04-25 Sold (Public Records) — Public Records
- 2023-04-24 Sold (Public Records) — Public Records
- 1994-12-13 Sold (Public Records) — Public Records
Property tax history
+5.4%/yrLatest (2025): $9,397 · -6.5% YoY. Source: county tax records.
Cash-flow waterfall
monthlySold comps — $/sqft
last 12 mo · ≤1 miLoading sold comps…