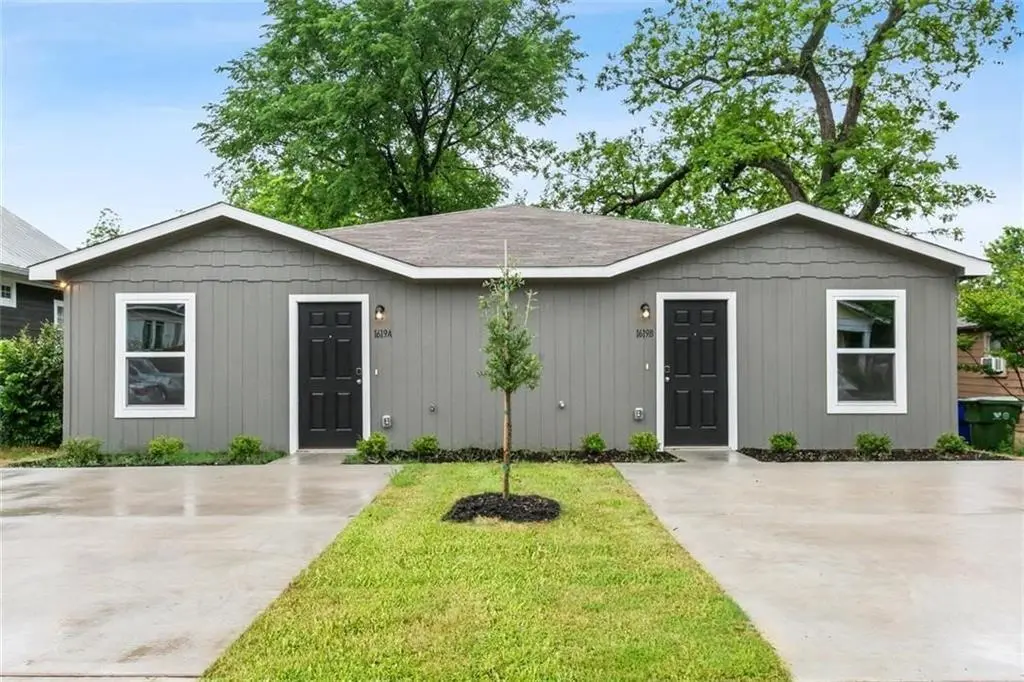
 Duplex
1619 N 12th St · Waco, TX
Flood risk 1/10 · Minimal
- FEMA flood zone
- X (unshaded)
- Chance of flooding over 30 yrs
- 0.0%
- Est. flood insurance / yr
- $507 – $1,088
Fire risk 3/10 · Minor
- Est. fire insurance / yr
- $1,222 – $2,270
Heat risk 7/10 · Major
- Hot days now (above 109°F)
- 7 days/yr
- Hot days in 30 yrs
- 24 days/yr
Wind risk 6/10 · Moderate
- Chance of severe wind over 30 yrs
- 60.0%
Air-quality risk 2/10 · Minimal
- Unhealthy air days now
- 0 days/yr
- Unhealthy air days in 30 yrs
- 1 days/yr
Risk factors via First Street. Map © Google.
Why this score? — see what drove the D grade
The composite is a weighted blend of 9 inputs, each scored 0–100. Each bar is that input's sub-score; the figure is the points it added to the 100-point composite (weight × sub-score).
- Cash flow +17.1/30.0
- ARV discount +7.5/15.0
- DSCR +5.3/10.0
- 1% rule +4.0/10.0
- Livability +3.7/5.0
- Rent growth +2.8/5.0
- Condition / age +2.5/5.0
- Schools +1.8/10.0
- Appreciation +0.0/10.0
$294,900
🖨 Deal sheet 📄 Offer letter ✓ Due diligence
Multi-family units
County records classify this as Multi-Family (2-4 Unit). Listing-text estimate: 2 units. confirmed
Listing remarks
Amazing opportunity for investors, or someone who wants to have passive income while living in one unit and renting out the other! Almost new duplex includes two identical units 838 sq ft each with three bedrooms, one bathroom and modern amenities throughout. Energy-efficient features and appliances are proven to drive down utility costs. Fully set up for SMART HOME TECHNOLOGY. Earn additional income or let someone else pay a portion of your house payment - take a look today!
Key facts
- 8,233 sq ft lot
- 2 parking spots
- Built 2020
Tags
Property features AI
Finance
- Other: Property listed as real estate owned (REO)
- Financial info: Designed as residential income with two total units; Reported gross annual income and expenses shown as $0.00; Net operating income reported as $0
- HOA & community: No homeowners association
Exterior
- Parking: Two parking spaces
- Utilities: City water; City sewer; No municipal utility district
- Home design: Duplex residential income property; Single-story
- Construction: Built in 2020; Frame construction; Slab foundation; Composition roof
- Exterior features: Lot in Burleson M F subdivision; Lot size approximately 0.189 acres
Interior
- Kitchen: Dishwasher; Garbage disposal
- Bedrooms: Six bedrooms
- Flooring: Vinyl flooring
- Bathrooms: Two full bathrooms
- Heating & cooling: Central heating (electric); Central air conditioning (electric)
- Interior features: Open interior with general 'Other' features; One-level layout; Smart home features (app or pass enabled)
Neighborhood map
What this means for you Summary
Snapshot
- This is a 2 × 3-bed/1.0-bath units multifamily listed at $295k.
Deal economics
- At list price, monthly cash flow is $203 ($2k/yr) — positive. Per door: $101/mo.
- The deal already cash-flows at list — no discount required.
- To meet the 1% rule (rent ≥ 1% of price), the offer needs to be $266k (9.7% below list).
- Recommended offer: $266k (9.7% below list) — sets the bar for 1% rule.
- Cap rate 7.1% vs local median 3.9% in Waco — top-decile yield for the area; either an underpriced asset or a hidden risk that comps aren't pricing in. Stress-test before assuming the spread holds.
Location & tenants
- Location reads 74/100 on livability (#166 in TX, #4,378 nationally) — a middle-class / working-renter tenant base. Strengths: cost of living A+, housing A+, health & safety A+; Watch: crime D, commute F, employment D-.
- Waco ISD (urban): math 20% / reading 24% proficiency, ranked #773 of 826 in TX (top 94%) — low school quality limits family demand, transient renter base, plan for 1-2y turnover; 81% free/reduced lunch — lower-income household profile, screen leases tightly.
- Zoned schools: Brook Avenue El (math 8% / reading 12%, grade F, #4,259 of 4,322 statewide, top 99%, 369 students, 98% FRL, charter) — zoned schools average 98% FRL vs 81% district-wide (16 pts higher); higher-poverty schools than district average — tighter screening recommended.
- Zoned-school proficiency averages 10% at this address vs 22% district-wide (-12 pts) — the specific schools serving this property underperform the Waco ISD average; the district grade overstates school quality for this exact location.
- Market conditions: Rents rising (+1.1%/yr); 144 active listings in the ZIP; 40 comparable units currently listed for rent nearby; rentals at typical pace (median 21d on market — plan ~3-4 weeks tenant-placement turnaround); lower-income renter base — watch delinquency; 1,014 units permitted in McLennan County in 2024 (200 in 5+ unit buildings).
- At $2,663/mo this rent would consume 79% of the median local household income ($40k/yr) (locally 704% of renters already pay >50% of income on rent) — very limited rent-growth headroom before tenants either downsize or default.
Forward outlook
- Local home prices are declining (-3.0%/yr); year-one equity from $2k of loan paydown is wiped out by about $9k of value loss. Plan a longer hold.
- McLennan County population projected at +17% by 2050 — long-run rental-demand tailwind backs the buy-and-hold thesis.
Negotiation context
- It's been on market 35 days — a 3% lower offer ($286k) is reasonable based on typical stale-listing flexibility.
Risks & watch-outs
- Climate carrying-cost: major wind risk, 60% chance of damaging wind over 30y; extreme-heat days projected 7→24/yr by 2055 (HVAC capex compounding) — expect insurance premiums to compound above CPI over the hold.
Questions for the listing agent
- It's been on market 35 days. Have you received any prior offers? Is the seller open to a 10% concession, seller financing, or rate buy-down credit?
- Can we see the unit-by-unit rent roll, current vacancy, and any below-market leases? What's the average tenancy length?
- What capital expenditures (roof, boiler, parking lot, exteriors) have been made in the last 5 years, and what's planned in the next 2?
- Is there a deadline driving the sale (1031 exchange, divorce, estate, relocation)? That informs how much negotiation room exists.
- Schools are D-rated, which usually means shorter tenancies and higher turnover. Who's the typical renter profile here, and what's been the actual vacancy rate?
- Crime grade is D in this area — have there been break-ins, vandalism, or insurance claims at this property in the last 3 years? What carrier currently insures it and at what premium?
- The area grade is low — what's the realistic commute time and amenity access for the typical tenant pool here? Any planned neighborhood developments (good or bad) we should know about?
- What's the average days-on-market for RENTAL listings here right now (not sales)? A rising rental-DOM trend means longer vacancies and softer asking-rent achievability than the comps imply.
- What's the recent tenant-quality profile in this submarket — average credit score on applications, eviction rate, late-payment / NSF rate, and stable-employment percentage? A property-management company in the area should have these aggregated.
- How much new apartment / multifamily construction is in the pipeline within 1–3 miles? Heavy new supply (>2% of stock underway) typically softens rents 12–24 months out; light construction supports rent growth.
Investment metrics
- 1% rule
- 0.90% ✗
- Cap rate
- 7.12%
- Cash-on-cash
- 2.95%
- DSCR
- 1.13
- GRM
- 9.2
CMA / ARV
- ARV (median comp)
- $184,725
- List price
- $294,900
- Delta
- 59.64%
- Verdict
- OVERPRICED
- Comps
- 20 within 1.0 mi
Projected returns pro-forma
-3.0% appreciation · 1.14% rent growth · sell at horizon
- IRR
- -13.7%
- Equity multiple
- 0.52×
- Total profit
- $-39,813
- Equity at exit
- $43,971
- IRR
- -7.8%
- Equity multiple
- 0.55×
- Total profit
- $-37,565
- Equity at exit
- $25,498
Cash invested: $82,572 (down + closing). Projections, not guarantees.
Landlord ↔ Tenant lean methodology
- Overall (STATE)
- 87 Strongly Landlord-Friendly
- State Texas
- 87 Strongly Landlord-Friendly · R+5
- County
- — inherits STATE
- City
- — inherits STATE
ZIP-level market 76707
- Rents YoY
- 1.1%
- Active inventory
- 144
- Price-to-rent
- 18.5×
Monthly cashflow live
- Estimated rent
- $2,663 high interval (Pro) →
- Mortgage (P&I)
- −$1,546
- Tax from tax record
- −$232 /mo · $2,780/yr
- Insurance
- −$123
- HOA
- −$0
- Vacancy / Maint / Mgmt
- −$559
- Net cashflow
- $203
Break-even live
2-unit breakdown (identical units grouped — click to expand)
| Units | Beds | Baths | Est. rent |
|---|---|---|---|
| 2× units | 3 | 1 | $2,662 |
| #1 | 3 | 1 | $1,331 |
| #2 | 3 | 1 | $1,331 |
| Total (2 units) | $2,663 | ||
UW: 25.0% down · 7.5% · 30yr · 1.5% tax · 5.0% vac · 8.0% maint · 8.0% mgmt
Financing live
Cash to close
- Down payment
- $73,725
- Closing costs
- $8,847
- Reserves months
- —
- Total cash needed
- —
Loan-product check · same deal, 3 products live
Conventional
25% down · 7.5% · 30yr
- Down + closing
- —
- Monthly P&I
- —
- Monthly cashflow
- —
- DSCR
- —
- Eligible?
- —
Personal DTI + credit; lowest rate.
DSCR
20% down · 8.5% · 30yr
- Down + closing
- —
- Monthly P&I
- —
- Monthly cashflow
- —
- DSCR
- —
- Eligible?
- —
No personal income docs; deal must DSCR.
Hard money
10% down · 12.0% · 12mo
- Down + closing
- —
- Monthly P&I
- —
- Monthly cashflow
- —
- DSCR
- —
- Eligible?
- —
Short-term bridge; refi at stabilization.
Rent comps 40 comps
| Address | Beds | Baths | Sqft | Rent | $/sqft | DOM | Units | Dist |
|---|---|---|---|---|---|---|---|---|
| 1216 Tennessee Ave Waco, TX | 3.0 | 2.0 | 872 | $1,250 | $1.43 | 20d | 1 | 0.05mi |
| 1216 Tennessee Ave Unit B Waco, TX | 3.0 | 2.0 | 872 | $1,350 | $1.55 | 20d | 1 | 0.05mi |
| 1600 N 11th St Unit A Waco, TX | 3.0 | 2.0 | 1217 | $1,750 | $1.44 | 43d | 1 | 0.08mi |
| 1606 N 9th St Waco, TX | 4.0 | 2.0 | 1392 | $1,525 | $1.10 | 20d | 1 | 0.21mi |
| 718 Garland Ave Unit b Waco, TX | 3.0 | 1.0 | 838 | $985 | $1.18 | 13d | 1 | 0.21mi |
| 1511 Maple Ave Waco, TX | 3.0 | 2.0 | 1487 | $1,450 | $0.98 | 43d | 1 | 0.28mi |
| 1110 N 11th St Waco, TX | 3.0 | 2.0 | 1172 | $1,495 | $1.28 | 20d | 1 | 0.35mi |
| 1104 N 11th St Waco, TX | 3.0 | 2.0 | 1231 | $1,650 | $1.34 | 20d | 1 | 0.37mi |
| 1815 Seneca Ave Waco, TX | 3.0 | 2.0 | 1471 | $1,650 | $1.12 | 20d | 1 | 0.46mi |
| 1821 Algonquin St Waco, TX | 2.0 | 1.0 | 930 | $1,150 | $1.24 | 43d | 1 | 0.47mi |
| 712 Proctor Ave Waco, TX | 4.0 | 2.0 | 1184 | $1,450 | $1.22 | 20d | 1 | 0.50mi |
| 804 N 11th St Waco, TX | 1.0–2.0 | 1.0 | 838 | $1,200 | $1.43 | 20d | 1 | 0.52mi |
| 1825 Cumberland Ave Waco, TX | 3.0 | 1.0 | 1400 | $1,325 | $0.95 | 13d | 1 | 0.55mi |
| 1818 Windsor Ave Waco, TX | 4.0 | 2.0 | 1112 | $1,625 | $1.46 | 20d | 1 | 0.56mi |
| 716 N 13th St Waco, TX | 4.0 | 2.0 | 1349 | $1,675 | $1.24 | 20d | 1 | 0.59mi |
| 1920 Windsor Ave Waco, TX | 3.0 | 1.0 | 1216 | $1,200 | $0.99 | 43d | 1 | 0.64mi |
| 2000 Windsor Ave Waco, TX | 4.0 | 2.5 | 1450 | $1,800 | $1.24 | 43d | 1 | 0.66mi |
| 2225 Trice Ave Waco, TX | 2.0 | 1.0 | 803 | $1,300 | $1.62 | 43d | 1 | 0.81mi |
| 2225 Trice Ave Waco, TX | 2.0 | 1.0 | 803 | $1,300 | $1.62 | 13d | 1 | 0.81mi |
| 2224 Cumberland Ave Waco, TX | 2.0 | 1.0 | 768 | $1,075 | $1.40 | 43d | 1 | 0.84mi |
| 2225 Windsor Ave Waco, TX | 2.0 | 1.0 | 840 | $1,100 | $1.31 | 43d | 1 | 0.87mi |
| 1621 Alexander Ave Unit A Waco, TX | 3.0 | 2.0 | 1400 | $1,695 | $1.21 | 20d | 1 | 0.95mi |
| 2511 Parrott Ave Waco, TX | 3.0 | 2.0 | 1463 | $1,695 | $1.16 | 43d | 1 | 0.97mi |
| 2121 Lyle Ave Waco, TX | 2.0 | 1.0 | 1080 | $1,000 | $0.93 | 13d | 1 | 1.02mi |
| 615 N 23rd St Waco, TX | 2.0 | 1.0 | 900 | $1,275 | $1.42 | 20d | 1 | 1.09mi |
| 215 Washington Ave Waco, TX | 1.0–4.0 | 1.0–4.0 | 919 | $1,737 | $1.89 | 20d | 1 | 1.10mi |
| 2621 Windsor Ave Waco, TX | 2.0 | 1.0 | 1108 | $1,175 | $1.06 | 20d | 1 | 1.12mi |
| 608 N 23rd St Waco, TX | 3.0 | 1.0 | 1361 | $1,695 | $1.25 | 20d | 1 | 1.12mi |
| 700 Franklin Ave Waco, TX | 2.0 | 2.0 | 802 | $1,500 | $1.87 | 43d | 1 | 1.16mi |
| 2313 Mitchell Ave Waco, TX | 2.0 | 1.0 | 804 | $1,150 | $1.43 | 20d | 1 | 1.17mi |
| 2705 Bosque Blvd Waco, TX | 3.0 | 2.0 | 1028 | $1,599 | $1.56 | 43d | 1 | 1.18mi |
| 2714 Windsor Ave Waco, TX | 2.0 | 1.0 | 979 | $1,300 | $1.33 | 43d | 1 | 1.18mi |
| 108 Choctaw Ct Waco, TX | 3.0 | 2.0 | 1273 | $1,600 | $1.26 | 13d | 1 | 1.19mi |
| 2632 Colonial Ave Unit B Waco, TX | 2.0 | 1.0 | 896 | $1,050 | $1.17 | 20d | 1 | 1.19mi |
| 1923 Austin Ave Unit 5202 Waco, TX | 2.0 | 2.5 | 1265 | $1,395 | $1.10 | 20d | 1 | 1.20mi |
| 2504 Lyle Ave Waco, TX | 3.0 | 2.0 | 1028 | $1,475 | $1.43 | 20d | 1 | 1.21mi |
| 2601 Herring Ave Unit 1 Waco, TX | 3.0 | 1.0 | 989 | $1,295 | $1.31 | 43d | 1 | 1.23mi |
| 1104 Sherman St Waco, TX | 2.0 | 1.0 | 1120 | $1,500 | $1.34 | 43d | 1 | 1.23mi |
| 2724 Bosque Blvd Waco, TX | 2.0 | 1.0 | 1120 | $1,100 | $0.98 | 20d | 1 | 1.24mi |
| 507 Dunbar St Waco, TX | 3.0 | 1.0 | 852 | $1,450 | $1.70 | 13d | 1 | 1.26mi |
Listing history 18 events
-
2026-06-18days on market $294,900 Active 35 DOM
-
2026-06-17days on market $294,900 Active 34 DOM
-
2026-06-16days on market $294,900 Active 33 DOM
-
2026-06-15days on market $294,900 Active 32 DOM
-
2026-06-14days on market $294,900 Active 30 DOM
-
2026-06-13pricedays on market $294,900 Active 29 DOM
-
2026-06-10days on market $309,900 Active 27 DOM
-
2026-06-09days on market $309,900 Active 26 DOM
-
2026-06-08days on market $309,900 Active 25 DOM
-
2026-06-07pricedays on market $309,900 Active 24 DOM
-
2026-06-05days on market $314,900 Active 21 DOM
-
2026-06-03days on market $314,900 Active 20 DOM
-
2026-06-02days on market $314,900 Active 19 DOM
-
2026-06-01days on market $314,900 Active 18 DOM
-
2026-05-31days on market $314,900 Active 17 DOM
-
2026-05-30days on market $314,900 Active 16 DOM
-
2026-05-13$314,900 Active 480-char remark
-
2021-05-04soldstatus
ⓘ Source: listings_history table (triggers on properties + properties_extension) + one-shot
backfill from property_details.listing_events for pre-trigger history.
Tax reassessment forecast TX · Resets to sale price
- Current annual tax
- $2,780 · $232/mo
- Projected year-2 tax
- $5,397 · $450/mo
- Expected delta
- +$2,616/yr (+$218/mo · 94.1%)
ⓘ Screening estimate from a state-policy table — verify with the county assessor before closing.
Climate risk First Street
- Flood 1/10 Low FEMA zone X (unshaded) · 0% chance over 30 yrs
- Wildfire 3/10 Moderate
- Heat 7/10 Severe 7 d/yr ≥109°F today · 24 d/yr by 30 yrs out
- Wind 6/10 Major 60% chance of damaging wind over 30 yrs
- Air quality 2/10 Low 0 unhealthy d/yr today · 1 by 30 yrs out
Nearby sold comps map
Loading sold comps map…
Walkable amenities ~0.75 mi
Loading nearby amenities…
Taxation est. · year 1
- Rental income
- $31,956
- − Mortgage interest
- −$16,519
- − Property taxes
- −$2,780
- − Insurance
- −$1,474
- − Repairs & maintenance
- −$2,556
- − Management
- −$2,556
- − Depreciation
- −$8,579
- Taxable loss
- −$2,510
- Est. tax savings @ 24.0%
- +$602
- After-tax cash flow
- $3,035/yr
For passive investors: Depreciation is non-cash, so a rental often shows a tax loss while cash-flowing — sheltering income. Rental losses are passive: they offset passive income freely, and up to $25,000/yr can offset ordinary (W-2) income if you actively participate and your MAGI is under $100k (phasing out to $0 by $150k); unused losses carry forward. On sale, claimed depreciation is recaptured at up to 25%, and gains may owe capital-gains tax (a 1031 exchange can defer both). Figures are a year-1 estimate at your 24.0% rate — not tax advice; consult a CPA.
Schools (NCES district)
- District
- Waco ISD
- NCES district ID
- 4844280
- Math proficiency
- 20% ▼ -14.00%
- Reading proficiency
- 24% ▼ -6.00%
- Median HH income
- $29,208
- Composite
- 17.57/100
- National rank
- #9043
- State rank
- #773 of 826 in TX
Livability — Waco
- Score
- 74/100
- State rank
- #166
- US rank
- #4378
Category grades
Schools grade is shown separately in the Schools card above.
Census & demographics
- Census place
- Waco, TX
- County
- McLennan County · 213,088 people
- City population
- 125,319
- Metro
- Waco, TX
- Population (ZIP)
- 15,879
- Household income
- $40,443
- Rent vs Own
- Severe rent burden
- 704.0
Population outlook (McLennan County) Hauer SSP2
- Today (2025)
- 264,191 people
- By 2030
- 273,578 · +3.6%
- By 2040
- 291,506 · +10.3%
- By 2050
- 308,044 · +16.6%
- By 2075
- 349,648 · +32.3%
- By 2100
- 364,779 · +38.1%
Race, ethnicity, and origin ACS 2023
- Neighborhood character
- Diverse neighborhood (Simpson 0.64)
- Race & ethnicity
- Hispanic / Latino 47% Black 32% Two or more races 26% White 18%
- Hispanic origin (detail)
- Mexican 43%
- Common ancestry
- Romanian 1% Lithuanian 1% Italian 1%
- Foreign-born
- 15% · Canada
- Languages at home
- 65% English-only · Spanish 34% Tagalog/Filipino 1%
Political lean MEDSL · McLennan
- 2024 margin
- Solid R (+30.9) · D 34.0% · R 64.9% · Other 1.0%
- 2008→2024 swing
- -7.0pp toward R · 2008: -23.9pp · 2024: -30.9pp
- All cycles
- 2024: R+30.9 2020: R+23.4 2016: R+27.1 2012: R+29.8 2008: R+23.9
Not yet ingested
- Civics
- —
Market trends
- HPI YoY
- ▼ -134.95%
- Current HPI
- 239.639
- Rent YoY
- ▲ 1.14%
- Metro
- Waco, TX
- State GDP YoY
- ▲ 3.95%
- F500 in state
- 110
Industry mix (Fortune 500 HQ in TX)
| Industry | F500 HQs | Revenue |
|---|---|---|
| Energy | 16 | $1,198B |
|
||
| Technology | 5 | $198B |
|
||
| Engineering / Construction | 4 | $72B |
|
||
| Energy Services | 3 | $60B |
|
||
| Utilities | 3 | $41B |
|
||
| Healthcare | 2 | $330B |
|
||
Price history
-6.4% since first listed4 events — show timeline
- 2026-06-11 Price Changed $294,900 NTREIS
- 2026-06-05 Price Changed $309,900 NTREIS
- 2026-05-13 Listed $314,900 NTREIS
- 2021-05-04 Sold (Public Records) — Public Records
Property tax history
+27.2%/yrLatest (2025): $2,780 · -9.0% YoY. Source: county tax records.
Cash-flow waterfall
monthlySold comps — $/sqft
last 12 mo · ≤1 miLoading sold comps…