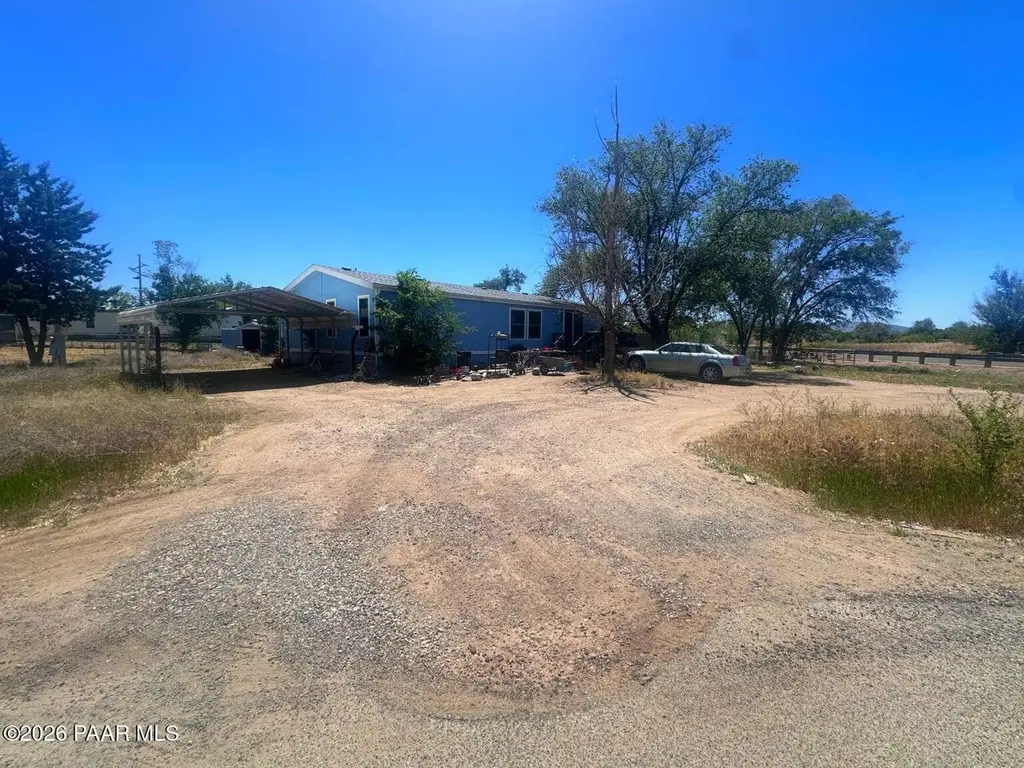
1935 E Stagecoach Trl · Chino Valley, AZ
Flood risk 1/10 · Minimal
- FEMA flood zone
- X (unshaded)
- Chance of flooding over 30 yrs
- 0.0%
- Est. flood insurance / yr
- $507 – $1,088
Fire risk 4/10 · Minor
- Est. fire insurance / yr
- $610 – $1,132
Heat risk 5/10 · Moderate
- Hot days now (above 95°F)
- 7 days/yr
- Hot days in 30 yrs
- 17 days/yr
Wind risk 1/10 · Minimal
- Chance of severe wind over 30 yrs
- —
Air-quality risk 1/10 · Minimal
- Unhealthy air days now
- 0 days/yr
- Unhealthy air days in 30 yrs
- 0 days/yr
Risk factors via First Street. Map © Google.
Why this score? — see what drove the B grade
The composite is a weighted blend of 9 inputs, each scored 0–100. Each bar is that input's sub-score; the figure is the points it added to the 100-point composite (weight × sub-score).
- Cash flow +28.7/30.0
- ARV discount +15.0/15.0
- DSCR +10.0/10.0
- 1% rule +6.6/10.0
- Livability +3.1/5.0
- Rent growth +2.5/5.0
- Schools +2.5/10.0
- Condition / age +2.5/5.0
- Appreciation +0.0/10.0
$198,900
🖨 Deal sheet (PDF) 📄 Offer letter ✓ Due diligence
Listing remarks
Great opportunity in Chino Valley! This mobile home at 1935 East Stagecoach Trail sits on a desirable corner lot, offering extra space and accessibility. The home features central heating and cooling (approximately 10 years old). The property needs TLC, making it a perfect opportunity for buyers or investors to update, customize, and add value. With its location and potential, this is a solid investment or affordable housing option ready for your vision!
Key facts
- Corner lot
- Extra space
- 0.34 acre lot
Tags
Property features AI
Finance
- Other: Located in Chino Meadows subdivision; City maintained road access (asphalt city street)
- HOA & community: Not a senior community
Exterior
- Parking: Carport (attached) for 1 vehicle
- Utilities: Public water; Electricity available
- Home design: Manufactured home; 2 stories
- Construction: Frame construction; Composition roof; BTV foundation
- Exterior features: Corner, level lot; Other exterior features (see remarks)
Interior
- Kitchen: Dishwasher; Gas range; Microwave; Refrigerator
- Flooring: Carpet; Laminate
- Bathrooms: 2 full bathrooms
- Heating & cooling: Central air conditioning; Forced gas heating
- Interior features: Living and dining combo
- Laundry & utility: Washer; Electric water heater
Neighborhood map
What this means for you Summary
Snapshot
- This is a 3-bed/2.0-bath manufactured listed at $199k.
Deal economics
- At list price, monthly cash flow is $664 ($8k/yr) — positive.
- The deal already cash-flows at list — no discount required.
- Meets the 1% rule at list price ($2k rent vs $199k).
- Cap rate 10.3% vs local median 2.5% in Chino Valley — top-decile yield for the area; either an underpriced asset or a hidden risk that comps aren't pricing in. Stress-test before assuming the spread holds.
Location & tenants
- Location reads 61/100 on livability (#154 in AZ) — a middle-class / working-renter tenant base. Strengths: crime A+, housing A, cost of living B; Watch: employment D+, amenities F, commute F.
- Chino Valley Unified District (4474) (town): math 24% / reading 35% proficiency, ranked #112 of 249 in AZ (top 45%) — low school quality limits family demand, transient renter base, plan for 1-2y turnover.
- Zoned schools: Territorial Early Childhood Center (634 students, 54% FRL); Heritage Middle School (math 22% / reading 33%, grade F, #96 of 218 statewide, top 44%, 536 students, 54% FRL); Chino Valley High School (math 8% / reading 17%, grade F, #281 of 381 statewide, top 75%, 789 students, 43% FRL).
- Market conditions: 264 active listings in the ZIP; 3 comparable units currently listed for rent nearby; rentals lingering (median 46d on market — plan ~5-8 weeks vacancy on turnover, expect pricing pressure); 100% of comp listings sitting > 30 days — soft ceiling on asking rent; 2,062 units permitted in Yavapai County in 2024 (98 in 5+ unit buildings).
Forward outlook
- Local home prices are declining (-3.0%/yr); year-one equity from $1k of loan paydown is wiped out by about $6k of value loss. Plan a longer hold.
- Yavapai County population projected at +10% by 2050 — modest demand growth; plan on rents tracking national, not racing it.
- At projected returns (-3.0% appreciation + 3.0% rent growth), your $56k cash investment doubles in ~9 years — after that, you're playing with house money.
Negotiation context
- Only 9 days on market — expect competitive offers; lowballing is unlikely to land.
- 3 sale attempts with the ask held roughly flat each time — persistent listings suggest the price (not the market) is what's stuck; bring a comps-based counter.
Risks & watch-outs
- Climate carrying-cost: extreme-heat days projected 7→17/yr by 2055 (HVAC capex compounding) — expect insurance premiums to compound above CPI over the hold.
Questions for the listing agent
- Is there a deadline driving the sale (1031 exchange, divorce, estate, relocation)? That informs how much negotiation room exists.
- Schools are D-rated, which usually means shorter tenancies and higher turnover. Who's the typical renter profile here, and what's been the actual vacancy rate?
- What's the average days-on-market for RENTAL listings here right now (not sales)? A rising rental-DOM trend means longer vacancies and softer asking-rent achievability than the comps imply.
- What's the recent tenant-quality profile in this submarket — average credit score on applications, eviction rate, late-payment / NSF rate, and stable-employment percentage? A property-management company in the area should have these aggregated.
- How much new for-sale + rental construction is in the pipeline within 1–3 miles? Heavy new supply typically softens prices + rents 12–24 months out; constrained supply supports both.
Investment metrics
- 1% rule
- 1.16% ✓
- Cap rate
- 10.30%
- Cash-on-cash
- 14.31%
- DSCR
- 1.64
- GRM
- 7.2
CMA / ARV
- ARV (median comp)
- $295,500
- List price
- $198,900
- Delta
- -32.69%
- Verdict
- UNDERPRICED
- Comps
- 7 within 1.0 mi
Show comp detail 12 sales within ~0.75 mi
| Address | Dist | Beds/Ba | Sqft | Sold | Price | $/sf | Match |
|---|---|---|---|---|---|---|---|
| 975 Mylo Dr | 0.25mi | 3/2.0 | 1,561 (+2%) | 14mo | $350,000 | $224 | 73 |
| 2005 Crow Ln | 0.16mi | 3/2.0 | 1,485 (-3%) | 20mo | $280,000 | $189 | 72 |
| 1810 Rhonda Rd | 0.64mi | 3/2.0 | 1,513 (-1%) | 4mo | $295,500 | $195 | 65 |
| 450 Judy Ave | 0.48mi | 3/2.0 | 1,491 (-2%) | 17mo | $290,000 | $195 | 60 |
| 1824 E Jackie Way | 0.37mi | 3/2.0 | 1,437 (-6%) | 17mo | $270,000 | $188 | 59 |
| 1198 Ashburn Way | 0.73mi | 3/2.0 | 1,620 (+6%) | 5mo | $368,700 | $228 | 51 |
| 745 Sharon Rd | 0.27mi | 3/2.0 | 1,743 (+14%) | 18mo | $350,000 | $201 | 49 |
| 1851 E Jackie Way | 0.38mi | 3/2.0 | 1,378 (-10%) | 21mo | $275,000 | $200 | 48 |
| 1215 Prescott Dr | 0.61mi | 3/2.0 | 1,736 (+14%) | 1mo | $299,900 | $173 | 48 |
| 1199 Bucky Oneill Dr | 0.73mi | 3/2.0 | 1,326 (-13%) | 3mo | $299,000 | $225 | 42 |
| 331 Lobo Ln | 0.58mi | 3/3.0 | 1,696 (+11%) | 17mo | $325,000 | $192 | 36 |
| 1226 Del Rio Dr | 0.68mi | 3/2.0 | 1,298 (-15%) | 17mo | $290,000 | $223 | 30 |
Match score weights: distance 35% · size 25% · config 20% · recency 20%. Top-matched comps best support the ARV.
Projected returns pro-forma
-3.0% appreciation · 3.0% rent growth · sell at horizon
- IRR
- 4.6%
- Equity multiple
- 1.18×
- Total profit
- $9,971
- Equity at exit
- $29,657
- IRR
- 14.1%
- Equity multiple
- 2.13×
- Total profit
- $62,765
- Equity at exit
- $17,197
Cash invested: $55,692 (down + closing). Projections, not guarantees.
Landlord ↔ Tenant lean methodology
- Overall (STATE)
- 87 Strongly Landlord-Friendly
- State Arizona
- 87 Strongly Landlord-Friendly · R+3
- County
- — inherits STATE
- City
- — inherits STATE
ZIP-level market 86323
- Home prices YoY
- -18.3%
- Active inventory
- 264
- Price-to-rent
- 7.2×
Monthly cashflow live
- Estimated rent
- $2,317 medium interval (Pro) →
- Mortgage (P&I)
- −$1,043
- Tax from tax record
- −$40 /mo · $486/yr
- Insurance
- −$83
- HOA
- −$0
- Vacancy / Maint / Mgmt
- −$487
- Net cashflow
- $664
Break-even live
Sensitivity live
| Price | -10% $777 | -5% $720 | +0% $664 | +5% $608 | +10% $551 |
|---|---|---|---|---|---|
| Rent | -10% $481 | -5% $573 | +0% $664 | +5% $756 | +10% $847 |
| Rate | -1.0pp $764 | -0.5pp $715 | base $664 | +0.5pp $613 | +1.0pp $560 |
UW: 25.0% down · 7.5% · 30yr · 1.5% tax · 5.0% vac · 8.0% maint · 8.0% mgmt
Financing live
Cash to close
- Down payment
- $49,725
- Closing costs
- $5,967
- Reserves months
- —
- Total cash needed
- —
Loan-product check · same deal, 3 products live
Conventional
25% down · 7.5% · 30yr
- Down + closing
- —
- Monthly P&I
- —
- Monthly cashflow
- —
- DSCR
- —
- Eligible?
- —
Personal DTI + credit; lowest rate.
DSCR
20% down · 8.5% · 30yr
- Down + closing
- —
- Monthly P&I
- —
- Monthly cashflow
- —
- DSCR
- —
- Eligible?
- —
No personal income docs; deal must DSCR.
Hard money
10% down · 12.0% · 12mo
- Down + closing
- —
- Monthly P&I
- —
- Monthly cashflow
- —
- DSCR
- —
- Eligible?
- —
Short-term bridge; refi at stabilization.
Rent comps 3 comps
| Address | Beds | Baths | Sqft | Rent | $/sqft | DOM | Units | Dist |
|---|---|---|---|---|---|---|---|---|
| 1732 Allerton Way Chino Valley, AZ | 4.0 | 2.0 | 1876 | $2,400 | $1.28 | 46d | 1 | 0.30mi |
| 1659 Allerton Way Chino Valley, AZ | 3.0 | 2.0 | 1629 | $2,400 | $1.47 | 46d | 1 | 0.37mi |
| 437 Galloway Dr Chino Valley, AZ | 3.0 | 2.0 | 1610 | $2,000 | $1.24 | 46d | 1 | 0.69mi |
Listing history 11 events
-
2026-05-13$198,900 Active 458-char remark
-
2026-04-21status Active
-
2026-04-21historical
-
2026-04-15status Pending
-
2026-04-01price $220,000
-
2026-02-26price $230,000
-
2026-02-19price $235,000
-
2026-02-09$240,000 Active
-
2006-05-10soldstatus $135,000
-
2005-11-14soldstatus $35,000
-
2005-07-11soldstatus $21,000
ⓘ Source: listings_history table (triggers on properties + properties_extension) + one-shot
backfill from property_details.listing_events for pre-trigger history.
Tax reassessment forecast AZ · Resets to sale price
- Current annual tax
- $486 · $40/mo
- Projected year-2 tax
- $1,313 · $109/mo
- Expected delta
- +$827/yr (+$69/mo · 170.3%)
ⓘ Screening estimate from a state-policy table — verify with the county assessor before closing.
Climate risk First Street
- Flood 1/10 Low FEMA zone X (unshaded) · 0% chance over 30 yrs
- Wildfire 4/10 Moderate
- Heat 5/10 Major 7 d/yr ≥95°F today · 17 d/yr by 30 yrs out
- Wind 1/10 Low
- Air quality 1/10 Low 0 unhealthy d/yr today · 0 by 30 yrs out
Nearby sold comps map
Loading sold comps map…
Walkable amenities ~0.75 mi
Loading nearby amenities…
Taxation est. · year 1
- Rental income
- $27,804
- − Mortgage interest
- −$11,141
- − Property taxes
- −$486
- − Insurance
- −$994
- − Repairs & maintenance
- −$2,224
- − Management
- −$2,224
- − Depreciation
- −$5,786
- Taxable income
- $4,948
- Est. tax owed @ 24.0%
- −$1,187
- After-tax cash flow
- $6,781/yr
For passive investors: Depreciation is non-cash, so a rental often shows a tax loss while cash-flowing — sheltering income. Rental losses are passive: they offset passive income freely, and up to $25,000/yr can offset ordinary (W-2) income if you actively participate and your MAGI is under $100k (phasing out to $0 by $150k); unused losses carry forward. On sale, claimed depreciation is recaptured at up to 25%, and gains may owe capital-gains tax (a 1031 exchange can defer both). Figures are a year-1 estimate at your 24.0% rate — not tax advice; consult a CPA.
Schools (NCES district)
- District
- Chino Valley Unified District (4474)
- NCES district ID
- 0400003
- Math proficiency
- 24% ▼ -19.00%
- Reading proficiency
- 35% ▼ -13.00%
- Median HH income
- $44,429
- Composite
- 25.22/100
- National rank
- #7505
- State rank
- #112 of 249 in AZ
Livability — Chino Valley
- Score
- 61/100
- State rank
- #154
- US rank
- #17802
Category grades
Schools grade is shown separately in the Schools card above.
Census & demographics
- Census place
- Chino Valley, AZ
- City population
- 19,297
- Population (ZIP)
- 19,297
Population outlook (Yavapai County) Hauer SSP2
- Today (2025)
- 241,389 people
- By 2030
- 249,523 · +3.4%
- By 2040
- 259,966 · +7.7%
- By 2050
- 264,736 · +9.7%
- By 2075
- 269,334 · +11.6%
- By 2100
- 256,505 · +6.3%
Race, ethnicity, and origin ACS 2023
- Neighborhood character
- Predominantly White (80%)
- Race & ethnicity
- White 80% Hispanic / Latino 15% Two or more races 10%
- Hispanic origin (detail)
- Mexican 11%
- Common ancestry
- Portuguese 5% Lithuanian 5% Romanian 3%
- Foreign-born
- 4% · Canada, Vietnam
- Languages at home
- 92% English-only · Spanish 6% German/W. Germanic 1%
Political lean MEDSL · Yavapai
- 2024 margin
- Solid R (+33.9) · D 32.6% · R 66.5%
- 2008→2024 swing
- -9.5pp toward R · 2008: -24.4pp · 2024: -33.9pp
- All cycles
- 2024: R+33.9 2020: R+29.3 2016: R+31.4 2012: R+30.7 2008: R+24.4
Not yet ingested
- Civics
- —
Market trends
- HPI YoY
- ▼ -91.73%
- Current HPI
- 410.5632
- Rent YoY
- —
- Metro
- —
- State GDP YoY
- ▲ 4.54%
- F500 in state
- 20
Industry mix (Fortune 500 HQ in AZ)
| Industry | F500 HQs | Revenue |
|---|---|---|
| Technology | 2 | $13B |
|
||
| Mining / Metals | 1 | $23B |
|
||
| Environmental Services | 1 | $16B |
|
||
| Metals / Steel | 1 | $14B |
|
||
| Technology Distribution | 1 | $9B |
|
||
| Homebuilding | 1 | $8B |
|
||
Price history
+757.1% since first listed13 events — show timeline
- 2026-06-08 Sold (MLS) $180,000 PAARMLS as Distributed by MLS Grid
- 2026-05-22 Pending — PAARMLS as Distributed by MLS Grid
- 2026-05-13 Listed $198,900 PAARMLS as Distributed by MLS Grid
- 2026-04-21 Relisted — PAARMLS as Distributed by MLS Grid
- 2026-04-21 Listing Removed — PAARMLS as Distributed by MLS Grid
- 2026-04-15 Pending — PAARMLS as Distributed by MLS Grid
- 2026-04-01 Price Changed $220,000 PAARMLS as Distributed by MLS Grid
- 2026-02-26 Price Changed $230,000 PAARMLS as Distributed by MLS Grid
- 2026-02-19 Price Changed $235,000 PAARMLS as Distributed by MLS Grid
- 2026-02-09 Listed $240,000 PAARMLS as Distributed by MLS Grid
- 2006-05-10 Sold (Public Records) $135,000 Public Records
- 2005-11-14 Sold (Public Records) $35,000 Public Records
- 2005-07-11 Sold (Public Records) $21,000 Public Records
Property tax history
+0.9%/yrLatest (2025): $486 · +4.5% YoY. Source: county tax records.
Cash-flow waterfall
monthlySold comps — $/sqft
last 12 mo · ≤1 miLoading sold comps…