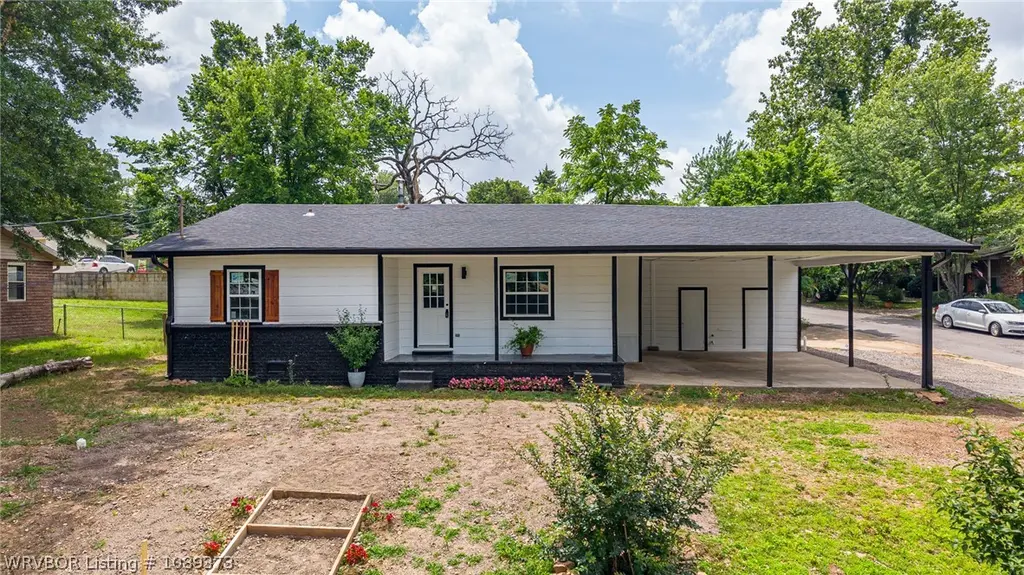
602 Cartwright St · Van Buren, AR
Flood risk 1/10 · Minimal
- FEMA flood zone
- X (unshaded)
- Chance of flooding over 30 yrs
- 0.0%
- Est. flood insurance / yr
- $507 – $1,088
Fire risk 5/10 · Moderate
- Est. fire insurance / yr
- $1,499 – $2,785
Heat risk 6/10 · Moderate
- Hot days now (above 111°F)
- 7 days/yr
- Hot days in 30 yrs
- 20 days/yr
Wind risk 2/10 · Minimal
- Chance of severe wind over 30 yrs
- 2.0%
Air-quality risk 2/10 · Minimal
- Unhealthy air days now
- 1 days/yr
- Unhealthy air days in 30 yrs
- 1 days/yr
Risk factors via First Street. Map © Google.
Why this score? — see what drove the C- grade
The composite is a weighted blend of 9 inputs, each scored 0–100. Each bar is that input's sub-score; the figure is the points it added to the 100-point composite (weight × sub-score).
- ARV discount +15.0/15.0
- Cash flow +14.5/30.0
- DSCR +4.4/10.0
- 1% rule +4.0/10.0
- Rent growth +3.7/5.0
- Livability +3.5/5.0
- Schools +3.4/10.0
- Condition / age +2.5/5.0
- Appreciation +0.0/10.0
$167,000
🖨 Deal sheet (PDF) 📄 Offer letter ✓ Due diligence
Listing remarks MLS
Great location on corner lot and close schools, dining and businesses. This 2-3 bedroom home with a bath and a half and bonus room needs an experienced remodeler to bring this home back to it's glory days. Ramp and window units do not remain. Call for your private showing.
Key facts
- Private bath
- Carport
- Renovated kitchen
Tags
Property features AI
Exterior
- Parking: Attached carport; Carport with 2 covered spaces; Gravel parking
- Security: Smoke detector(s)
- Utilities: Public water; Public sewer; Electricity available; Water available; Sewer available
- Home design: Single family residence; One story
- Construction: Built with vinyl siding; Shingle roof; Slab foundation
- Exterior features: Porch; Outbuilding; Corner lot; Public maintained road
Interior
- Kitchen: Dishwasher; Oven
- Flooring: Vinyl
- Bathrooms: 2 full bathrooms
- Heating & cooling: Central heating; Central air; Ceiling fan(s)
- Interior features: Ceiling fans; Eat-in kitchen; Walk-in closet(s); Smoke detector(s)
- Laundry & utility: Washer hookup; Electric dryer hookup; Electric water heater
Neighborhood map
What this means for you Summary
Snapshot
- This is a 4-bed/1.5-bath single-family listed at $167k.
Deal economics
- At list price, monthly cash flow is $38 ($453/yr) — positive.
- The deal already cash-flows at list — no discount required.
- To meet the 1% rule (rent ≥ 1% of price), the offer needs to be $151k (9.7% below list).
- Recommended offer: $151k (9.7% below list) — sets the bar for 1% rule.
- Cap rate 6.6% vs local median 3.8% in Van Buren — top-decile yield for the area; either an underpriced asset or a hidden risk that comps aren't pricing in. Stress-test before assuming the spread holds.
Location & tenants
- Location reads 69/100 on livability (#75 in AR) — a middle-class / working-renter tenant base. Strengths: cost of living A+, housing A+, health & safety A; Watch: employment D, crime D-, amenities F.
- Van Buren School District (suburban): math 41% / reading 41% proficiency, ranked #62 of 238 in AR (top 26%) — families likely to look elsewhere, expect single-tenant / working-renter base with shorter leases.
- Zoned schools: Parkview Elementary School (math 59% / reading 51%, grade C, #59 of 454 statewide, top 13%, 413 students, 54% FRL); Northridge Middle School (math 54% / reading 51%, grade C+, #27 of 201 statewide, top 14%, 753 students, 46% FRL); Van Buren High School (math 25% / reading 44%, grade F, #92 of 292 statewide, top 37%, 1,228 students, 48% FRL) — zoned schools at 49% FRL track the district average.
- Market conditions: Rents rising fast (+4.8%/yr); 249 active listings in the ZIP; 6 comparable units currently listed for rent nearby; rentals at typical pace (median 15d on market — plan ~3-4 weeks tenant-placement turnaround); 47 units permitted in Crawford County in 2024 (0 in 5+ unit buildings).
Forward outlook
- Local home prices are declining (-3.0%/yr); year-one equity from $1k of loan paydown is wiped out by about $5k of value loss. Plan a longer hold.
- Crawford County population projected to shrink 7% by 2050 — rents likely to lag national; underwrite the cash flow, not the appreciation.
Negotiation context
- Only 2 days on market — expect competitive offers; lowballing is unlikely to land.
- 2 sale attempts since 2y ago with the ask held roughly flat each time — persistent listings suggest the price (not the market) is what's stuck; bring a comps-based counter.
- Current owner paid $65k; list at $167k implies a 157% gain — meaningful room to come down on a strong offer.
Risks & watch-outs
- Climate carrying-cost: moderate wildfire risk; extreme-heat days projected 7→20/yr by 2055 (HVAC capex compounding) — expect insurance premiums to compound above CPI over the hold.
Questions for the listing agent
- Built in 1965 — when were the roof, HVAC, electrical panel, plumbing, and water heater last replaced?
- Is there a deadline driving the sale (1031 exchange, divorce, estate, relocation)? That informs how much negotiation room exists.
- Crime grade is D in this area — have there been break-ins, vandalism, or insurance claims at this property in the last 3 years? What carrier currently insures it and at what premium?
- What's the average days-on-market for RENTAL listings here right now (not sales)? A rising rental-DOM trend means longer vacancies and softer asking-rent achievability than the comps imply.
- What's the recent tenant-quality profile in this submarket — average credit score on applications, eviction rate, late-payment / NSF rate, and stable-employment percentage? A property-management company in the area should have these aggregated.
- How much new for-sale + rental construction is in the pipeline within 1–3 miles? Heavy new supply typically softens prices + rents 12–24 months out; constrained supply supports both.
Investment metrics
- 1% rule
- 0.90% ✗
- Cap rate
- 6.56%
- Cash-on-cash
- 0.97%
- DSCR
- 1.04
- GRM
- 9.2
CMA / ARV
- ARV (on-the-fly)
- $221,670
- Comps found
- 12
Show comp detail 12 sales within ~0.75 mi
| Address | Dist | Beds/Ba | Sqft | Sold | Price | $/sf | Match |
|---|---|---|---|---|---|---|---|
| 1507 9th St | 0.21mi | 3/2.0 (-1) | 1,726 (+5%) | 4mo | $258,000 | $149 | 72 |
| 1401 N 10th St | 0.33mi | 3/2.0 (-1) | 1,584 (-4%) | 4mo | $207,000 | $131 | 68 |
| 1513 N 9th St | 0.22mi | 3/2.0 (-1) | 1,518 (-8%) | 5mo | $235,000 | $155 | 66 |
| 1104 Northview Dr | 0.42mi | 3/2.0 (-1) | 1,811 (+10%) | 0mo | $215,330 | $119 | 56 |
| 1201 Lisa Ln | 0.46mi | 3/2.0 (-1) | 1,479 (-10%) | 1mo | $174,900 | $118 | 54 |
| 1504 N Hills Blvd | 0.65mi | 3/2.0 (-1) | 1,705 (+4%) | 5mo | $224,000 | $131 | 52 |
| 305 Azure Hills Dr | 0.55mi | 3/2.0 (-1) | 1,510 (-8%) | 2mo | $235,000 | $156 | 52 |
| 1105 Taos Dr | 0.57mi | 3/2.0 (-1) | 1,496 (-9%) | 4mo | $199,900 | $134 | 48 |
| 907 N 9th St | 0.61mi | 3/2.0 (-1) | 1,781 (+8%) | 2mo | $190,000 | $107 | 48 |
| 202 Elfen Glen St | 0.61mi | 3/2.0 (-1) | 1,508 (-8%) | 4mo | $203,500 | $135 | 47 |
| 812 N 8th St | 0.69mi | 3/2.0 (-1) | 1,450 (-12%) | 1mo | $210,000 | $145 | 40 |
| 806 N 9th St | 0.73mi | 3/2.0 (-1) | 1,415 (-14%) | 1mo | $212,000 | $150 | 35 |
Match score weights: distance 35% · size 25% · config 20% · recency 20%. Top-matched comps best support the ARV.
Projected returns pro-forma
-3.0% appreciation · 4.76% rent growth · sell at horizon
- IRR
- -12.8%
- Equity multiple
- 0.53×
- Total profit
- $-21,917
- Equity at exit
- $24,900
- IRR
- -1.3%
- Equity multiple
- 0.91×
- Total profit
- $-4,334
- Equity at exit
- $14,439
Cash invested: $46,760 (down + closing). Projections, not guarantees.
Landlord ↔ Tenant lean methodology
- Overall (STATE)
- 92 Strongly Landlord-Friendly
- State Arkansas
- 92 Strongly Landlord-Friendly · R+14
- County
- — inherits STATE
- City
- — inherits STATE
ZIP-level market 72956
- Rents YoY
- 4.8%
- Active inventory
- 249
- Price-to-rent
- 9.2×
Monthly cashflow live
- Estimated rent
- $1,509 high interval (Pro) →
- Mortgage (P&I)
- −$876
- Tax est. 1.5%
- −$209 /mo · $2,505/yr
- Insurance
- −$70
- HOA
- −$0
- Vacancy / Maint / Mgmt
- −$317
- Net cashflow
- $38
Break-even live
Sensitivity live
| Price | -10% $153 | -5% $95 | +0% $38 | +5% $-20 | +10% $-78 |
|---|---|---|---|---|---|
| Rent | -10% $-81 | -5% $-22 | +0% $38 | +5% $97 | +10% $157 |
| Rate | -1.0pp $122 | -0.5pp $80 | base $38 | +0.5pp $-6 | +1.0pp $-50 |
UW: 25.0% down · 7.5% · 30yr · 1.5% tax · 5.0% vac · 8.0% maint · 8.0% mgmt
Financing live
Cash to close
- Down payment
- $41,750
- Closing costs
- $5,010
- Reserves months
- —
- Total cash needed
- —
Loan-product check · same deal, 3 products live
Conventional
25% down · 7.5% · 30yr
- Down + closing
- —
- Monthly P&I
- —
- Monthly cashflow
- —
- DSCR
- —
- Eligible?
- —
Personal DTI + credit; lowest rate.
DSCR
20% down · 8.5% · 30yr
- Down + closing
- —
- Monthly P&I
- —
- Monthly cashflow
- —
- DSCR
- —
- Eligible?
- —
No personal income docs; deal must DSCR.
Hard money
10% down · 12.0% · 12mo
- Down + closing
- —
- Monthly P&I
- —
- Monthly cashflow
- —
- DSCR
- —
- Eligible?
- —
Short-term bridge; refi at stabilization.
Rent comps 6 comps
| Address | Beds | Baths | Sqft | Rent | $/sqft | DOM | Units | Dist |
|---|---|---|---|---|---|---|---|---|
| 306 Elfen Glen St Van Buren, AR | 3.0 | 2.0 | 1800 | $1,625 | $0.90 | 15d | 1 | 0.63mi |
| 506 Jenny Wren St Van Buren, AR | 3.0 | 2.0 | 1909 | $1,800 | $0.94 | 45d | 1 | 0.78mi |
| 1916 Timber Oaks Ln Van Buren, AR | 3.0 | 2.0 | 1102 | $1,250 | $1.13 | 15d | 1 | 0.94mi |
| 1928 Lovers Ln Van Buren, AR | 3.0 | 2.0 | 1200 | $1,050 | $0.88 | 15d | 1 | 1.03mi |
| 1518 Northridge Dr E Apt B Van Buren, AR | 3.0 | 2.5 | 1616 | $1,475 | $0.91 | 15d | 1 | 1.27mi |
| 2519 Griffin St Unit 1520958P Van Buren, AR | 4.0 | 2.0 | 1593 | $3,382 | $2.12 | 15d | 1 | 1.38mi |
Listing history 8 events
-
2026-05-31status $167,000 Pending 2 DOM
-
2026-05-30days on market $167,000 Active 2 DOM
-
2026-05-28$167,000 Active
-
2025-01-31soldstatus $65,000 Closed 273-char remark
Show marketing remark (273 chars)
Great location on corner lot and close schools, dining and businesses. This 2-3 bedroom home with a bath and a half and bonus room needs an experienced remodeler to bring this home back to it's glory days. Ramp and window units do not remain. Call for your private showing.
-
2025-01-31soldstatus $65,000
Show marketing remark (273 chars)
Great location on corner lot and close schools, dining and businesses. This 2-3 bedroom home with a bath and a half and bonus room needs an experienced remodeler to bring this home back to it's glory days. Ramp and window units do not remain. Call for your private showing.
-
2024-12-06status Pending 273-char remark
Show marketing remark (273 chars)
Great location on corner lot and close schools, dining and businesses. This 2-3 bedroom home with a bath and a half and bonus room needs an experienced remodeler to bring this home back to it's glory days. Ramp and window units do not remain. Call for your private showing.
-
2024-12-02$75,000 Active 273-char remark
Show marketing remark (273 chars)
Great location on corner lot and close schools, dining and businesses. This 2-3 bedroom home with a bath and a half and bonus room needs an experienced remodeler to bring this home back to it's glory days. Ramp and window units do not remain. Call for your private showing.
-
1987-02-17soldstatus $35,000
ⓘ Source: listings_history table (triggers on properties + properties_extension) + one-shot
backfill from property_details.listing_events for pre-trigger history.
Climate risk First Street
- Flood 1/10 Low FEMA zone X (unshaded) · 0% chance over 30 yrs
- Wildfire 5/10 Major
- Heat 6/10 Major 7 d/yr ≥111°F today · 20 d/yr by 30 yrs out
- Wind 2/10 Low 2% chance of damaging wind over 30 yrs
- Air quality 2/10 Low 1 unhealthy d/yr today · 1 by 30 yrs out
Nearby sold comps map
Loading sold comps map…
Walkable amenities ~0.75 mi
Loading nearby amenities…
Taxation est. · year 1
- Rental income
- $18,104
- − Mortgage interest
- −$9,355
- − Property taxes
- −$2,505
- − Insurance
- −$835
- − Repairs & maintenance
- −$1,448
- − Management
- −$1,448
- − Depreciation
- −$4,858
- Taxable loss
- −$2,346
- Est. tax savings @ 24.0%
- +$563
- After-tax cash flow
- $1,016/yr
For passive investors: Depreciation is non-cash, so a rental often shows a tax loss while cash-flowing — sheltering income. Rental losses are passive: they offset passive income freely, and up to $25,000/yr can offset ordinary (W-2) income if you actively participate and your MAGI is under $100k (phasing out to $0 by $150k); unused losses carry forward. On sale, claimed depreciation is recaptured at up to 25%, and gains may owe capital-gains tax (a 1031 exchange can defer both). Figures are a year-1 estimate at your 24.0% rate — not tax advice; consult a CPA.
Schools (NCES district)
- District
- Van Buren School District
- NCES district ID
- 0513410
- Math proficiency
- 41% ▼ -8.00%
- Reading proficiency
- 41% ▼ -4.00%
- Median HH income
- $40,350
- Composite
- 34.41/100
- National rank
- #5201
- State rank
- #62 of 238 in AR
Livability — Van Buren
- Score
- 69/100
- State rank
- #75
- US rank
- #8898
Category grades
Schools grade is shown separately in the Schools card above.
Census & demographics
- Census place
- Van Buren, AR
- County
- Crawford County · 34,546 people
- City population
- 34,546
- Metro
- Fort Smith, AR-OK
- Population (ZIP)
- 34,546
- Household income
- $62,988
- Rent vs Own
- Severe rent burden
- 571.0
Population outlook (Crawford County) Hauer SSP2
- Today (2025)
- 62,108 people
- By 2030
- 61,519 · -0.9%
- By 2040
- 59,735 · -3.8%
- By 2050
- 57,521 · -7.4%
- By 2075
- 53,143 · -14.4%
- By 2100
- 49,596 · -20.1%
Race, ethnicity, and origin ACS 2023
- Neighborhood character
- Predominantly White (76%)
- Race & ethnicity
- White 76% Hispanic / Latino 12% Two or more races 11% Asian 2% Native American 1% Black 1%
- Hispanic origin (detail)
- Mexican 5%
- Common ancestry
- Lithuanian 1% Slovak 1% Romanian 1%
- Foreign-born
- 6% · Canada
- Languages at home
- 89% English-only · Spanish 10%
Political lean MEDSL · Crawford
- 2024 margin
- Solid R (+58.2) · D 19.9% · R 78.1% · Other 2.0%
- 2008→2024 swing
- -12.1pp toward R · 2008: -46.0pp · 2024: -58.2pp
- All cycles
- 2024: R+58.2 2020: R+56.7 2016: R+55.0 2012: R+49.9 2008: R+46.0
Not yet ingested
- Civics
- —
Market trends
- HPI YoY
- ▼ -156.05%
- Current HPI
- 221.3066
- Rent YoY
- ▲ 4.76%
- Metro
- Fort Smith, AR-OK
- State GDP YoY
- ▲ 3.80%
- F500 in state
- 10
Industry mix (Fortune 500 HQ in AR)
| Industry | F500 HQs | Revenue |
|---|---|---|
| Retail | 1 | $681B |
|
||
| Food / Agriculture | 1 | $53B |
|
||
| Retail / Energy | 1 | $22B |
|
||
| Transportation / Logistics | 1 | $12B |
|
||
| Energy | 1 | $4B |
|
||
Price history
+377.1% since first listed6 events — show timeline
- 2026-05-28 Listed $167,000 WRVBOR
- 2025-01-31 Sold (Public Records) $65,000 Public Records
- 2025-01-31 Sold (MLS) $65,000 WRVBOR
- 2024-12-06 Pending — WRVBOR
- 2024-12-02 Listed $75,000 WRVBOR
- 1987-02-17 Sold (Public Records) $35,000 Public Records
Property tax history
-17.0%/yrLatest (2025): $26 · -79.6% YoY. Source: county tax records.
Cash-flow waterfall
monthlySold comps — $/sqft
last 12 mo · ≤1 miLoading sold comps…