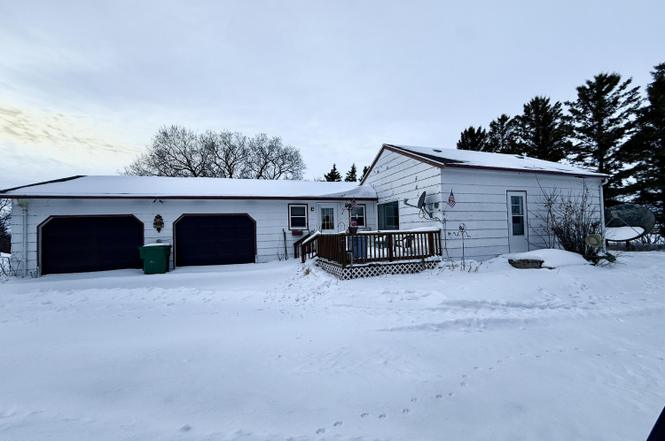
703 7th Ave Ave · Edmore, ND
Flood risk 1/10 · Minimal
- FEMA flood zone
- —
- Chance of flooding over 30 yrs
- 0.0%
- Est. flood insurance / yr
- —
Fire risk 3/10 · Minor
- Est. fire insurance / yr
- $1,289 – $2,393
Heat risk 1/10 · Minimal
- Hot days now (above 93°F)
- 7 days/yr
- Hot days in 30 yrs
- 12 days/yr
Wind risk 1/10 · Minimal
- Chance of severe wind over 30 yrs
- —
Air-quality risk 3/10 · Minor
- Unhealthy air days now
- 3 days/yr
- Unhealthy air days in 30 yrs
- 3 days/yr
Risk factors via First Street. Map © Google.
Why this score? — see what drove the B+ grade
The composite is a weighted blend of 9 inputs, each scored 0–100. Each bar is that input's sub-score; the figure is the points it added to the 100-point composite (weight × sub-score).
- Cash flow +30.0/30.0
- DSCR +10.0/10.0
- 1% rule +9.8/10.0
- ARV discount +7.5/15.0
- Schools +6.0/10.0
- Appreciation +5.0/10.0
- Livability +3.2/5.0
- Rent growth +2.5/5.0
- Condition / age +2.5/5.0
$70,000
🖨 Deal sheet 📄 Offer letter ✓ Due diligence
Key facts
- 3.58 acre lot
- 2 garage spots
- Built 1940
Property features AI
Exterior
- Parking: Attached 2-car garage
- Utilities: Public water
- Home design: Single-family residence; One level
- Construction: Metal siding
- Exterior features: Deck
Interior
- Bathrooms: One three-quarter bathroom
- Heating & cooling: Baseboard heating
- Interior features: Partial basement; 6 total rooms
Neighborhood map
What this means for you Summary
Snapshot
- This is a 2-bed/1.0-bath other listed at $70k.
Deal economics
- At list price, monthly cash flow is $408 ($5k/yr) — positive.
- The deal already cash-flows at list — no discount required.
- Meets the 1% rule at list price ($1k rent vs $70k).
- Recommended offer: $62k (12.0% below list) — sets the bar for market timing.
Location & tenants
- Location reads 63/100 on livability (#223 in ND) — a middle-class / working-renter tenant base. Strengths: cost of living A+, schools A-; Watch: health & safety D+, crime D, housing D.
- Edmore 2 (rural): math 60% / reading 80% proficiency, ranked #3 of 169 in ND (top 2%) — strong family-tenant draw, lease renewals of 3-5y typical.
- Market conditions: 2 active listings in the ZIP; 6 units permitted in Ramsey County in 2024 (5 in 5+ unit buildings).
Forward outlook
- In year one you build about $3k of equity ($484 loan paydown + $2k appreciation (3.0% local appreciation)).
- Ramsey County population projected at +10% by 2050 — modest demand growth; plan on rents tracking national, not racing it.
- At projected returns (3.0% appreciation + 3.0% rent growth), your $20k cash investment doubles in ~3 years — after that, you're playing with house money.
Negotiation context
- It's been on market 187 days — a 12% lower offer ($62k) is reasonable based on typical stale-listing flexibility.
- 2 sale attempts; this cycle's ask has dropped $28k (29%) from the opening price — seller is motivated, your offer sets the floor, not the list.
Risks & watch-outs
- Watch-outs: built in 1940 — expect roof / HVAC / electrical / plumbing capex.
Questions for the listing agent
- It's been on market 187 days. Have you received any prior offers? Is the seller open to a 12% concession, seller financing, or rate buy-down credit?
- Built in 1940 — when were the roof, HVAC, electrical panel, plumbing, and water heater last replaced?
- Why hasn't it sold? Are there any deal-killer items the seller is aware of (foundation, flood, title, zoning, code violations)?
- Is there a deadline driving the sale (1031 exchange, divorce, estate, relocation)? That informs how much negotiation room exists.
- Schools are A-rated — typically a magnet for longer-tenancy family renters. What's the average tenant stay here, and is there a school-zone premium baked into asking?
- Crime grade is D in this area — have there been break-ins, vandalism, or insurance claims at this property in the last 3 years? What carrier currently insures it and at what premium?
- What's the average days-on-market for RENTAL listings here right now (not sales)? A rising rental-DOM trend means longer vacancies and softer asking-rent achievability than the comps imply.
- What's the recent tenant-quality profile in this submarket — average credit score on applications, eviction rate, late-payment / NSF rate, and stable-employment percentage? A property-management company in the area should have these aggregated.
- How much new for-sale + rental construction is in the pipeline within 1–3 miles? Heavy new supply typically softens prices + rents 12–24 months out; constrained supply supports both.
Investment metrics
- 1% rule
- 1.48% ✓
- Cap rate
- 13.29%
- Cash-on-cash
- 25.00%
- DSCR
- 2.11
- GRM
- 5.6
CMA / ARV
No comps found within radius.
Projected returns pro-forma
3.0% appreciation · 3.0% rent growth · sell at horizon
- IRR
- 31.1%
- Equity multiple
- 2.76×
- Total profit
- $34,414
- Equity at exit
- $31,475
- IRR
- 31.4%
- Equity multiple
- 5.39×
- Total profit
- $86,032
- Equity at exit
- $48,507
Cash invested: $19,600 (down + closing). Projections, not guarantees.
Landlord ↔ Tenant lean methodology
- Overall (STATE)
- 82 Strongly Landlord-Friendly
- State North Dakota
- 82 Strongly Landlord-Friendly · R+20
- County
- — inherits STATE
- City
- — inherits STATE
ZIP-level market 58330
- Active inventory
- 2
- Price-to-rent
- 5.6×
Monthly cashflow live
- Estimated rent
- $1,039 medium interval (Pro) →
- Mortgage (P&I)
- −$367
- Tax from tax record
- −$16 /mo · $192/yr
- Insurance
- −$29
- HOA
- −$0
- Vacancy / Maint / Mgmt
- −$218
- Net cashflow
- $408
Break-even live
UW: 25.0% down · 7.5% · 30yr · 1.5% tax · 5.0% vac · 8.0% maint · 8.0% mgmt
Financing live
Cash to close
- Down payment
- $17,500
- Closing costs
- $2,100
- Reserves months
- —
- Total cash needed
- —
Loan-product check · same deal, 3 products live
Conventional
25% down · 7.5% · 30yr
- Down + closing
- —
- Monthly P&I
- —
- Monthly cashflow
- —
- DSCR
- —
- Eligible?
- —
Personal DTI + credit; lowest rate.
DSCR
20% down · 8.5% · 30yr
- Down + closing
- —
- Monthly P&I
- —
- Monthly cashflow
- —
- DSCR
- —
- Eligible?
- —
No personal income docs; deal must DSCR.
Hard money
10% down · 12.0% · 12mo
- Down + closing
- —
- Monthly P&I
- —
- Monthly cashflow
- —
- DSCR
- —
- Eligible?
- —
Short-term bridge; refi at stabilization.
Listing history 18 events
-
2026-06-16days on market $70,000 Active 187 DOM
-
2026-06-15days on market $70,000 Active 186 DOM
-
2026-06-13days on market $70,000 Active 184 DOM
-
2026-06-12days on market $70,000 Active 183 DOM
-
2026-06-09days on market $70,000 Active 180 DOM
-
2026-06-08days on market $70,000 Active 179 DOM
-
2026-06-07days on market $70,000 Active 178 DOM
-
2026-06-05days on market $70,000 Active 176 DOM
-
2026-06-04days on market $70,000 Active 174 DOM
-
2026-06-02days on market $70,000 Active 173 DOM
-
2026-06-01days on market $70,000 Active 172 DOM
-
2026-05-31days on market $70,000 Active 171 DOM
-
2026-05-12status Active
-
2026-04-30historical Active Under Contract
-
2026-04-16price $70,000
-
2026-04-01price $75,000
-
2026-02-17price $86,000
-
2025-12-11$98,500 Active
ⓘ Source: listings_history table (triggers on properties + properties_extension) + one-shot
backfill from property_details.listing_events for pre-trigger history.
Tax reassessment forecast ND · Resets to sale price
- Current annual tax
- $192 · $16/mo
- Projected year-2 tax
- $686 · $57/mo
- Expected delta
- +$494/yr (+$41/mo · 256.5%)
ⓘ Screening estimate from a state-policy table — verify with the county assessor before closing.
Climate risk First Street
- Flood 1/10 Low 0% chance over 30 yrs
- Wildfire 3/10 Moderate
- Heat 1/10 Low 7 d/yr ≥93°F today · 12 d/yr by 30 yrs out
- Wind 1/10 Low
- Air quality 3/10 Moderate 3 unhealthy d/yr today · 3 by 30 yrs out
Nearby sold comps map
Loading sold comps map…
Walkable amenities ~0.75 mi
Loading nearby amenities…
Taxation est. · year 1
- Rental income
- $12,466
- − Mortgage interest
- −$3,921
- − Property taxes
- −$192
- − Insurance
- −$350
- − Repairs & maintenance
- −$997
- − Management
- −$997
- − Depreciation
- −$2,036
- Taxable income
- $3,972
- Est. tax owed @ 24.0%
- −$953
- After-tax cash flow
- $3,947/yr
For passive investors: Depreciation is non-cash, so a rental often shows a tax loss while cash-flowing — sheltering income. Rental losses are passive: they offset passive income freely, and up to $25,000/yr can offset ordinary (W-2) income if you actively participate and your MAGI is under $100k (phasing out to $0 by $150k); unused losses carry forward. On sale, claimed depreciation is recaptured at up to 25%, and gains may owe capital-gains tax (a 1031 exchange can defer both). Figures are a year-1 estimate at your 24.0% rate — not tax advice; consult a CPA.
Schools (NCES district)
- District
- Edmore 2
- NCES district ID
- 3805950
- Math proficiency
- 60% ▬ 0.00%
- Reading proficiency
- 80% ▲ 20.00%
- Median HH income
- $47,090
- Composite
- 60.25/100
- National rank
- #1744
- State rank
- #3 of 169 in ND
Livability — Edmore
- Score
- 63/100
- State rank
- #223
- US rank
- #15285
Category grades
Schools grade is shown separately in the Schools card above.
Census & demographics
- Census place
- Edmore, ND
- Population (ZIP)
- 492
Population outlook (Ramsey County) Hauer SSP2
- Today (2025)
- 11,910 people
- By 2030
- 12,089 · +1.5%
- By 2040
- 12,568 · +5.5%
- By 2050
- 13,136 · +10.3%
- By 2075
- 16,531 · +38.8%
- By 2100
- 20,500 · +72.1%
Race, ethnicity, and origin ACS 2023
- Neighborhood character
- Predominantly White (91%)
- Race & ethnicity
- White 91% Hispanic / Latino 7% Two or more races 1%
- Hispanic origin (detail)
- Common ancestry
- Portuguese 53% Romanian 4% Iranian 3%
- Foreign-born
- 7% · Canada
- Languages at home
- 95% English-only · Spanish 4% Other Indo-European 1%
Political lean MEDSL · Ramsey
- 2024 margin
- Solid R (+40.3) · D 29.1% · R 69.3% · Other 1.6%
- 2008→2024 swing
- -39.3pp toward R · 2008: -1.0pp · 2024: -40.3pp
- All cycles
- 2024: R+40.3 2020: R+36.1 2016: R+32.8 2012: R+10.0 2008: R+1.0
Not yet ingested
- Civics
- —
Market trends
- HPI YoY
- —
- Current HPI
- —
- Rent YoY
- —
- Metro
- —
- State GDP YoY
- ▲ 2.09%
- F500 in state
- 2
Industry mix (Fortune 500 HQ in ND)
| Industry | F500 HQs | Revenue |
|---|---|---|
| Utilities / Construction | 1 | $6B |
|
||
Price history
-28.9% since first listed6 events — show timeline
- 2026-05-12 Relisted — GFAAR
- 2026-04-30 Contingent — GFAAR
- 2026-04-16 Price Changed $70,000 GFAAR
- 2026-04-01 Price Changed $75,000 GFAAR
- 2026-02-17 Price Changed $86,000 GFAAR
- 2025-12-11 Listed $98,500 GFAAR
Property tax history
+30.9%/yrLatest (2022): $192 · +30.9% YoY. Source: county tax records.
Cash-flow waterfall
monthlySold comps — $/sqft
last 12 mo · ≤1 miLoading sold comps…