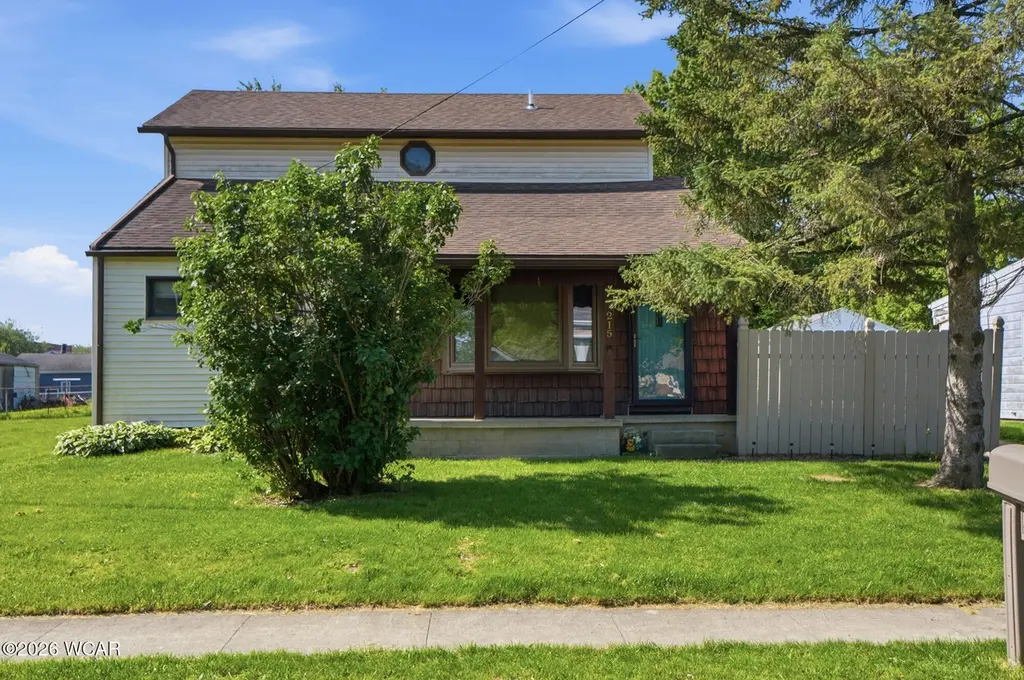
215 W Michigan Ave · Lima, OH
Flood risk 1/10 · Minimal
- FEMA flood zone
- X (unshaded)
- Chance of flooding over 30 yrs
- 0.0%
- Est. flood insurance / yr
- $473 – $860
Fire risk 1/10 · Minimal
- Est. fire insurance / yr
- $713 – $1,323
Heat risk 3/10 · Minor
- Hot days now (above 100°F)
- 7 days/yr
- Hot days in 30 yrs
- 18 days/yr
Wind risk 2/10 · Minimal
- Chance of severe wind over 30 yrs
- —
Air-quality risk 2/10 · Minimal
- Unhealthy air days now
- 1 days/yr
- Unhealthy air days in 30 yrs
- 2 days/yr
Risk factors via First Street. Map © Google.
Why this score? — see what drove the B- grade
The composite is a weighted blend of 9 inputs, each scored 0–100. Each bar is that input's sub-score; the figure is the points it added to the 100-point composite (weight × sub-score).
- Cash flow +27.5/30.0
- ARV discount +15.0/15.0
- DSCR +9.6/10.0
- 1% rule +6.8/10.0
- Livability +3.2/5.0
- Schools +2.6/10.0
- Rent growth +2.5/5.0
- Condition / age +2.5/5.0
- Appreciation +0.0/10.0
$139,900
🖨 Deal sheet 📄 Offer letter ✓ Due diligence
Listing remarks
Welcome home to this spacious 3-bedroom, 2-bath home offering over 1,600+ square feet of comfortable living space in a convenient location near St. Gerard School. This well-maintained property features two separate living areas, giving you plenty of room to spread out, entertain, or create a home office or play space. You'll appreciate the abundance of closet space and storage throughout, along with fresh paint and new carpet that give the home a clean, updated feel. The layout offers both functionality and flexibility. Close to shopping and major traffic corridors. Outside, the home offers excellent curb appeal and a welcoming presence from the moment you arrive. With generous living space
Key facts
- 4,356 sq ft lot
- Built 1953
- Listed 3 days
Property features AI
Exterior
- Parking: No garage; No designated parking
- Utilities: Public water; Public sewer; Electricity connected; Water connected
- Home design: Single-family residence; Two levels
- Construction: Vinyl siding; Wood siding; Built with a foundation (details not specified)
- Exterior features: Covered patio and porch; Porch; Shed(s)
Interior
- Kitchen: Dishwasher
- Flooring: Carpet; Laminate; Tile
- Bathrooms: 2 full bathrooms
- Heating & cooling: Central air (heat pump); Forced air heating; Electric heating; Wood heating
- Interior features: Dishwasher; Fireplace in the living room; Carpet, laminate and tile flooring; 8 total rooms
Neighborhood map
What this means for you Summary
Snapshot
- This is a 3-bed/2.0-bath single-family listed at $140k.
Deal economics
- At list price, monthly cash flow is $413 ($5k/yr) — positive.
- The deal already cash-flows at list — no discount required.
- Meets the 1% rule at list price ($2k rent vs $140k).
- Cap rate 9.8% vs local median 7.7% in Lima — meaningfully above typical; check what's discounted (condition, days-on-market, listing class) to confirm the premium yield is real.
Location & tenants
- Location reads 64/100 on livability (#787 in OH) — a middle-class / working-renter tenant base. Strengths: cost of living A+, housing A+, health & safety A-; Watch: crime F, amenities F, commute F.
- Lima City (urban): math 29% / reading 36% proficiency, ranked #575 of 656 in OH (top 88%) — families likely to look elsewhere, expect single-tenant / working-renter base with shorter leases; 83% free/reduced lunch — lower-income household profile, screen leases tightly.
- Market conditions: 74 active listings in the ZIP; 4 comparable units currently listed for rent nearby; rentals lingering (median 44d on market — plan ~5-8 weeks vacancy on turnover, expect pricing pressure); 100% of comp listings sitting > 30 days — soft ceiling on asking rent; 88 units permitted in Allen County in 2024 (0 in 5+ unit buildings).
- This rent runs 38% of the median local income ($52k/yr) — at the standard rent-burdened threshold; future hikes will face affordability resistance.
Forward outlook
- Local home prices are declining (-3.0%/yr); year-one equity from $967 of loan paydown is wiped out by about $4k of value loss. Plan a longer hold.
- Allen County population projected at -14% by 2050 — secular population decline; favor cash flow + early exit over multi-decade hold.
- At projected returns (-3.0% appreciation + 3.0% rent growth), your $39k cash investment doubles in ~9 years — after that, you're playing with house money.
Negotiation context
- Only 3 days on market — expect competitive offers; lowballing is unlikely to land.
Risks & watch-outs
- Watch-outs: built in 1953 — expect roof / HVAC / electrical / plumbing capex.
Questions for the listing agent
- Built in 1953 — when were the roof, HVAC, electrical panel, plumbing, and water heater last replaced?
- Is there a deadline driving the sale (1031 exchange, divorce, estate, relocation)? That informs how much negotiation room exists.
- Crime grade is F in this area — have there been break-ins, vandalism, or insurance claims at this property in the last 3 years? What carrier currently insures it and at what premium?
- What's the average days-on-market for RENTAL listings here right now (not sales)? A rising rental-DOM trend means longer vacancies and softer asking-rent achievability than the comps imply.
- What's the recent tenant-quality profile in this submarket — average credit score on applications, eviction rate, late-payment / NSF rate, and stable-employment percentage? A property-management company in the area should have these aggregated.
- How much new for-sale + rental construction is in the pipeline within 1–3 miles? Heavy new supply typically softens prices + rents 12–24 months out; constrained supply supports both.
Investment metrics
- 1% rule
- 1.18% ✓
- Cap rate
- 9.84%
- Cash-on-cash
- 12.66%
- DSCR
- 1.56
- GRM
- 7.0
CMA / ARV
- ARV (on-the-fly)
- $184,704
- Comps found
- 12
Show comp detail 12 sales within ~0.75 mi
| Address | Dist | Beds/Ba | Sqft | Sold | Price | $/sf | Match |
|---|---|---|---|---|---|---|---|
| 1041 N Elizabeth St | 0.33mi | 3/2.0 | 1,752 (+5%) | 5mo | $100,000 | $57 | 72 |
| 716 Ruth Ave | 0.45mi | 3/1.5 | 1,714 (+3%) | 0mo | $190,000 | $111 | 72 |
| 1776 Virginia Ave | 0.47mi | 3/2.0 | 1,520 (-9%) | 5mo | $192,000 | $126 | 59 |
| 635 W Ashton Ave | 0.59mi | 3/2.0 | 1,485 (-11%) | 2mo | $188,000 | $127 | 53 |
| 720 N West St | 0.68mi | 3/2.0 | 1,496 (-10%) | 0mo | $90,000 | $60 | 51 |
| 960 N Elizabeth St | 0.42mi | 4/2.0 (+1) | 1,864 (+12%) | 10mo | $175,000 | $94 | 47 |
| 1325 Helen Ave | 0.52mi | 3/2.0 | 1,418 (-15%) | 8mo | $148,000 | $104 | 44 |
| 1033 N Main St | 0.47mi | 4/1.5 (+1) | 1,450 (-13%) | 8mo | $115,000 | $79 | 43 |
| 837 Runyan Ave | 0.72mi | 4/2.0 (+1) | 1,494 (-10%) | 9mo | $172,000 | $115 | 37 |
| 1236 Belvidere Ave | 0.69mi | 4/2.0 (+1) | 1,842 (+11%) | 10mo | $225,000 | $122 | 37 |
| 222 W Grand Ave | 0.72mi | 2/1.0 (-1) | 1,440 (-14%) | 7mo | $45,000 | $31 | 29 |
| 728 Meadowbrook Dr Dr | 0.75mi | 3/1.0 | 1,421 (-15%) | 10mo | $186,400 | $131 | 29 |
Match score weights: distance 35% · size 25% · config 20% · recency 20%. Top-matched comps best support the ARV.
Projected returns pro-forma
-3.0% appreciation · 3.0% rent growth · sell at horizon
- IRR
- 2.4%
- Equity multiple
- 1.09×
- Total profit
- $3,630
- Equity at exit
- $20,860
- IRR
- 12.0%
- Equity multiple
- 1.94×
- Total profit
- $36,973
- Equity at exit
- $12,096
Cash invested: $39,172 (down + closing). Projections, not guarantees.
Landlord ↔ Tenant lean methodology
- Overall (STATE)
- 73 Landlord-Friendly
- State Ohio
- 73 Landlord-Friendly · R+6
- County
- — inherits STATE
- City
- — inherits STATE
ZIP-level market 45801
- Active inventory
- 74
- Price-to-rent
- 7.0×
Monthly cashflow live
- Estimated rent
- $1,656 medium interval (Pro) →
- Mortgage (P&I)
- −$734
- Tax from tax record
- −$103 /mo · $1,236/yr
- Insurance
- −$58
- HOA
- −$0
- Vacancy / Maint / Mgmt
- −$348
- Net cashflow
- $413
Break-even live
UW: 25.0% down · 7.5% · 30yr · 1.5% tax · 5.0% vac · 8.0% maint · 8.0% mgmt
Financing live
Cash to close
- Down payment
- $34,975
- Closing costs
- $4,197
- Reserves months
- —
- Total cash needed
- —
Loan-product check · same deal, 3 products live
Conventional
25% down · 7.5% · 30yr
- Down + closing
- —
- Monthly P&I
- —
- Monthly cashflow
- —
- DSCR
- —
- Eligible?
- —
Personal DTI + credit; lowest rate.
DSCR
20% down · 8.5% · 30yr
- Down + closing
- —
- Monthly P&I
- —
- Monthly cashflow
- —
- DSCR
- —
- Eligible?
- —
No personal income docs; deal must DSCR.
Hard money
10% down · 12.0% · 12mo
- Down + closing
- —
- Monthly P&I
- —
- Monthly cashflow
- —
- DSCR
- —
- Eligible?
- —
Short-term bridge; refi at stabilization.
Rent comps 4 comps
| Address | Beds | Baths | Sqft | Rent | $/sqft | DOM | Units | Dist |
|---|---|---|---|---|---|---|---|---|
| 330 W Ashton Ave Lima, OH | 3.0 | 1.0 | 1288 | $2,000 | $1.55 | 43d | 1 | 0.37mi |
| 555 Haller St Lima, OH | 3.0 | 2.0 | 1953 | $1,700 | $0.87 | 43d | 1 | 1.01mi |
| 420 N Baxter St Lima, OH | 3.0 | 2.0 | 1386 | $1,200 | $0.87 | 43d | 1 | 1.21mi |
| 43 Town Sq Lima, OH | 2.0–3.0 | 1.0–2.0 | 1100 | $1,413 | $1.28 | 43d | 9 | 1.44mi |
Listing history 2 events
-
2026-05-22status Pending
-
2026-05-18$139,900 Active
ⓘ Source: listings_history table (triggers on properties + properties_extension) + one-shot
backfill from property_details.listing_events for pre-trigger history.
Tax reassessment forecast OH · Partial reset (capped growth)
- Current annual tax
- $1,236 · $103/mo
- Projected year-2 tax
- $1,709 · $142/mo
- Expected delta
- +$473/yr (+$39/mo · 38.3%)
ⓘ Screening estimate from a state-policy table — verify with the county assessor before closing.
Climate risk First Street
- Flood 1/10 Low FEMA zone X (unshaded) · 0% chance over 30 yrs
- Wildfire 1/10 Low
- Heat 3/10 Moderate 7 d/yr ≥100°F today · 18 d/yr by 30 yrs out
- Wind 2/10 Low
- Air quality 2/10 Low 1 unhealthy d/yr today · 2 by 30 yrs out
Nearby sold comps map
Loading sold comps map…
Walkable amenities ~0.75 mi
Loading nearby amenities…
Taxation est. · year 1
- Rental income
- $19,871
- − Mortgage interest
- −$7,837
- − Property taxes
- −$1,236
- − Insurance
- −$700
- − Repairs & maintenance
- −$1,590
- − Management
- −$1,590
- − Depreciation
- −$4,070
- Taxable income
- $2,850
- Est. tax owed @ 24.0%
- −$684
- After-tax cash flow
- $4,275/yr
For passive investors: Depreciation is non-cash, so a rental often shows a tax loss while cash-flowing — sheltering income. Rental losses are passive: they offset passive income freely, and up to $25,000/yr can offset ordinary (W-2) income if you actively participate and your MAGI is under $100k (phasing out to $0 by $150k); unused losses carry forward. On sale, claimed depreciation is recaptured at up to 25%, and gains may owe capital-gains tax (a 1031 exchange can defer both). Figures are a year-1 estimate at your 24.0% rate — not tax advice; consult a CPA.
Schools (NCES district)
- District
- Lima City
- NCES district ID
- 3904422
- Math proficiency
- 29% ▼ -13.00%
- Reading proficiency
- 36% ▼ -6.00%
- Median HH income
- $29,685
- Composite
- 26.31/100
- National rank
- #7243
- State rank
- #575 of 656 in OH
Livability — Lima
- Score
- 64/100
- State rank
- #787
- US rank
- #14288
Category grades
Schools grade is shown separately in the Schools card above.
Census & demographics
- Census place
- Lima, OH
- County
- Allen County · 21,739 people
- City population
- 21,739
- Metro
- Lima, OH
- Population (ZIP)
- 21,739
- Household income
- $51,731
- Rent vs Own
- Severe rent burden
- 1141.0
Population outlook (Allen County) Hauer SSP2
- Today (2025)
- 100,321 people
- By 2030
- 97,693 · -2.6%
- By 2040
- 91,802 · -8.5%
- By 2050
- 86,152 · -14.1%
- By 2075
- 73,659 · -26.6%
- By 2100
- 58,716 · -41.5%
Race, ethnicity, and origin ACS 2023
- Neighborhood character
- Predominantly White (71%)
- Race & ethnicity
- White 71% Black 14% Two or more races 8% Hispanic / Latino 6% Asian 1%
- Hispanic origin (detail)
- Mexican 5%
- Common ancestry
- Lithuanian 2% Italian 1% Iranian 1%
- Foreign-born
- 2% · Canada, China
- Languages at home
- 96% English-only · Spanish 2%
Political lean MEDSL · Allen
- 2024 margin
- Solid R (+44.1) · D 27.5% · R 71.6%
- 2008→2024 swing
- -23.4pp toward R · 2008: -20.7pp · 2024: -44.1pp
- All cycles
- 2024: R+44.1 2020: R+39.5 2016: R+38.2 2012: R+25.7 2008: R+20.7
Not yet ingested
- Civics
- —
Market trends
- HPI YoY
- ▼ -164.79%
- Current HPI
- 219.5329
- Rent YoY
- —
- Metro
- Lima, OH
- State GDP YoY
- ▲ 1.98%
- F500 in state
- 48
Industry mix (Fortune 500 HQ in OH)
| Industry | F500 HQs | Revenue |
|---|---|---|
| Insurance | 3 | $145B |
|
||
| Industrial Machinery | 3 | $49B |
|
||
| Financial Services | 3 | $24B |
|
||
| Consumer Goods | 2 | $93B |
|
||
| Aerospace / Defense | 2 | $47B |
|
||
| Utilities | 2 | $33B |
|
||
Price history
2 events — show timeline
- 2026-05-22 Pending — WCARE
- 2026-05-18 Listed $139,900 WCARE
Property tax history
+1.5%/yrLatest (2025): $1,236 · +0.3% YoY. Source: county tax records.
Cash-flow waterfall
monthlySold comps — $/sqft
last 12 mo · ≤1 miLoading sold comps…