21 Pear Tree Ln · Burnside, KY
Flood risk 1/10 · Minimal
- FEMA flood zone
- X (unshaded)
- Chance of flooding over 30 yrs
- 0.0%
- Est. flood insurance / yr
- $507 – $1,088
Fire risk 4/10 · Minor
- Est. fire insurance / yr
- $839 – $1,559
Heat risk 4/10 · Minor
- Hot days now (above 102°F)
- 7 days/yr
- Hot days in 30 yrs
- 20 days/yr
Wind risk 3/10 · Minor
- Chance of severe wind over 30 yrs
- 5.0%
Air-quality risk 1/10 · Minimal
- Unhealthy air days now
- 0 days/yr
- Unhealthy air days in 30 yrs
- 0 days/yr
Risk factors via First Street. Map © Google.
Why this score? — see what drove the C grade
The composite is a weighted blend of 9 inputs, each scored 0–100. Each bar is that input's sub-score; the figure is the points it added to the 100-point composite (weight × sub-score).
- Cash flow +19.2/30.0
- Appreciation +7.6/10.0
- ARV discount +7.5/15.0
- DSCR +6.1/10.0
- Schools +4.0/10.0
- 1% rule +3.7/10.0
- Livability +3.6/5.0
- Rent growth +2.5/5.0
- Condition / age +2.5/5.0
$174,900
🖨 Deal sheet (PDF) 📄 Offer letter ✓ Due diligence
Listing remarks MLS
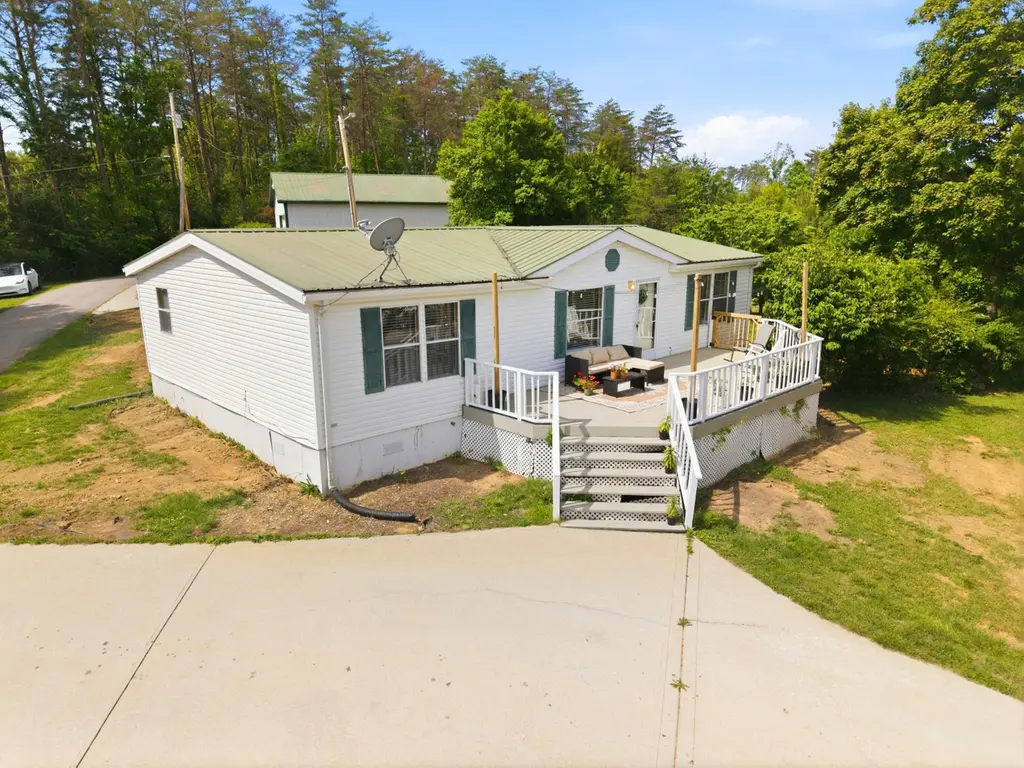
3 Bedroom 2 bath home for sale with close access to the Garland Bend Boat Ramp on Lake Cumberland. The 30 X 40 detached garage with drive through doors and circular driveway for boat and equipment is ready for your immediate use. Current resident has a life estate in the home. Located just south of Somerset and Burnside in a lakeside community for easy access to the lake. Don't miss this golden opportunity to get your lake area getaway for this extremely low price.
Key facts
- Large front deck
- Bright sunroom
- 0.6 acre lot
Tags
Property features AI
Exterior
- Parking: Detached garage; Driveway
- Utilities: Public water; Septic tank; Electricity connected; Cable available; Phone available; Water connected
- Home design: Manufactured house; One story
- Construction: Metal roof; Vinyl siding; Crawl space foundation; Built area approximately 1,596
- Exterior features: Few trees; Chain link fencing
Interior
- Kitchen: Dishwasher; Microwave; Refrigerator; Oven
- Flooring: Vinyl
- Bathrooms: 2 full bathrooms
- Heating & cooling: Electric heating with heat pump; Central air conditioning
- Interior features: Ceiling fans
- Laundry & utility: Washer hookup on main level; Electric dryer hookup
Neighborhood map
What this means for you Summary
Snapshot
- This is a 2-bed/1.5-bath manufactured listed at $175k.
Deal economics
- At list price, monthly cash flow is $188 ($2k/yr) — positive.
- The deal already cash-flows at list — no discount required.
- To meet the 1% rule (rent ≥ 1% of price), the offer needs to be $153k (12.6% below list).
- Recommended offer: $153k (12.6% below list) — sets the bar for 1% rule.
- Cap rate 7.6% vs local median 3.0% in Burnside — top-decile yield for the area; either an underpriced asset or a hidden risk that comps aren't pricing in. Stress-test before assuming the spread holds.
Location & tenants
- Location reads 71/100 on livability (#141 in KY) — a middle-class / working-renter tenant base. Strengths: crime A+, cost of living A+, health & safety A+; Watch: amenities F, commute F.
- Pulaski County (town): math 43% / reading 53% proficiency, ranked #17 of 165 in KY (top 10%) — families likely to look elsewhere, expect single-tenant / working-renter base with shorter leases.
- Zoned schools: Burnside Elementary School (math 32% / reading 42%, grade F, #255 of 676 statewide, top 42%, 432 students, 84% FRL); Southern Middle School (math 41% / reading 50%, grade D+, #32 of 217 statewide, top 15%, 941 students, 68% FRL); Southwestern High School (math 33% / reading 43%, grade F, #55 of 254 statewide, top 22%, 1,265 students, 64% FRL) — zoned schools average 72% FRL vs 56% district-wide (16 pts higher); higher-poverty schools than district average — tighter screening recommended.
- Market conditions: 84 active listings in the ZIP; 117 units permitted in Pulaski County in 2024 (50 in 5+ unit buildings).
Forward outlook
- In year one you build about $10k of equity ($1k loan paydown + $9k appreciation (5.2% local appreciation)).
- At projected returns (5.2% appreciation + 3.0% rent growth), your $49k cash investment doubles in ~4 years — after that, you're playing with house money.
- By year 4, paydown + projected appreciation supports a ~$35k cash-out refi (75% LTV) — recoverable capital for the next deal without selling this one.
Negotiation context
- It's been on market 33 days — a 3% lower offer ($170k) is reasonable based on typical stale-listing flexibility.
- 2 sale attempts since 5y ago with the ask held roughly flat each time — persistent listings suggest the price (not the market) is what's stuck; bring a comps-based counter.
- Current owner paid $50k; list at $175k implies a 250% gain — meaningful room to come down on a strong offer.
Questions for the listing agent
- It's been on market 33 days. Have you received any prior offers? Is the seller open to a 13% concession, seller financing, or rate buy-down credit?
- Is there a deadline driving the sale (1031 exchange, divorce, estate, relocation)? That informs how much negotiation room exists.
- Schools are D-rated, which usually means shorter tenancies and higher turnover. Who's the typical renter profile here, and what's been the actual vacancy rate?
- What's the average days-on-market for RENTAL listings here right now (not sales)? A rising rental-DOM trend means longer vacancies and softer asking-rent achievability than the comps imply.
- What's the recent tenant-quality profile in this submarket — average credit score on applications, eviction rate, late-payment / NSF rate, and stable-employment percentage? A property-management company in the area should have these aggregated.
- How much new for-sale + rental construction is in the pipeline within 1–3 miles? Heavy new supply typically softens prices + rents 12–24 months out; constrained supply supports both.
Investment metrics
- 1% rule
- 0.87% ✗
- Cap rate
- 7.58%
- Cash-on-cash
- 4.61%
- DSCR
- 1.21
- GRM
- 9.5
CMA / ARV
No comps found within radius.
Projected returns pro-forma
5.19% appreciation · 3.0% rent growth · sell at horizon
- IRR
- 17.2%
- Equity multiple
- 2.11×
- Total profit
- $54,132
- Equity at exit
- $101,172
- IRR
- 17.3%
- Equity multiple
- 4.11×
- Total profit
- $152,257
- Equity at exit
- $176,334
Cash invested: $48,972 (down + closing). Projections, not guarantees.
Landlord ↔ Tenant lean methodology
- Overall (STATE)
- 83 Strongly Landlord-Friendly
- State Kentucky
- 83 Strongly Landlord-Friendly · R+16
- County
- — inherits STATE
- City
- — inherits STATE
ZIP-level market 42519
- Home prices YoY
- 1.5%
- Active inventory
- 84
- Price-to-rent
- 9.5×
Monthly cashflow live
- Estimated rent
- $1,529 medium interval (Pro) →
- Mortgage (P&I)
- −$917
- Tax from tax record
- −$30 /mo · $362/yr
- Insurance
- −$73
- HOA
- −$0
- Vacancy / Maint / Mgmt
- −$321
- Net cashflow
- $188
Break-even live
Sensitivity live
| Price | -10% $287 | -5% $238 | +0% $188 | +5% $-61 | +10% $-121 |
|---|---|---|---|---|---|
| Rent | -10% $67 | -5% $128 | +0% $188 | +5% $248 | +10% $309 |
| Rate | -1.0pp $276 | -0.5pp $233 | base $188 | +0.5pp $143 | +1.0pp $97 |
UW: 25.0% down · 7.5% · 30yr · 1.5% tax · 5.0% vac · 8.0% maint · 8.0% mgmt
Financing live
Cash to close
- Down payment
- $43,725
- Closing costs
- $5,247
- Reserves months
- —
- Total cash needed
- —
Loan-product check · same deal, 3 products live
Conventional
25% down · 7.5% · 30yr
- Down + closing
- —
- Monthly P&I
- —
- Monthly cashflow
- —
- DSCR
- —
- Eligible?
- —
Personal DTI + credit; lowest rate.
DSCR
20% down · 8.5% · 30yr
- Down + closing
- —
- Monthly P&I
- —
- Monthly cashflow
- —
- DSCR
- —
- Eligible?
- —
No personal income docs; deal must DSCR.
Hard money
10% down · 12.0% · 12mo
- Down + closing
- —
- Monthly P&I
- —
- Monthly cashflow
- —
- DSCR
- —
- Eligible?
- —
Short-term bridge; refi at stabilization.
Listing history 22 events
-
2026-06-21days on market $174,900 Active 33 DOM
-
2026-06-21days on market $174,900 Active 32 DOM
-
2026-06-18days on market $174,900 Active 30 DOM
-
2026-06-17days on market $174,900 Active 29 DOM
-
2026-06-16days on market $174,900 Active 28 DOM
-
2026-06-15days on market $174,900 Active 27 DOM
-
2026-06-13days on market $174,900 Active 25 DOM
-
2026-06-12days on market $174,900 Active 24 DOM
-
2026-06-09days on market $174,900 Active 21 DOM
-
2026-06-08days on market $174,900 Active 20 DOM
-
2026-06-07days on market $174,900 Active 19 DOM
-
2026-06-07days on market $174,900 Active 18 DOM
-
2026-06-04days on market $174,900 Active 15 DOM
-
2026-06-02days on market $174,900 Active 14 DOM
-
2026-06-01days on market $174,900 Active 13 DOM
-
2026-05-31days on market $174,900 Active 12 DOM
-
2026-05-31days on market $174,900 Active 11 DOM
-
2026-05-18$174,900 Active
-
2022-01-04soldstatus $50,000
-
2021-12-29soldstatus $50,000 469-char remark
Show marketing remark (469 chars)
3 Bedroom 2 bath home for sale with close access to the Garland Bend Boat Ramp on Lake Cumberland. The 30 X 40 detached garage with drive through doors and circular driveway for boat and equipment is ready for your immediate use. Current resident has a life estate in the home. Located just south of Somerset and Burnside in a lakeside community for easy access to the lake. Don't miss this golden opportunity to get your lake area getaway for this extremely low price.
-
2021-03-25$70,000 469-char remark
Show marketing remark (469 chars)
3 Bedroom 2 bath home for sale with close access to the Garland Bend Boat Ramp on Lake Cumberland. The 30 X 40 detached garage with drive through doors and circular driveway for boat and equipment is ready for your immediate use. Current resident has a life estate in the home. Located just south of Somerset and Burnside in a lakeside community for easy access to the lake. Don't miss this golden opportunity to get your lake area getaway for this extremely low price.
-
2004-07-27soldstatus $51,000
ⓘ Source: listings_history table (triggers on properties + properties_extension) + one-shot
backfill from property_details.listing_events for pre-trigger history.
Tax reassessment forecast KY · Resets to sale price
- Current annual tax
- $362 · $30/mo
- Projected year-2 tax
- $1,504 · $125/mo
- Expected delta
- +$1,143/yr (+$95/mo · 315.9%)
ⓘ Screening estimate from a state-policy table — verify with the county assessor before closing.
Climate risk First Street
- Flood 1/10 Low FEMA zone X (unshaded) · 0% chance over 30 yrs
- Wildfire 4/10 Moderate
- Heat 4/10 Moderate 7 d/yr ≥102°F today · 20 d/yr by 30 yrs out
- Wind 3/10 Moderate 5% chance of damaging wind over 30 yrs
- Air quality 1/10 Low 0 unhealthy d/yr today · 0 by 30 yrs out
Nearby sold comps map
Loading sold comps map…
Walkable amenities ~0.75 mi
Loading nearby amenities…
Taxation est. · year 1
- Rental income
- $18,354
- − Mortgage interest
- −$9,797
- − Property taxes
- −$362
- − Insurance
- −$874
- − Repairs & maintenance
- −$1,468
- − Management
- −$1,468
- − Depreciation
- −$5,088
- Taxable loss
- −$704
- Est. tax savings @ 24.0%
- +$169
- After-tax cash flow
- $2,426/yr
For passive investors: Depreciation is non-cash, so a rental often shows a tax loss while cash-flowing — sheltering income. Rental losses are passive: they offset passive income freely, and up to $25,000/yr can offset ordinary (W-2) income if you actively participate and your MAGI is under $100k (phasing out to $0 by $150k); unused losses carry forward. On sale, claimed depreciation is recaptured at up to 25%, and gains may owe capital-gains tax (a 1031 exchange can defer both). Figures are a year-1 estimate at your 24.0% rate — not tax advice; consult a CPA.
Schools (NCES district)
- District
- Pulaski County
- NCES district ID
- 2104950
- Math proficiency
- 43% ▼ -18.00%
- Reading proficiency
- 53% ▼ -13.00%
- Median HH income
- $35,366
- Composite
- 39.69/100
- National rank
- #3906
- State rank
- #17 of 165 in KY
Livability — Burnside
- Score
- 71/100
- State rank
- #141
- US rank
- #6774
Category grades
Schools grade is shown separately in the Schools card above.
Census & demographics
- Population (ZIP)
- 2,800
Population outlook (Pulaski County) Hauer SSP2
- Today (2025)
- 65,414 people
- By 2030
- 65,828 · +0.6%
- By 2040
- 65,972 · +0.9%
- By 2050
- 65,108 · -0.5%
- By 2075
- 61,647 · -5.8%
- By 2100
- 53,613 · -18.0%
Race, ethnicity, and origin ACS 2023
- Neighborhood character
- Predominantly White (88%)
- Race & ethnicity
- White 88% Two or more races 10% Hispanic / Latino 3% Native American 1%
- Common ancestry
- Italian 2% Serbian 1% Lithuanian 1%
- Foreign-born
- 1% · Canada
Political lean MEDSL · Pulaski
- 2024 margin
- Solid R (+65.2) · D 16.9% · R 82.1% · Other 1.0%
- 2008→2024 swing
- -9.9pp toward R · 2008: -55.4pp · 2024: -65.2pp
- All cycles
- 2024: R+65.2 2020: R+62.7 2016: R+66.7 2012: R+60.5 2008: R+55.4
Not yet ingested
- Civics
- —
Market trends
- HPI YoY
- ▲ 5.19%
- Current HPI
- 358.2137
- Rent YoY
- —
- Metro
- —
- State GDP YoY
- ▲ 1.81%
- F500 in state
- 4
Industry mix (Fortune 500 HQ in KY)
| Industry | F500 HQs | Revenue |
|---|---|---|
| Healthcare | 1 | $118B |
|
||
| Food / Beverage | 1 | $7B |
|
||
Price history
+242.9% since first listed5 events — show timeline
- 2026-05-18 Listed $174,900 ImagineMLS
- 2022-01-04 Sold (Public Records) $50,000 Public Records
- 2021-12-29 Sold (MLS) $50,000 RASKMLS
- 2021-03-25 Listed $70,000 RASKMLS
- 2004-07-27 Sold (Public Records) $51,000 Public Records
Property tax history
-0.9%/yrLatest (2025): $362 · -2.3% YoY. Source: county tax records.
Cash-flow waterfall
monthlySold comps — $/sqft
last 12 mo · ≤1 miLoading sold comps…