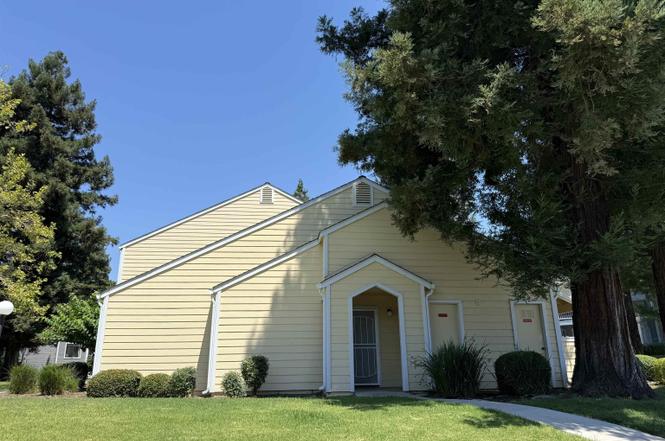
2714 Harvest Ln · Antioch, CA
Flood risk 1/10 · Minimal
- FEMA flood zone
- X (unshaded)
- Chance of flooding over 30 yrs
- 0.0%
- Est. flood insurance / yr
- $507 – $1,088
Fire risk 1/10 · Minimal
- Est. fire insurance / yr
- $659 – $1,223
Heat risk 5/10 · Moderate
- Hot days now (above 100°F)
- 6 days/yr
- Hot days in 30 yrs
- 12 days/yr
Wind risk 1/10 · Minimal
- Chance of severe wind over 30 yrs
- —
Air-quality risk 9/10 · Severe
- Unhealthy air days now
- 16 days/yr
- Unhealthy air days in 30 yrs
- 19 days/yr
Risk factors via First Street. Map © Google.
Why this score? — see what drove the D grade
The composite is a weighted blend of 9 inputs, each scored 0–100. Each bar is that input's sub-score; the figure is the points it added to the 100-point composite (weight × sub-score).
- Cash flow +12.6/30.0
- ARV discount +7.5/15.0
- 1% rule +4.0/10.0
- Schools +3.8/10.0
- DSCR +3.7/10.0
- Rent growth +3.6/5.0
- Livability +2.8/5.0
- Condition / age +2.5/5.0
- Appreciation +0.0/10.0
$368,888
🖨 Deal sheet 📄 Offer letter ✓ Due diligence
Listing remarks
Welcome home to this beautifully layout-driven 3-bedroom, 2-bathroom, single-story condo! Completely vacant and ready for an immediate quick close. Enjoy the ultimate convenience of a private street-facing entrance, with dedicated parking situated directly in front under mature, cool tree shade. Step inside to an expansive, open-concept living and dining room perfect for entertaining. The layout features an ideal in-unit laundry setup and a private balcony to chill and relax. Located just steps from the refreshing community pool—perfect for easy access this summer! With low HOA dues, this is the perfect opportunity to renovate to your taste and build instant equity. Easy to show&mdash
Key facts
- Community pool
- Private balcony
- Dedicated parking
Tags
Property features AI
Finance
- HOA & community: HOA (Hillcrest Vista HOA) with monthly fee of $450; HOA fee includes common area maintenance; Community pool included in association amenities
Exterior
- Parking: Carport
- Utilities: Has heating
- Home design: Residential condominium; Corner/end unit; Built in 1988
- Construction: Condominium construction
- Exterior features: Covered patio; No yard; Community pool
Interior
- Kitchen: Dishwasher
- Bedrooms: 3 bedrooms
- Bathrooms: 2 full bathrooms
- Heating & cooling: Heating present
- Interior features: No additional rooms listed; Corner/end unit (common walls: corner unit, end unit)
- Laundry & utility: In-unit laundry with hookups
Neighborhood map
What this means for you Summary
Snapshot
- This is a 3-bed/2.0-bath condo listed at $369k.
Deal economics
- At list price, monthly cash flow is $-51 ($-606/yr) — negative.
- To cash-flow at today's rent, offer at most $360k (2.4% below list).
- To meet the 1% rule (rent ≥ 1% of price), the offer needs to be $333k (9.8% below list).
- Recommended offer: $333k (9.8% below list) — sets the bar for 1% rule.
- Cap rate 6.1% vs local median 3.9% in Antioch — top-decile yield for the area; either an underpriced asset or a hidden risk that comps aren't pricing in. Stress-test before assuming the spread holds.
Location & tenants
- Location reads 56/100 on livability (#782 in CA) — a working-class tenant base; expect higher turnover. Strengths: employment A+, housing A+, health & safety A; Watch: schools F, crime F, amenities F.
- Antioch Unified (suburban): math 29% / reading 55% proficiency, ranked #200 of 517 in CA (top 39%) — families likely to look elsewhere, expect single-tenant / working-renter base with shorter leases.
- Market conditions: Rents rising fast (+4.3%/yr); 165 active listings in the ZIP; 4 comparable units currently listed for rent nearby; rentals leasing fast (median 13d on market — plan ~1-2 weeks tenant-placement turnaround); high-income renter base; 2,169 units permitted in Contra Costa County in 2024 (896 in 5+ unit buildings).
- This rent runs 33% of the median local income ($121k/yr) — at the standard rent-burdened threshold; future hikes will face affordability resistance.
Forward outlook
- Local home prices are declining (-3.0%/yr); year-one equity from $3k of loan paydown is wiped out by about $11k of value loss. Plan a longer hold.
- Contra Costa County population projected at +26% by 2050 — long-run rental-demand tailwind backs the buy-and-hold thesis.
Negotiation context
- Only 1 days on market — expect competitive offers; lowballing is unlikely to land.
- Current owner paid $270k; 37% above their basis — modest negotiation headroom, anchor on the comps not their cost.
Risks & watch-outs
- Climate carrying-cost: extreme-heat days projected 6→12/yr by 2055 (HVAC capex compounding) — expect insurance premiums to compound above CPI over the hold.
Questions for the listing agent
- What do current leases actually rent for vs. the listed asking? Can we see a recent rent roll and the last 12 months of T-12 income?
- What does the HOA fee cover, when was the last increase, and are there any pending special assessments or reserve-fund shortfalls?
- Any open or pending special assessments — roof, HVAC, plumbing, elevator, façade? What's the per-unit balance and payoff schedule, and is the seller paying it off at close or rolling it to the buyer?
- Is there a deadline driving the sale (1031 exchange, divorce, estate, relocation)? That informs how much negotiation room exists.
- Schools are F-rated, which usually means shorter tenancies and higher turnover. Who's the typical renter profile here, and what's been the actual vacancy rate?
- Crime grade is F in this area — have there been break-ins, vandalism, or insurance claims at this property in the last 3 years? What carrier currently insures it and at what premium?
- The area grade is low — what's the realistic commute time and amenity access for the typical tenant pool here? Any planned neighborhood developments (good or bad) we should know about?
- What's the average days-on-market for RENTAL listings here right now (not sales)? A rising rental-DOM trend means longer vacancies and softer asking-rent achievability than the comps imply.
- What's the recent tenant-quality profile in this submarket — average credit score on applications, eviction rate, late-payment / NSF rate, and stable-employment percentage? A property-management company in the area should have these aggregated.
- How much new apartment / multifamily construction is in the pipeline within 1–3 miles? Heavy new supply (>2% of stock underway) typically softens rents 12–24 months out; light construction supports rent growth.
Investment metrics
- 1% rule
- 0.90% ✗
- Cap rate
- 6.13%
- Cash-on-cash
- -0.59%
- DSCR
- 0.97
- GRM
- 9.2
CMA / ARV
No comps found within radius.
Projected returns pro-forma
-3.0% appreciation · 4.34% rent growth · sell at horizon
- IRR
- -15.7%
- Equity multiple
- 0.44×
- Total profit
- $-58,315
- Equity at exit
- $55,002
- IRR
- -4.9%
- Equity multiple
- 0.66×
- Total profit
- $-35,215
- Equity at exit
- $31,895
Cash invested: $103,289 (down + closing). Projections, not guarantees.
Landlord ↔ Tenant lean methodology
- Overall (STATE)
- 18 Strongly Tenant-Friendly
- State California
- 18 Strongly Tenant-Friendly · D+13
- County
- — inherits STATE
- City
- — inherits STATE
ZIP-level market 94531
- Home prices YoY
- -31.6%
- Rents YoY
- 4.3%
- Active inventory
- 165
- Price-to-rent
- 9.2×
Monthly cashflow live
- Estimated rent
- $3,329 medium interval (Pro) →
- Mortgage (P&I)
- −$1,934
- Tax from tax record
- −$142 /mo · $1,703/yr
- Insurance
- −$154
- HOA
- −$450
- Vacancy / Maint / Mgmt
- −$699
- Net cashflow
- $-51
Break-even live
UW: 25.0% down · 7.5% · 30yr · 1.5% tax · 5.0% vac · 8.0% maint · 8.0% mgmt
Financing live
Cash to close
- Down payment
- $92,222
- Closing costs
- $11,067
- Reserves months
- —
- Total cash needed
- —
Loan-product check · same deal, 3 products live
Conventional
25% down · 7.5% · 30yr
- Down + closing
- —
- Monthly P&I
- —
- Monthly cashflow
- —
- DSCR
- —
- Eligible?
- —
Personal DTI + credit; lowest rate.
DSCR
20% down · 8.5% · 30yr
- Down + closing
- —
- Monthly P&I
- —
- Monthly cashflow
- —
- DSCR
- —
- Eligible?
- —
No personal income docs; deal must DSCR.
Hard money
10% down · 12.0% · 12mo
- Down + closing
- —
- Monthly P&I
- —
- Monthly cashflow
- —
- DSCR
- —
- Eligible?
- —
Short-term bridge; refi at stabilization.
Rent comps 4 comps
| Address | Beds | Baths | Sqft | Rent | $/sqft | DOM | Units | Dist |
|---|---|---|---|---|---|---|---|---|
| 3001 Kodiak St Antioch, CA | 2.0 | 2.0 | 965 | $2,775 | $2.88 | 2d | 1 | 0.09mi |
| 2700 Wildflower Station Pl #98 Antioch, CA | 3.0 | 2.0 | 1150 | $2,995 | $2.60 | 12d | 1 | 0.94mi |
| 2912 Honeynut St Antioch, CA | 3.0 | 2.0 | 1380 | $3,275 | $2.37 | 12d | 1 | 1.38mi |
| 2501 Brazil Dr Antioch, CA | 3.0 | 2.5 | 1422 | $3,100 | $2.18 | 5d | 1 | 1.49mi |
HOA detail condo
- Monthly dues
- $450 · $5,400/yr
- Likely covers
- pool
- Assessments
- None detected in remarks — confirm with the listing agent.
Listing history 2 events
-
2026-06-18remarks 693-char remark
-
2026-06-18$368,888 Active 1 DOM
ⓘ Source: listings_history table (triggers on properties + properties_extension) + one-shot
backfill from property_details.listing_events for pre-trigger history.
Tax reassessment forecast CA · Resets to sale price
- Current annual tax
- $1,703 · $142/mo
- Projected year-2 tax
- $2,804 · $234/mo
- Expected delta
- +$1,101/yr (+$92/mo · 64.6%)
ⓘ Screening estimate from a state-policy table — verify with the county assessor before closing.
Climate risk First Street
- Flood 1/10 Low FEMA zone X (unshaded) · 0% chance over 30 yrs
- Wildfire 1/10 Low
- Heat 5/10 Major 6 d/yr ≥100°F today · 12 d/yr by 30 yrs out
- Wind 1/10 Low
- Air quality 9/10 Extreme 16 unhealthy d/yr today · 19 by 30 yrs out
Nearby sold comps map
Loading sold comps map…
Walkable amenities ~0.75 mi
Loading nearby amenities…
Taxation est. · year 1
- Rental income
- $39,943
- − Mortgage interest
- −$20,663
- − Property taxes
- −$1,703
- − Insurance
- −$1,844
- − Repairs & maintenance
- −$3,195
- − Management
- −$3,195
- − HOA
- −$5,400
- − Depreciation
- −$10,731
- Taxable loss
- −$6,790
- Est. tax savings @ 24.0%
- +$1,630
- After-tax cash flow
- $1,023/yr
For passive investors: Depreciation is non-cash, so a rental often shows a tax loss while cash-flowing — sheltering income. Rental losses are passive: they offset passive income freely, and up to $25,000/yr can offset ordinary (W-2) income if you actively participate and your MAGI is under $100k (phasing out to $0 by $150k); unused losses carry forward. On sale, claimed depreciation is recaptured at up to 25%, and gains may owe capital-gains tax (a 1031 exchange can defer both). Figures are a year-1 estimate at your 24.0% rate — not tax advice; consult a CPA.
Schools (NCES district)
- District
- Antioch Unified
- NCES district ID
- 0602850
- Math proficiency
- 29% ▲ 12.00%
- Reading proficiency
- 55% ▲ 25.00%
- Median HH income
- $65,935
- Composite
- 37.57/100
- National rank
- #4386
- State rank
- #200 of 517 in CA
Livability — Antioch
- Score
- 56/100
- State rank
- #782
- US rank
- #22472
Category grades
Schools grade is shown separately in the Schools card above.
Census & demographics
- Census place
- Antioch, CA
- County
- Contra Costa County · 1,059,880 people
- City population
- 116,477
- Metro
- San Francisco-Oakland-Berkeley, CA
- Population (ZIP)
- 46,387
- Household income
- $120,927
- Rent vs Own
- Severe rent burden
- 1218.0
Population outlook (Contra Costa County) Hauer SSP2
- Today (2025)
- 1,287,720 people
- By 2030
- 1,364,937 · +6.0%
- By 2040
- 1,506,209 · +17.0%
- By 2050
- 1,624,373 · +26.1%
- By 2075
- 1,853,193 · +43.9%
- By 2100
- 1,901,231 · +47.6%
Race, ethnicity, and origin ACS 2023
- Neighborhood character
- Highly diverse neighborhood (Simpson 0.78)
- Race & ethnicity
- Hispanic / Latino 26% Black 24% White 23% Asian 20% Two or more races 14% Native American 2%
- Hispanic origin (detail)
- Mexican 16%
- Common ancestry
- Italian 1% Lithuanian 1% Russian 1%
- Foreign-born
- 25% · Canada, Vietnam, China
- Languages at home
- 64% English-only · Spanish 16% Tagalog/Filipino 7% Other Indo-European 5%
Political lean MEDSL · Contra Costa
- 2024 margin
- Solid D (+38.0) · D 67.3% · R 29.4% · Other 3.3%
- 2008→2024 swing
- +0.2pp no change · 2008: 37.8pp · 2024: 38.0pp
- All cycles
- 2024: D+38.0 2020: D+45.3 2016: D+43.5 2012: D+33.7 2008: D+37.8
Not yet ingested
- Civics
- —
Market trends
- HPI YoY
- ▼ -111.21%
- Current HPI
- 240.1175
- Rent YoY
- ▲ 4.34%
- Metro
- San Francisco-Oakland-Berkeley, CA
- State GDP YoY
- ▲ 3.21%
- F500 in state
- 116
Industry mix (Fortune 500 HQ in CA)
| Industry | F500 HQs | Revenue |
|---|---|---|
| Technology | 27 | $1,492B |
|
||
| Financial Services | 3 | $174B |
|
||
| Retail | 3 | $44B |
|
||
| Insurance | 3 | $26B |
|
||
| Media / Entertainment | 2 | $115B |
|
||
| Pharmaceuticals / Biotech | 2 | $62B |
|
||
Price history
-97.4% since first listed5 events — show timeline
- 2026-06-17 Listed $368,888 bridgeMLS, Bay East AOR, or Contra Costa AOR
- 2004-05-07 Sold (Public Records) $270,000 Public Records
- 2002-03-26 Sold (Public Records) $190,000 Public Records
- 1991-04-10 Sold (Public Records) $130,000 Public Records
- 1989-09-29 Sold (Public Records) $14,000,000 Public Records
Property tax history
-2.6%/yrLatest (2025): $1,703 · +3.6% YoY. Source: county tax records.
Cash-flow waterfall
monthlySold comps — $/sqft
last 12 mo · ≤1 miLoading sold comps…