 🏗️ New Construction
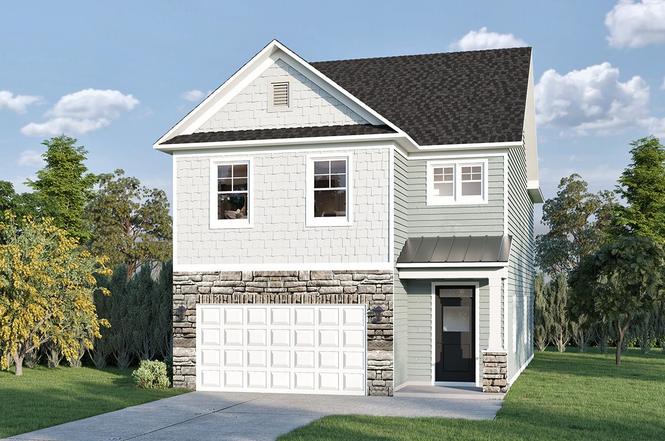
Crestfall II Plan · Graniteville, SC
Flood risk No data
- FEMA flood zone
- —
- Chance of flooding over 30 yrs
- —
- Est. flood insurance / yr
- —
Fire risk No data
- Est. fire insurance / yr
- —
Heat risk No data
- Hot days now (above threshold)
- —
- Hot days in 30 yrs
- —
Wind risk No data
- Chance of severe wind over 30 yrs
- —
Air-quality risk No data
- Unhealthy air days now
- —
- Unhealthy air days in 30 yrs
- —
Risk factors via First Street. Map © Google.
Why this score? — see what drove the D grade
The composite is a weighted blend of 9 inputs, each scored 0–100. Each bar is that input's sub-score; the figure is the points it added to the 100-point composite (weight × sub-score).
- Appreciation +9.2/10.0
- Cash flow +8.0/30.0
- ARV discount +7.5/15.0
- Schools +3.2/10.0
- Livability +3.0/5.0
- 1% rule +2.5/10.0
- Rent growth +2.5/5.0
- Condition / age +2.5/5.0
- DSCR +2.1/10.0
$287,900
🖨 Deal sheet (PDF) 📄 Offer letter ✓ Due diligence
Listing remarks
The Crestfall II is a thoughtfully designed home offering 2001 square feet of comfortable living space, perfect for families. This two-story plan includes three bedrooms and 2.5 bathrooms, providing ample space and privacy. The main level features an inviting open-concept layout seamlessly blending the family room, kitchen, and dining area, creating a perfect space for family gatherings and entertaining. A covered porch extends the living area outdoors. Upstairs, a spacious owner's suite provides a private retreat, complete with a walk-in closet and a luxurious ensuite bathroom. Additional bedrooms share a well-appointed bathroom, ensuring convenience and privacy for all. A versatile loft a
Key facts
- Covered porch
- Walk-in closet
- Versatile loft area
Tags
Property features AI
Finance
- Other: Inventory type: Plan
- Financial info: List price: $287,900
- HOA & community: HOA/community details not provided
Exterior
- Parking: 2 parking spaces
- Security: Security details not provided
- Utilities: Natural gas available; Electric service available; Public or central water/sewer details not provided
- Home design: New construction plan (Crestfall II); Active listing
- Construction: Construction details not provided
- Exterior features: Property listed as the Crestfall II plan; Address: Crestfall II Plan, Re7kps Graniteville, SC 29829
Interior
- Kitchen: Plan includes standard kitchen (details not provided)
- Bedrooms: 3 bedrooms
- Flooring: Flooring details not provided
- Bathrooms: 2 full baths and 1 half bath (2.5 total)
- Heating & cooling: Natural gas and electric forced-air heating; Central air conditioning
- Interior features: Open living area (approx. 2001 finished area)
- Laundry & utility: Laundry/utility details not provided
Neighborhood map
What this means for you Summary
Snapshot
- This is a 3-bed/2.5-bath single-family listed at $288k.
Deal economics
- At list price, monthly cash flow is $-304 ($-4k/yr) — negative.
- To cash-flow at today's rent, offer at most $258k (10.3% below list).
- To meet the 1% rule (rent ≥ 1% of price), the offer needs to be $226k (21.6% below list).
- Recommended offer: $226k (21.6% below list) — sets the bar for 1% rule.
Location & tenants
- Location reads 59/100 on livability (#240 in SC) — a working-class tenant base; expect higher turnover. Strengths: cost of living A+, crime B+; Watch: amenities F, commute F, employment F.
- Aiken 01 (suburban): math 31% / reading 44% proficiency, ranked #36 of 80 in SC (top 45%) — families likely to look elsewhere, expect single-tenant / working-renter base with shorter leases.
- Zoned schools: Byrd Elementary (math 28% / reading 36%, grade F, #369 of 597 statewide, top 64%, 657 students, 37% FRL); Leavelle Mccampbell Middle (math 19% / reading 32%, grade F, #162 of 229 statewide, top 71%, 650 students, 55% FRL); Midland Valley High (math 31% / reading 83%, grade C, #120 of 196 statewide, top 64%, 1,477 students, 62% FRL) — zoned schools at 51% FRL track the district average.
- Market conditions: 298 active listings in the ZIP; 7 comparable units currently listed for rent nearby; rentals at typical pace (median 23d on market — plan ~3-4 weeks tenant-placement turnaround); solid renter incomes; 2,500 units permitted in Aiken County in 2024 (1,023 in 5+ unit buildings).
- This rent runs 32% of the median local income ($84k/yr) — at the standard rent-burdened threshold; future hikes will face affordability resistance.
Forward outlook
- In year one you build about $27k of equity ($2k loan paydown + $25k appreciation (8.4% local appreciation)).
- Aiken County population projected at +9% by 2050 — modest demand growth; plan on rents tracking national, not racing it.
- By year 2, paydown + projected appreciation supports a ~$44k cash-out refi (75% LTV) — recoverable capital for the next deal without selling this one.
Negotiation context
- It's been on market 298 days — a 12% lower offer ($253k) is reasonable based on typical stale-listing flexibility.
Questions for the listing agent
- What do current leases actually rent for vs. the listed asking? Can we see a recent rent roll and the last 12 months of T-12 income?
- It's been on market 298 days. Have you received any prior offers? Is the seller open to a 22% concession, seller financing, or rate buy-down credit?
- Why hasn't it sold? Are there any deal-killer items the seller is aware of (foundation, flood, title, zoning, code violations)?
- Is there a deadline driving the sale (1031 exchange, divorce, estate, relocation)? That informs how much negotiation room exists.
- Schools are F-rated, which usually means shorter tenancies and higher turnover. Who's the typical renter profile here, and what's been the actual vacancy rate?
- The area grade is low — what's the realistic commute time and amenity access for the typical tenant pool here? Any planned neighborhood developments (good or bad) we should know about?
- What's the average days-on-market for RENTAL listings here right now (not sales)? A rising rental-DOM trend means longer vacancies and softer asking-rent achievability than the comps imply.
- What's the recent tenant-quality profile in this submarket — average credit score on applications, eviction rate, late-payment / NSF rate, and stable-employment percentage? A property-management company in the area should have these aggregated.
- How much new for-sale + rental construction is in the pipeline within 1–3 miles? Heavy new supply typically softens prices + rents 12–24 months out; constrained supply supports both.
Investment metrics
- 1% rule
- 0.75% ✗
- Cap rate
- 5.09%
- Cash-on-cash
- -4.31%
- DSCR
- 0.81
- GRM
- 11.1
CMA / ARV
- ARV (on-the-fly)
- $302,151
- Comps found
- 12
Show comp detail 12 sales within ~0.75 mi
| Address | Dist | Beds/Ba | Sqft | Sold | Price | $/sf | Match |
|---|---|---|---|---|---|---|---|
| 760 Brisbane Ct | 0.02mi | 3/2.5 | 2,001 (0%) | 6mo | $302,900 | $151 | 94 |
| 817 Brisbane Ct | 0.03mi | 3/2.5 | 2,001 (0%) | 7mo | $299,900 | $150 | 92 |
| 849 Brisbane Ct | 0.05mi | 3/2.5 | 1,766 (-12%) | 2mo | $269,900 | $153 | 76 |
| 828 Brisbane Ct | 0.06mi | 3/2.5 | 1,793 (-10%) | 7mo | $269,900 | $151 | 74 |
| 796 Brisbane Ct | 0.04mi | 3/2.5 | 1,766 (-12%) | 6mo | $285,000 | $161 | 74 |
| 746 Brisbane Ct | 0.01mi | 3/2.5 | 1,766 (-12%) | 8mo | $265,000 | $150 | 73 |
| 381 Anmore Ct | 0.37mi | 3/2.5 | 2,254 (+13%) | 5mo | $251,000 | $111 | 58 |
| 318 Mansell Park | 0.57mi | 3/2.5 | 1,792 (-10%) | 3mo | $268,000 | $150 | 54 |
| 338 Mansell Park | 0.58mi | 4/2.5 (+1) | 2,122 (+6%) | 6mo | $279,000 | $131 | 53 |
| 4427 Hartshorn Cir | 0.72mi | 3/2.0 | 1,900 (-5%) | 6mo | $308,255 | $162 | 51 |
| 4427 Hartshorn Cir | 0.72mi | 3/2.0 | 1,900 (-5%) | 6mo | $308,255 | $162 | 51 |
| 4213 Hartshorn Cir | 0.71mi | 4/2.5 (+1) | 1,889 (-6%) | 7mo | $269,900 | $143 | 47 |
Match score weights: distance 35% · size 25% · config 20% · recency 20%. Top-matched comps best support the ARV.
Projected returns pro-forma
8.38% appreciation · 3.0% rent growth · sell at horizon
- IRR
- 17.6%
- Equity multiple
- 2.33×
- Total profit
- $112,534
- Equity at exit
- $237,409
- IRR
- 16.7%
- Equity multiple
- 5.04×
- Total profit
- $341,415
- Equity at exit
- $478,951
Cash invested: $84,602 (down + closing). Projections, not guarantees.
Landlord ↔ Tenant lean methodology
- Overall (STATE)
- 90 Strongly Landlord-Friendly
- State South Carolina
- 90 Strongly Landlord-Friendly · R+6
- County
- — inherits STATE
- City
- — inherits STATE
ZIP-level market 29829
- Home prices YoY
- 3.0%
- Active inventory
- 298
- Price-to-rent
- 10.6×
Monthly cashflow live
- Estimated rent
- $2,258 high interval (Pro) →
- Mortgage (P&I)
- −$1,585
- Tax est. 1.5%
- −$378 /mo · $4,532/yr
- Insurance
- −$126
- HOA
- −$0
- Vacancy / Maint / Mgmt
- −$474
- Net cashflow
- $-304
Break-even live
Sensitivity live
| Price | -10% $-95 | -5% $-199 | +0% $-304 | +5% $-408 | +10% $-513 |
|---|---|---|---|---|---|
| Rent | -10% $-482 | -5% $-393 | +0% $-304 | +5% $-215 | +10% $-125 |
| Rate | -1.0pp $-152 | -0.5pp $-227 | base $-304 | +0.5pp $-382 | +1.0pp $-462 |
UW: 25.0% down · 7.5% · 30yr · 1.5% tax · 5.0% vac · 8.0% maint · 8.0% mgmt
Financing live
Cash to close
- Down payment
- $75,538
- Closing costs
- $9,065
- Reserves months
- —
- Total cash needed
- —
Loan-product check · same deal, 3 products live
Conventional
25% down · 7.5% · 30yr
- Down + closing
- —
- Monthly P&I
- —
- Monthly cashflow
- —
- DSCR
- —
- Eligible?
- —
Personal DTI + credit; lowest rate.
DSCR
20% down · 8.5% · 30yr
- Down + closing
- —
- Monthly P&I
- —
- Monthly cashflow
- —
- DSCR
- —
- Eligible?
- —
No personal income docs; deal must DSCR.
Hard money
10% down · 12.0% · 12mo
- Down + closing
- —
- Monthly P&I
- —
- Monthly cashflow
- —
- DSCR
- —
- Eligible?
- —
Short-term bridge; refi at stabilization.
Rent comps 7 comps
| Address | Beds | Baths | Sqft | Rent | $/sqft | DOM | Units | Dist |
|---|---|---|---|---|---|---|---|---|
| 860 Delta Ln Unit 860 Aiken, SC | 4.0 | 4.0 | 2336 | $2,100 | $0.90 | 16d | 1 | 0.40mi |
| 293 Mansell Park Aiken, SC | 4.0 | 2.5 | 2386 | $2,250 | $0.94 | 23d | 1 | 0.54mi |
| 266 Mansell Park Aiken, SC | 3.0 | 2.5 | 1807 | $1,950 | $1.08 | 23d | 1 | 0.57mi |
| 983 Manitou Cir Aiken, SC | 3.0 | 2.0 | 1551 | $1,980 | $1.28 | 25d | 1 | 0.63mi |
| 3124 Saint Charles Ave Aiken, SC | 3.0 | 2.0 | 1550 | $2,085 | $1.35 | 23d | 1 | 0.94mi |
| 430 Whitby Ct Aiken, SC | 3.0 | 2.5 | 1749 | $2,050 | $1.17 | 23d | 1 | 1.21mi |
| 721 Grovebury Ct Aiken, SC | 3.0 | 2.5 | 1435 | $1,750 | $1.22 | 16d | 1 | 1.29mi |
Listing history 16 events
-
2026-06-21days on market $287,900 Active 298 DOM
-
2026-06-18days on market $287,900 Active 295 DOM
-
2026-06-17days on market $287,900 Active 294 DOM
-
2026-06-16days on market $287,900 Active 293 DOM
-
2026-06-15days on market $287,900 Active 292 DOM
-
2026-06-14days on market $287,900 Active 290 DOM
-
2026-06-13days on market $287,900 Active 289 DOM
-
2026-06-10days on market $287,900 Active 287 DOM
-
2026-06-09days on market $287,900 Active 286 DOM
-
2026-06-08days on market $287,900 Active 285 DOM
-
2026-06-07days on market $287,900 Active 284 DOM
-
2026-06-03days on market $287,900 Active 280 DOM
-
2026-06-02days on market $287,900 Active 279 DOM
-
2026-06-01days on market $287,900 Active 278 DOM
-
2026-05-31days on market $287,900 Active 277 DOM
-
2026-05-30days on market $287,900 Active 276 DOM
ⓘ Source: listings_history table (triggers on properties + properties_extension) + one-shot
backfill from property_details.listing_events for pre-trigger history.
Nearby sold comps map
Loading sold comps map…
Walkable amenities ~0.75 mi
Loading nearby amenities…
Taxation est. · year 1
- Rental income
- $27,102
- − Mortgage interest
- −$16,925
- − Property taxes
- −$4,532
- − Insurance
- −$1,511
- − Repairs & maintenance
- −$2,168
- − Management
- −$2,168
- − Depreciation
- −$8,790
- Taxable loss
- −$8,992
- Est. tax savings @ 24.0%
- +$2,158
- After-tax cash flow
- $-1,488/yr
For passive investors: Depreciation is non-cash, so a rental often shows a tax loss while cash-flowing — sheltering income. Rental losses are passive: they offset passive income freely, and up to $25,000/yr can offset ordinary (W-2) income if you actively participate and your MAGI is under $100k (phasing out to $0 by $150k); unused losses carry forward. On sale, claimed depreciation is recaptured at up to 25%, and gains may owe capital-gains tax (a 1031 exchange can defer both). Figures are a year-1 estimate at your 24.0% rate — not tax advice; consult a CPA.
Schools (NCES district)
- District
- Aiken 01
- NCES district ID
- 4500720
- Math proficiency
- 31% ▼ -11.00%
- Reading proficiency
- 44% ▼ -1.00%
- Median HH income
- $45,081
- Composite
- 31.91/100
- National rank
- #5857
- State rank
- #36 of 80 in SC
Livability — Graniteville
- Score
- 59/100
- State rank
- #240
- US rank
- #19924
Category grades
Schools grade is shown separately in the Schools card above.
Census & demographics
- County
- Aiken County · 116,534 people
- City population
- 12,385
- Metro
- Augusta-Richmond County, GA-SC
- Population (ZIP)
- 12,385
- Household income
- $84,228
- Rent vs Own
- Severe rent burden
- 213.0
Population outlook (Aiken County) Hauer SSP2
- Today (2025)
- 178,003 people
- By 2030
- 182,876 · +2.7%
- By 2040
- 189,970 · +6.7%
- By 2050
- 193,840 · +8.9%
- By 2075
- 199,453 · +12.1%
- By 2100
- 192,403 · +8.1%
Race, ethnicity, and origin ACS 2023
- Neighborhood character
- Diverse neighborhood (Simpson 0.58)
- Race & ethnicity
- White 59% Black 26% Hispanic / Latino 12% Two or more races 9% Asian 1%
- Hispanic origin (detail)
- Mexican 8% Puerto Rican 1%
- Common ancestry
- Italian 2% Swedish 2% Slovak 1%
- Foreign-born
- 6% · Canada
- Languages at home
- 89% English-only · Spanish 10% Other Indo-European 1%
Political lean MEDSL · Aiken
- 2024 margin
- Strong R (+25.9) · D 36.4% · R 62.2% · Other 1.4%
- 2008→2024 swing
- -1.9pp toward R · 2008: -24.0pp · 2024: -25.9pp
- All cycles
- 2024: R+25.9 2020: R+22.7 2016: R+27.5 2012: R+26.0 2008: R+24.0
Not yet ingested
- Civics
- —
Market trends
- HPI YoY
- ▲ 8.38%
- Current HPI
- 286.4155
- Rent YoY
- —
- Metro
- Augusta-Richmond County, GA-SC
- State GDP YoY
- ▲ 4.51%
- F500 in state
- 2
Industry mix (Fortune 500 HQ in SC)
| Industry | F500 HQs | Revenue |
|---|---|---|
| Packaging | 1 | $7B |
|
||
Cash-flow waterfall
monthlySold comps — $/sqft
last 12 mo · ≤1 miLoading sold comps…