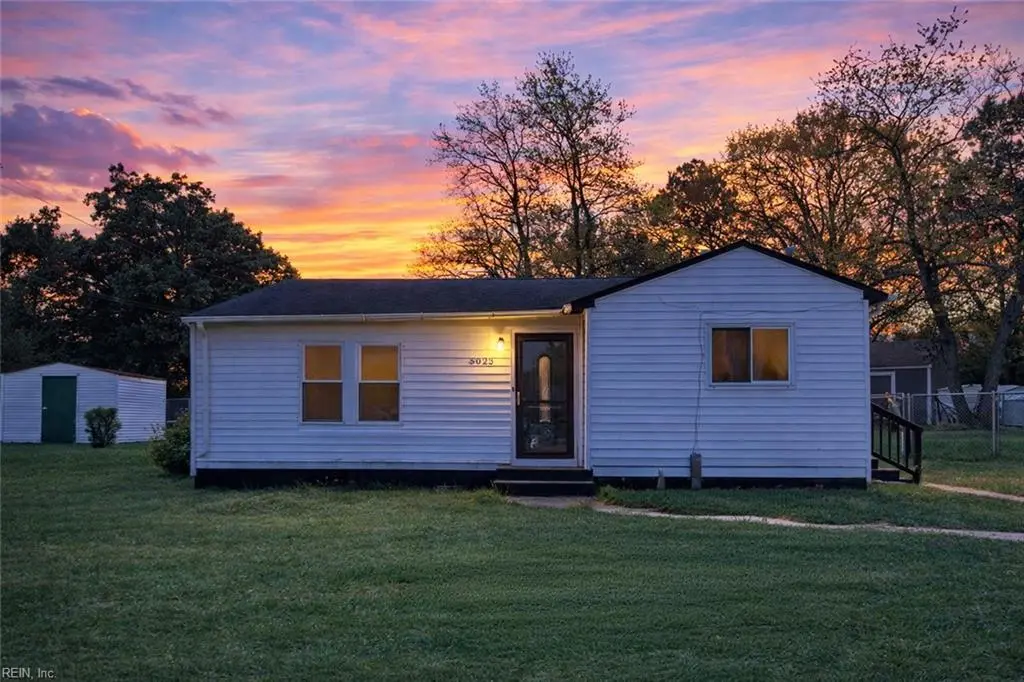
5023 Booker St · Chesapeake, VA
Flood risk 1/10 · Minimal
- FEMA flood zone
- X (unshaded)
- Chance of flooding over 30 yrs
- 0.0%
- Est. flood insurance / yr
- $507 – $1,088
Fire risk 1/10 · Minimal
- Est. fire insurance / yr
- $666 – $1,236
Heat risk 9/10 · Severe
- Hot days now (above 107°F)
- 7 days/yr
- Hot days in 30 yrs
- 16 days/yr
Wind risk 8/10 · Major
- Chance of severe wind over 30 yrs
- 80.0%
Air-quality risk 5/10 · Moderate
- Unhealthy air days now
- 6 days/yr
- Unhealthy air days in 30 yrs
- 7 days/yr
Risk factors via First Street. Map © Google.
Why this score? — see what drove the D- grade
The composite is a weighted blend of 9 inputs, each scored 0–100. Each bar is that input's sub-score; the figure is the points it added to the 100-point composite (weight × sub-score).
- Cash flow +9.3/30.0
- ARV discount +7.0/15.0
- Schools +5.8/10.0
- Rent growth +4.4/5.0
- Livability +3.5/5.0
- DSCR +2.6/10.0
- Condition / age +2.5/5.0
- 1% rule +2.0/10.0
- Appreciation +0.0/10.0
$290,000
🖨 Deal sheet 📄 Offer letter ✓ Due diligence
Listing remarks
Beautifully renovated rancher in the heart of Chesapeake! This 3BR/2BA home offers convenient one-level living with numerous updates throughout. Features include shaker-style cabinets, granite countertops, and fully remodeled bathrooms with modern finishes. Fresh paint, new LVP flooring, new carpet, updated lighting, and contemporary fixtures. Spacious backyard ideal for entertaining and extended driveway for ample parking. Move-in ready!
Key facts
- Spacious backyard
- Renovated rancher
- One-level living
Tags
Property features AI
Finance
- HOA & community: No HOA fees reported
Exterior
- Parking: Off-street parking for 3 vehicles (driveway and street spaces)
- Utilities: City/County water; City/County sewer; Gas water heater; Electric power; Central air conditioning; Heat pump
- Home design: Detached single-family ranch; Single-story with one living level; Crawlspace foundation; Simple ownership; Located in CRESTWOOD MANOR
- Construction: Vinyl exterior; Asphalt shingle roof; Crawl foundation
- Exterior features: Vinyl siding; Back chain link fence; Asphalt shingle roof
Interior
- Kitchen: Electric range; Microwave; Dishwasher; Refrigerator
- Bedrooms: Master bedroom on the first floor; One bedroom with ensuite
- Flooring: Carpet; Laminate
- Bathrooms: 2 full bathrooms; Full bathroom on the first floor
- Heating & cooling: Heat pump; Central air
- Interior features: Ceiling fan; 5 total rooms
- Laundry & utility: Washer hookup; Dryer hookup
Neighborhood map
What this means for you Summary
Snapshot
- This is a 2-bed/2.0-bath single-family listed at $290k.
Deal economics
- At list price, monthly cash flow is $-212 ($-3k/yr) — negative.
- To cash-flow at today's rent, offer at most $253k (12.9% below list).
- To meet the 1% rule (rent ≥ 1% of price), the offer needs to be $203k (30.2% below list).
- Recommended offer: $203k (30.2% below list) — sets the bar for 1% rule.
- Cap rate 5.4% vs local median 3.7% in Chesapeake — top-decile yield for the area; either an underpriced asset or a hidden risk that comps aren't pricing in. Stress-test before assuming the spread holds.
Location & tenants
- Location reads 70/100 on livability (#236 in VA) — a middle-class / working-renter tenant base. Strengths: employment A+, housing A+; Watch: crime C-, cost of living C-, amenities F.
- Chesapeake City Public School District (suburban): math 58% / reading 74% proficiency, ranked #31 of 131 in VA (top 24%) — acceptable for families but not a draw, mixed tenant base, ~2y average lease.
- Zoned schools: B.M. Williams Primary (897 students, 91% FRL); Great Bridge High (math 60% / reading 87%, grade B+, #124 of 319 statewide, top 40%, 1,624 students, 25% FRL) — zoned schools average 58% FRL vs 28% district-wide (30 pts higher); higher-poverty schools than district average — tighter screening recommended.
- Market conditions: Rents rising fast (+7.8%/yr); 282 active listings in the ZIP; 9 comparable units currently listed for rent nearby; rentals at typical pace (median 15d on market — plan ~3-4 weeks tenant-placement turnaround); solid renter incomes; 597 units permitted in Chesapeake city in 2024 (0 in 5+ unit buildings).
Forward outlook
- Local home prices are declining (-3.0%/yr); year-one equity from $2k of loan paydown is wiped out by about $9k of value loss. Plan a longer hold.
- Chesapeake County population projected at +21% by 2050 — long-run rental-demand tailwind backs the buy-and-hold thesis.
Negotiation context
- It's been on market 64 days — a 6% lower offer ($273k) is reasonable based on typical stale-listing flexibility.
- 2 sale attempts with the ask held roughly flat each time — persistent listings suggest the price (not the market) is what's stuck; bring a comps-based counter.
Risks & watch-outs
- Watch-outs: built in 1955 — expect roof / HVAC / electrical / plumbing capex.
- Climate carrying-cost: severe wind risk, 80% chance of damaging wind over 30y; extreme-heat days projected 7→16/yr by 2055 (HVAC capex compounding) — expect insurance premiums to compound above CPI over the hold.
Questions for the listing agent
- What do current leases actually rent for vs. the listed asking? Can we see a recent rent roll and the last 12 months of T-12 income?
- It's been on market 64 days. Have you received any prior offers? Is the seller open to a 30% concession, seller financing, or rate buy-down credit?
- Built in 1955 — when were the roof, HVAC, electrical panel, plumbing, and water heater last replaced?
- Why hasn't it sold? Are there any deal-killer items the seller is aware of (foundation, flood, title, zoning, code violations)?
- Is there a deadline driving the sale (1031 exchange, divorce, estate, relocation)? That informs how much negotiation room exists.
- Schools are A-rated — typically a magnet for longer-tenancy family renters. What's the average tenant stay here, and is there a school-zone premium baked into asking?
- The area grade is low — what's the realistic commute time and amenity access for the typical tenant pool here? Any planned neighborhood developments (good or bad) we should know about?
- What's the average days-on-market for RENTAL listings here right now (not sales)? A rising rental-DOM trend means longer vacancies and softer asking-rent achievability than the comps imply.
- What's the recent tenant-quality profile in this submarket — average credit score on applications, eviction rate, late-payment / NSF rate, and stable-employment percentage? A property-management company in the area should have these aggregated.
- How much new for-sale + rental construction is in the pipeline within 1–3 miles? Heavy new supply typically softens prices + rents 12–24 months out; constrained supply supports both.
Investment metrics
- 1% rule
- 0.70% ✗
- Cap rate
- 5.41%
- Cash-on-cash
- -3.14%
- DSCR
- 0.86
- GRM
- 11.9
CMA / ARV
- ARV (on-the-fly)
- $286,679
- Comps found
- 7
Show comp detail 7 sales within ~0.75 mi
| Address | Dist | Beds/Ba | Sqft | Sold | Price | $/sf | Match |
|---|---|---|---|---|---|---|---|
| 5112 Booker St | 0.07mi | 3/2.0 (+1) | 1,000 (-1%) | 10mo | $290,000 | $290 | 81 |
| 622 Marcus St | 0.12mi | 3/2.0 (+1) | 1,130 (+12%) | 1mo | $320,000 | $283 | 69 |
| 5105 Neal St | 0.19mi | 3/2.0 (+1) | 1,100 (+9%) | 9mo | $310,000 | $282 | 64 |
| 612 River Creek Rd | 0.17mi | 3/2.0 (+1) | 1,157 (+14%) | 0mo | $306,000 | $264 | 63 |
| 5311 Libertyville Rd | 0.42mi | 3/2.0 (+1) | 1,092 (+8%) | 4mo | $309,900 | $284 | 59 |
| 813 Mullen Rd Unit A | 0.49mi | 3/2.0 (+1) | 1,100 (+9%) | 1mo | $315,000 | $286 | 57 |
| 523 Marcus St | 0.27mi | 3/2.0 (+1) | 1,157 (+14%) | 13mo | $305,000 | $264 | 48 |
Match score weights: distance 35% · size 25% · config 20% · recency 20%. Top-matched comps best support the ARV.
Projected returns pro-forma
-3.0% appreciation · 7.78% rent growth · sell at horizon
- IRR
- -16.9%
- Equity multiple
- 0.38×
- Total profit
- $-50,387
- Equity at exit
- $43,240
- IRR
- -2.4%
- Equity multiple
- 0.81×
- Total profit
- $-15,378
- Equity at exit
- $25,074
Cash invested: $81,200 (down + closing). Projections, not guarantees.
Landlord ↔ Tenant lean methodology
- Overall (STATE)
- 55 Moderately Landlord-Leaning
- State Virginia
- 55 Moderately Landlord-Leaning · D+2
- County
- — inherits STATE
- City
- — inherits STATE
ZIP-level market 23320
- Rents YoY
- 7.8%
- Active inventory
- 282
- Price-to-rent
- 11.9×
Monthly cashflow live
- Estimated rent
- $2,026 high interval (Pro) →
- Mortgage (P&I)
- −$1,521
- Tax from tax record
- −$171 /mo · $2,049/yr
- Insurance
- −$121
- HOA
- −$0
- Vacancy / Maint / Mgmt
- −$425
- Net cashflow
- $-212
Break-even live
UW: 25.0% down · 7.5% · 30yr · 1.5% tax · 5.0% vac · 8.0% maint · 8.0% mgmt
Financing live
Cash to close
- Down payment
- $72,500
- Closing costs
- $8,700
- Reserves months
- —
- Total cash needed
- —
Loan-product check · same deal, 3 products live
Conventional
25% down · 7.5% · 30yr
- Down + closing
- —
- Monthly P&I
- —
- Monthly cashflow
- —
- DSCR
- —
- Eligible?
- —
Personal DTI + credit; lowest rate.
DSCR
20% down · 8.5% · 30yr
- Down + closing
- —
- Monthly P&I
- —
- Monthly cashflow
- —
- DSCR
- —
- Eligible?
- —
No personal income docs; deal must DSCR.
Hard money
10% down · 12.0% · 12mo
- Down + closing
- —
- Monthly P&I
- —
- Monthly cashflow
- —
- DSCR
- —
- Eligible?
- —
Short-term bridge; refi at stabilization.
Rent comps 9 comps
| Address | Beds | Baths | Sqft | Rent | $/sqft | DOM | Units | Dist |
|---|---|---|---|---|---|---|---|---|
| 906 Wickford Dr Chesapeake, VA | 3.0 | 1.5 | 1300 | $1,950 | $1.50 | 17d | 1 | 0.83mi |
| 103 Duffield Pl Chesapeake, VA | 3.0 | 2.0 | 1372 | $2,200 | $1.60 | 23d | 1 | 0.99mi |
| 824 Huntly Dr Chesapeake, VA | 3.0 | 1.5 | 1268 | $1,750 | $1.38 | 16d | 1 | 1.00mi |
| 208 Crosswinds Dr Unit 00 217104 Chesapeake, VA | 2.0 | 2.0 | 971 | $1,910 | $1.97 | 3d | 1 | 1.20mi |
| 208 Crosswinds Dr Chesapeake, VA | 1.0–2.0 | 1.0–2.0 | 819 | $1,910 | $2.33 | 7d | 2 | 1.21mi |
| 511 Marc Smiley Rd Chesapeake, VA | 2.0 | 2.5 | 1450 | $2,350 | $1.62 | 2d | 1 | 1.26mi |
| 1240 Basswood Ct Chesapeake, VA | 3.0 | 1.5 | 1296 | $1,925 | $1.49 | 14d | 1 | 1.27mi |
| 1222 Corkwood Cir Chesapeake, VA | 3.0 | 2.5 | 1185 | $2,200 | $1.86 | 23d | 1 | 1.32mi |
| 1212 Triple Crown Cir Chesapeake, VA | 1.0–2.0 | 1.0–2.0 | 965 | $2,180 | $2.26 | 2d | 24 | 1.44mi |
Listing history 10 events
-
2026-06-07statusdays on market $290,000 Under Contract 64 DOM
-
2026-06-03days on market $290,000 Active Under Contract 62 DOM
-
2026-06-02days on market $290,000 Active Under Contract 61 DOM
-
2026-06-01days on market $290,000 Active Under Contract 60 DOM
-
2026-05-31days on market $290,000 Active Under Contract 59 DOM
-
2026-05-18historical Active Under Contract
-
2026-05-01status Active
-
2026-04-21historical Active Under Contract
-
2026-04-17price $290,000
-
2026-04-02$300,000 Active
ⓘ Source: listings_history table (triggers on properties + properties_extension) + one-shot
backfill from property_details.listing_events for pre-trigger history.
Tax reassessment forecast VA · Resets to sale price
- Current annual tax
- $2,049 · $171/mo
- Projected year-2 tax
- $2,378 · $198/mo
- Expected delta
- +$329/yr (+$27/mo · 16.0%)
ⓘ Screening estimate from a state-policy table — verify with the county assessor before closing.
Climate risk First Street
- Flood 1/10 Low FEMA zone X (unshaded) · 0% chance over 30 yrs
- Wildfire 1/10 Low
- Heat 9/10 Extreme 7 d/yr ≥107°F today · 16 d/yr by 30 yrs out
- Wind 8/10 Severe 80% chance of damaging wind over 30 yrs
- Air quality 5/10 Major 6 unhealthy d/yr today · 7 by 30 yrs out
Nearby sold comps map
Loading sold comps map…
Walkable amenities ~0.75 mi
Loading nearby amenities…
Taxation est. · year 1
- Rental income
- $24,306
- − Mortgage interest
- −$16,245
- − Property taxes
- −$2,049
- − Insurance
- −$1,450
- − Repairs & maintenance
- −$1,944
- − Management
- −$1,944
- − Depreciation
- −$8,436
- Taxable loss
- −$7,763
- Est. tax savings @ 24.0%
- +$1,863
- After-tax cash flow
- $-684/yr
For passive investors: Depreciation is non-cash, so a rental often shows a tax loss while cash-flowing — sheltering income. Rental losses are passive: they offset passive income freely, and up to $25,000/yr can offset ordinary (W-2) income if you actively participate and your MAGI is under $100k (phasing out to $0 by $150k); unused losses carry forward. On sale, claimed depreciation is recaptured at up to 25%, and gains may owe capital-gains tax (a 1031 exchange can defer both). Figures are a year-1 estimate at your 24.0% rate — not tax advice; consult a CPA.
Schools (NCES district)
- District
- Chesapeake City Public School District
- NCES district ID
- 5100810
- Math proficiency
- 58% ▼ -29.00%
- Reading proficiency
- 74% ▼ -7.00%
- Median HH income
- $69,356
- Composite
- 57.84/100
- National rank
- #1047
- State rank
- #31 of 131 in VA
Livability — Chesapeake
- Score
- 70/100
- State rank
- #236
- US rank
- #7942
Category grades
Schools grade is shown separately in the Schools card above.
Census & demographics
- Census place
- Chesapeake, VA
- County
- Chesapeake City · 253,091 people
- City population
- 253,091
- Metro
- Virginia Beach-Norfolk-Newport News, VA-NC
- Population (ZIP)
- 59,108
- Household income
- $84,305
- Rent vs Own
- Severe rent burden
- 2714.0
Population outlook (Chesapeake County) Hauer SSP2
- Today (2025)
- 263,804 people
- By 2030
- 276,798 · +4.9%
- By 2040
- 299,906 · +13.7%
- By 2050
- 318,284 · +20.7%
- By 2075
- 362,137 · +37.3%
- By 2100
- 372,225 · +41.1%
Race, ethnicity, and origin ACS 2023
- Neighborhood character
- Diverse neighborhood (Simpson 0.66)
- Race & ethnicity
- White 49% Black 29% Hispanic / Latino 10% Two or more races 8% Asian 5%
- Hispanic origin (detail)
- Mexican 3% Puerto Rican 1%
- Common ancestry
- Lithuanian 2% Romanian 2% Italian 2%
- Foreign-born
- 9% · Canada
- Languages at home
- 89% English-only · Spanish 6% Tagalog/Filipino 2% French/Haitian/Cajun 1%
Political lean MEDSL · Chesapeake
- 2024 margin
- Toss-up / Even · D 51.3% · R 47.5% · Other 1.2%
- 2008→2024 swing
- +2.5pp toward D · 2008: 1.3pp · 2024: 3.8pp
- All cycles
- 2024: D+3.8 2020: D+6.5 2016: R+1.3 2012: D+1.1 2008: D+1.3
Not yet ingested
- Civics
- —
Market trends
- HPI YoY
- ▼ -241.43%
- Current HPI
- 285.5792
- Rent YoY
- ▲ 7.78%
- Metro
- Virginia Beach-Norfolk-Newport News, VA-NC
- State GDP YoY
- ▲ 2.40%
- F500 in state
- 50
Industry mix (Fortune 500 HQ in VA)
| Industry | F500 HQs | Revenue |
|---|---|---|
| Aerospace / Defense | 4 | $236B |
|
||
| Technology / Defense | 3 | $32B |
|
||
| Financial Services | 2 | $176B |
|
||
| Utilities | 2 | $27B |
|
||
| Insurance | 2 | $25B |
|
||
| Technology | 2 | $15B |
|
||
Price history
-3.3% since first listed5 events — show timeline
- 2026-05-18 Contingent — REINMLS
- 2026-05-01 Relisted — REINMLS
- 2026-04-21 Contingent — REINMLS
- 2026-04-17 Price Changed $290,000 REINMLS
- 2026-04-02 Listed $300,000 REINMLS
Property tax history
+4.7%/yrLatest (2025): $2,049 · +11.6% YoY. Source: county tax records.
Cash-flow waterfall
monthlySold comps — $/sqft
last 12 mo · ≤1 miLoading sold comps…