33433 Plateau Pines Rd · Shingletown, CA
Flood risk 1/10 · Minimal
- FEMA flood zone
- X (unshaded)
- Chance of flooding over 30 yrs
- 0.0%
- Est. flood insurance / yr
- $507 – $1,088
Fire risk 8/10 · Major
- Est. fire insurance / yr
- $659 – $1,223
Heat risk 3/10 · Minor
- Hot days now (above 92°F)
- 7 days/yr
- Hot days in 30 yrs
- 16 days/yr
Wind risk 1/10 · Minimal
- Chance of severe wind over 30 yrs
- —
Air-quality risk 10/10 · Severe
- Unhealthy air days now
- 25 days/yr
- Unhealthy air days in 30 yrs
- 27 days/yr
Risk factors via First Street. Map © Google.
Why this score? — see what drove the B grade
The composite is a weighted blend of 9 inputs, each scored 0–100. Each bar is that input's sub-score; the figure is the points it added to the 100-point composite (weight × sub-score).
- Cash flow +30.0/30.0
- 1% rule +10.0/10.0
- DSCR +10.0/10.0
- ARV discount +7.5/15.0
- Schools +4.6/10.0
- Livability +3.0/5.0
- Rent growth +2.5/5.0
- Condition / age +2.5/5.0
- Appreciation +0.0/10.0
$90,000
🖨 Deal sheet 📄 Offer letter ✓ Due diligence
Listing remarks MLS
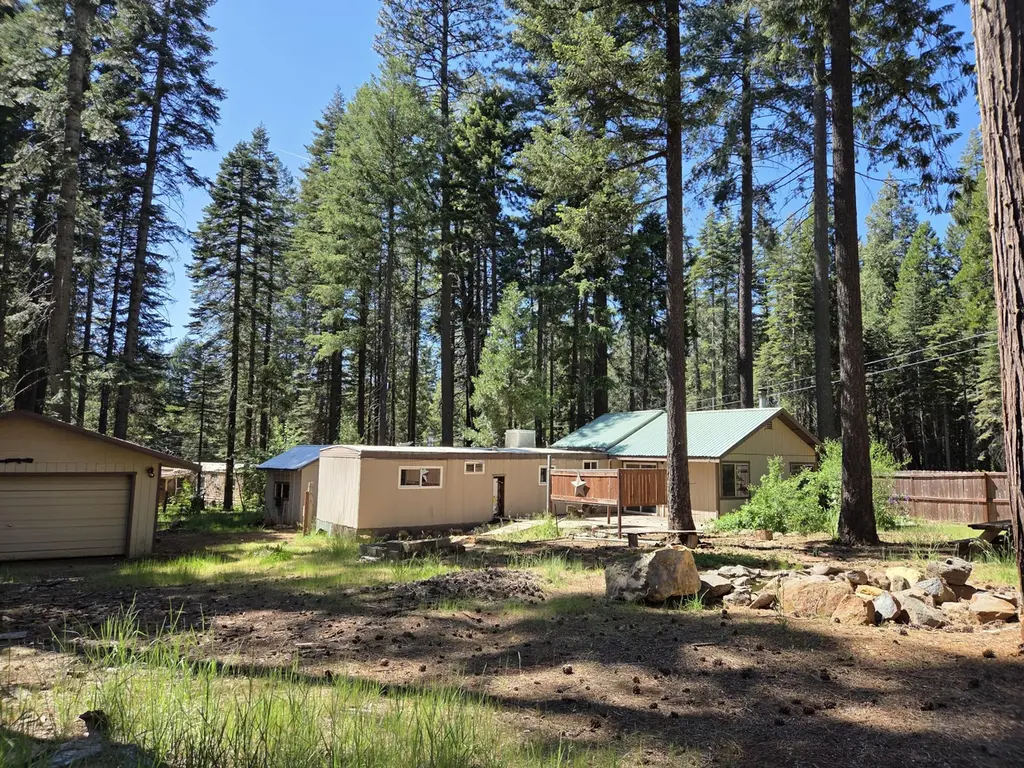
Well maintained mobile with large living room addition. Several sheds and 2 car detached garage sits on property. Fenced property that is well kept and waiting for new owners to enjoy the quietness of country living. OWC with right terms.
Key facts
- Small garden pond
- Patio decking
- Inside laundry
Tags
Property features AI
Exterior
- Parking: Detached garage (1 space); Off-street parking; RV access/parking
- Utilities: Private water source; 220-volt electric service
- Home design: Manufactured in park (mobile home); United States model; Aluminum skirt
- Construction: Aluminum siding; Wood siding; Metal/other roof; Other foundation; Built as a mobile home
- Exterior features: Deck; Partial fencing; Wooded, corner lot; Gentle, level topography; County road frontage; Dirt and gravel road surface; Has view
Interior
- Kitchen: Dishwasher; Range; Cooktop; Oven
- Flooring: Vinyl; Carpet; Laminate
- Heating & cooling: Forced air heating; Evaporative cooling
- Interior features: Dishwasher; Range / Cooktop / Oven; Wood-burning stove in the living room; Fireplace; Has cooling (evaporative); Has heating (forced air)
Neighborhood map
What this means for you Summary
Snapshot
- This is a 2-bed/2.0-bath manufactured listed at $90k.
Deal economics
- At list price, monthly cash flow is $815 ($10k/yr) — positive.
- The deal already cash-flows at list — no discount required.
- Meets the 1% rule at list price ($2k rent vs $90k).
- Recommended offer: $87k (3.0% below list) — sets the bar for market timing.
- Cap rate 17.2% vs local median 4.7% in Shingletown — top-decile yield for the area; either an underpriced asset or a hidden risk that comps aren't pricing in. Stress-test before assuming the spread holds.
Location & tenants
- Location reads 59/100 on livability (#663 in CA) — a working-class tenant base; expect higher turnover. Strengths: housing A+, crime B+, health & safety B; Watch: schools F, amenities F, commute F.
- Shasta Union High (urban): math 41% / reading 67% proficiency, ranked #122 of 517 in CA (top 24%) — acceptable for families but not a draw, mixed tenant base, ~2y average lease; only 16% free/reduced lunch — higher-income household profile.
- Market conditions: 122 active listings in the ZIP; 246 units permitted in Shasta County in 2024 (0 in 5+ unit buildings).
Forward outlook
- Local home prices are declining (-3.0%/yr); year-one equity from $622 of loan paydown is wiped out by about $3k of value loss. Plan a longer hold.
- Shasta County population projected to shrink 9% by 2050 — rents likely to lag national; underwrite the cash flow, not the appreciation.
- At projected returns (-3.0% appreciation + 3.0% rent growth), your $25k cash investment doubles in ~4 years — after that, you're playing with house money.
Negotiation context
- It's been on market 35 days — a 3% lower offer ($87k) is reasonable based on typical stale-listing flexibility.
- 3 sale attempts since 7y ago with the ask held roughly flat each time — persistent listings suggest the price (not the market) is what's stuck; bring a comps-based counter.
Risks & watch-outs
- Climate carrying-cost: severe wildfire risk — expect insurance premiums to compound above CPI over the hold.
Questions for the listing agent
- It's been on market 35 days. Have you received any prior offers? Is the seller open to a 3% concession, seller financing, or rate buy-down credit?
- Built in 1971 — when were the roof, HVAC, electrical panel, plumbing, and water heater last replaced?
- Is there a deadline driving the sale (1031 exchange, divorce, estate, relocation)? That informs how much negotiation room exists.
- Schools are F-rated, which usually means shorter tenancies and higher turnover. Who's the typical renter profile here, and what's been the actual vacancy rate?
- What's the average days-on-market for RENTAL listings here right now (not sales)? A rising rental-DOM trend means longer vacancies and softer asking-rent achievability than the comps imply.
- What's the recent tenant-quality profile in this submarket — average credit score on applications, eviction rate, late-payment / NSF rate, and stable-employment percentage? A property-management company in the area should have these aggregated.
- How much new for-sale + rental construction is in the pipeline within 1–3 miles? Heavy new supply typically softens prices + rents 12–24 months out; constrained supply supports both.
Investment metrics
- 1% rule
- 2.00% ✓
- Cap rate
- 17.16%
- Cash-on-cash
- 38.82%
- DSCR
- 2.73
- GRM
- 4.2
CMA / ARV
No comps found within radius.
Projected returns pro-forma
-3.0% appreciation · 3.0% rent growth · sell at horizon
- IRR
- 35.0%
- Equity multiple
- 2.48×
- Total profit
- $37,353
- Equity at exit
- $13,419
- IRR
- 41.8%
- Equity multiple
- 4.95×
- Total profit
- $99,447
- Equity at exit
- $7,782
Cash invested: $25,200 (down + closing). Projections, not guarantees.
Landlord ↔ Tenant lean methodology
- Overall (STATE)
- 18 Strongly Tenant-Friendly
- State California
- 18 Strongly Tenant-Friendly · D+13
- County
- — inherits STATE
- City
- — inherits STATE
ZIP-level market 96088
- Active inventory
- 122
- Price-to-rent
- 4.2×
Monthly cashflow live
- Estimated rent
- $1,796 medium interval (Pro) →
- Mortgage (P&I)
- −$472
- Tax from tax record
- −$94 /mo · $1,133/yr
- Insurance
- −$38
- HOA
- −$0
- Vacancy / Maint / Mgmt
- −$377
- Net cashflow
- $815
Break-even live
UW: 25.0% down · 7.5% · 30yr · 1.5% tax · 5.0% vac · 8.0% maint · 8.0% mgmt
Financing live
Cash to close
- Down payment
- $22,500
- Closing costs
- $2,700
- Reserves months
- —
- Total cash needed
- —
Loan-product check · same deal, 3 products live
Conventional
25% down · 7.5% · 30yr
- Down + closing
- —
- Monthly P&I
- —
- Monthly cashflow
- —
- DSCR
- —
- Eligible?
- —
Personal DTI + credit; lowest rate.
DSCR
20% down · 8.5% · 30yr
- Down + closing
- —
- Monthly P&I
- —
- Monthly cashflow
- —
- DSCR
- —
- Eligible?
- —
No personal income docs; deal must DSCR.
Hard money
10% down · 12.0% · 12mo
- Down + closing
- —
- Monthly P&I
- —
- Monthly cashflow
- —
- DSCR
- —
- Eligible?
- —
Short-term bridge; refi at stabilization.
Listing history 22 events
-
2026-06-19days on market $90,000 Active 35 DOM
-
2026-06-18days on market $90,000 Active 34 DOM
-
2026-06-17days on market $90,000 Active 33 DOM
-
2026-06-16days on market $90,000 Active 32 DOM
-
2026-06-15days on market $90,000 Active 31 DOM
-
2026-06-14days on market $90,000 Active 29 DOM
-
2026-06-12days on market $90,000 Active 28 DOM
-
2026-06-10days on market $90,000 Active 26 DOM
-
2026-06-09days on market $90,000 Active 25 DOM
-
2026-06-08days on market $90,000 Active 24 DOM
-
2026-06-07days on market $90,000 Active 23 DOM
-
2026-06-03days on market $90,000 Active 19 DOM
-
2026-06-02days on market $90,000 Active 18 DOM
-
2026-06-01days on market $90,000 Active 17 DOM
-
2026-05-31days on market $90,000 Active 16 DOM
-
2026-05-30days on market $90,000 Active 15 DOM
-
2026-05-15$90,000 Active
-
2026-04-06price $90,000
-
2026-03-24$60,000 Active
-
2019-10-10soldstatus $89,000 238-char remark
Show marketing remark (238 chars)
Well maintained mobile with large living room addition. Several sheds and 2 car detached garage sits on property. Fenced property that is well kept and waiting for new owners to enjoy the quietness of country living. OWC with right terms.
-
2019-10-09soldstatus $90,000
-
2019-07-11$89,900 238-char remark
Show marketing remark (238 chars)
Well maintained mobile with large living room addition. Several sheds and 2 car detached garage sits on property. Fenced property that is well kept and waiting for new owners to enjoy the quietness of country living. OWC with right terms.
ⓘ Source: listings_history table (triggers on properties + properties_extension) + one-shot
backfill from property_details.listing_events for pre-trigger history.
Tax reassessment forecast CA · Resets to sale price
- Current annual tax
- $1,133 · $94/mo
- Projected year-2 tax
- $1,133 · $94/mo
- Expected delta
- $0/yr ($0/mo · 0.0%)
ⓘ Screening estimate from a state-policy table — verify with the county assessor before closing.
Climate risk First Street
- Flood 1/10 Low FEMA zone X (unshaded) · 0% chance over 30 yrs
- Wildfire 8/10 Severe
- Heat 3/10 Moderate 7 d/yr ≥92°F today · 16 d/yr by 30 yrs out
- Wind 1/10 Low
- Air quality 10/10 Extreme 25 unhealthy d/yr today · 27 by 30 yrs out
Nearby sold comps map
Loading sold comps map…
Walkable amenities ~0.75 mi
Loading nearby amenities…
Taxation est. · year 1
- Rental income
- $21,556
- − Mortgage interest
- −$5,041
- − Property taxes
- −$1,133
- − Insurance
- −$450
- − Repairs & maintenance
- −$1,724
- − Management
- −$1,724
- − Depreciation
- −$2,618
- Taxable income
- $8,864
- Est. tax owed @ 24.0%
- −$2,127
- After-tax cash flow
- $7,655/yr
For passive investors: Depreciation is non-cash, so a rental often shows a tax loss while cash-flowing — sheltering income. Rental losses are passive: they offset passive income freely, and up to $25,000/yr can offset ordinary (W-2) income if you actively participate and your MAGI is under $100k (phasing out to $0 by $150k); unused losses carry forward. On sale, claimed depreciation is recaptured at up to 25%, and gains may owe capital-gains tax (a 1031 exchange can defer both). Figures are a year-1 estimate at your 24.0% rate — not tax advice; consult a CPA.
Schools (NCES district)
- District
- Shasta Union High
- NCES district ID
- 0636600
- Math proficiency
- 41% ▲ 3.00%
- Reading proficiency
- 67% ▲ 9.00%
- Median HH income
- $50,080
- Composite
- 46.01/100
- National rank
- #2532
- State rank
- #122 of 517 in CA
Livability — Shingletown
- Score
- 59/100
- State rank
- #663
- US rank
- #20514
Category grades
Schools grade is shown separately in the Schools card above.
Census & demographics
- Census place
- Shingletown, CA
- City population
- 4,552
- Population (ZIP)
- 4,552
Population outlook (Shasta County) Hauer SSP2
- Today (2025)
- 179,231 people
- By 2030
- 176,953 · -1.3%
- By 2040
- 169,982 · -5.2%
- By 2050
- 162,547 · -9.3%
- By 2075
- 145,649 · -18.7%
- By 2100
- 123,025 · -31.4%
Race, ethnicity, and origin ACS 2023
- Neighborhood character
- Predominantly White (82%)
- Race & ethnicity
- White 82% Two or more races 11% Hispanic / Latino 8% Native American 2%
- Hispanic origin (detail)
- Mexican 6% Cuban 1%
- Common ancestry
- Lithuanian 5% Serbian 3% Portuguese 3%
- Foreign-born
- 3% · Canada, China
- Languages at home
- 94% English-only · Spanish 5%
Political lean MEDSL · Shasta
- 2024 margin
- Solid R (+36.5) · D 30.5% · R 67.0% · Other 2.5%
- 2008→2024 swing
- -10.7pp toward R · 2008: -25.8pp · 2024: -36.5pp
- All cycles
- 2024: R+36.5 2020: R+33.1 2016: R+37.4 2012: R+30.3 2008: R+25.8
Not yet ingested
- Civics
- —
Market trends
- HPI YoY
- ▼ -127.35%
- Current HPI
- 141.2725
- Rent YoY
- —
- Metro
- —
- State GDP YoY
- ▲ 3.21%
- F500 in state
- 116
Industry mix (Fortune 500 HQ in CA)
| Industry | F500 HQs | Revenue |
|---|---|---|
| Technology | 27 | $1,492B |
|
||
| Financial Services | 3 | $174B |
|
||
| Retail | 3 | $44B |
|
||
| Insurance | 3 | $26B |
|
||
| Media / Entertainment | 2 | $115B |
|
||
| Pharmaceuticals / Biotech | 2 | $62B |
|
||
Price history
+0.1% since first listed6 events — show timeline
- 2026-05-15 Listed $90,000 SAOR
- 2026-04-06 Price Changed $90,000 SAOR
- 2026-03-24 Listed $60,000 SAOR
- 2019-10-10 Sold (MLS) $89,000 SAOR
- 2019-10-09 Sold (Public Records) $90,000 Public Records
- 2019-07-11 Listed $89,900 SAOR
Property tax history
+8.3%/yrLatest (2025): $1,133 · +32.1% YoY. Source: county tax records.
Cash-flow waterfall
monthlySold comps — $/sqft
last 12 mo · ≤1 miLoading sold comps…