2230 Lake Park Dr #131 · San Jacinto, CA
Flood risk 3/10 · Minor
- FEMA flood zone
- X
- Chance of flooding over 30 yrs
- 0.1%
- Est. flood insurance / yr
- $507 – $1,088
Fire risk 9/10 · Severe
- Est. fire insurance / yr
- $659 – $1,223
Heat risk 7/10 · Major
- Hot days now (above 102°F)
- 4 days/yr
- Hot days in 30 yrs
- 11 days/yr
Wind risk 1/10 · Minimal
- Chance of severe wind over 30 yrs
- —
Air-quality risk 6/10 · Moderate
- Unhealthy air days now
- 11 days/yr
- Unhealthy air days in 30 yrs
- 13 days/yr
Risk factors via First Street. Map © Google.
Why this score? — see what drove the B grade
The composite is a weighted blend of 9 inputs, each scored 0–100. Each bar is that input's sub-score; the figure is the points it added to the 100-point composite (weight × sub-score).
- Cash flow +30.0/30.0
- ARV discount +12.7/15.0
- 1% rule +10.0/10.0
- DSCR +10.0/10.0
- Condition / age +3.8/5.0
- Rent growth +3.2/5.0
- Livability +3.2/5.0
- Schools +2.1/10.0
- Appreciation +0.0/10.0
$76,000
🖨 Deal sheet 📄 Offer letter ✓ Due diligence
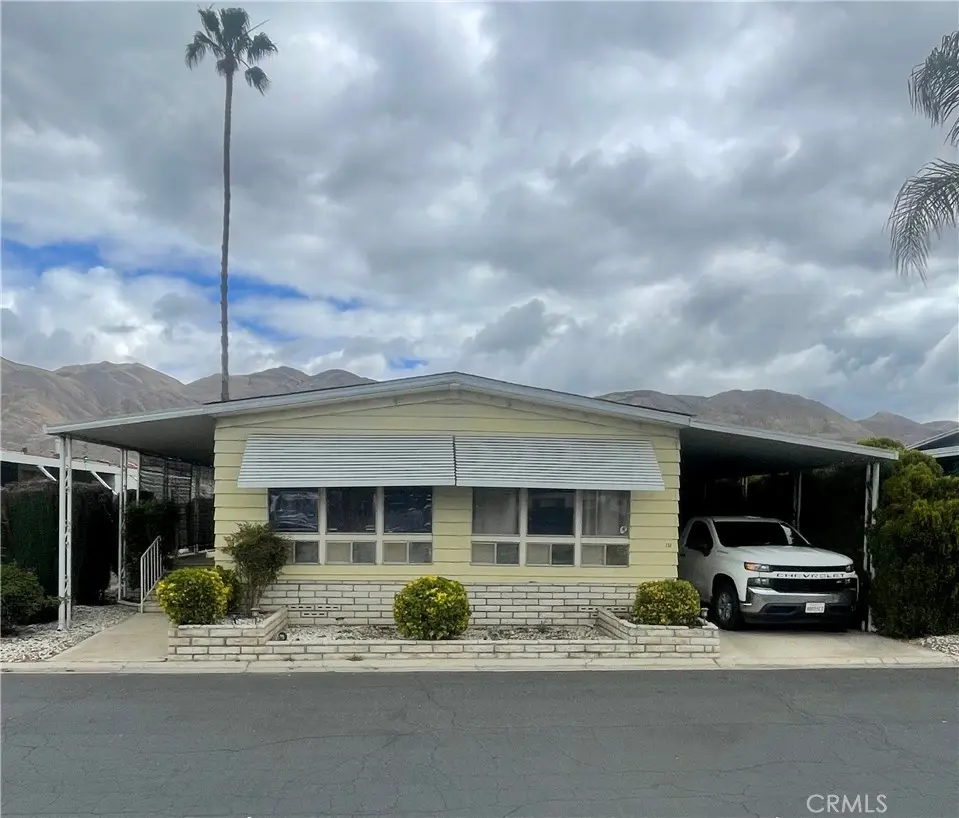
Listing remarks
Senior park Community 55+. .. This two bedroom two bath home is move-in ready, offering a beautiful panoramic view with the green belt located right out front. Enjoy the newly remodeled bathrooms, vaulted ceilings, large living area, even can have an office space in the laundry room and this home is within a short walking distance ro the club house, billiards room, pool and spa. The private patio is great for entertaining or enjoying your morning coffee. You don't want to miss out on this gem!
Key facts
- Green belt
- Panoramic view
- Large living area
Tags
Property features AI
Finance
- Other: Pets allowed; Body type: Double (multi-unit/mobile classification); Accessibility: 2+ access exits
- Financial info: Land lease amount: monthly fee (park-managed)
- HOA & community: Senior community; Park name: Soboba Spring Mobile Estates; Community features include fishing, lake access, and street lighting; Land lease (monthly)
Exterior
- Parking: Carport (2 spaces); RV gated parking; Total of 2 parking spaces
- Security: Card/code access; Automatic gate; Gated community with resident manager
- Utilities: Public sewer; District/public water; Natural gas connected; Electricity connected; Telephone in street; Cable available; Sewer connected; Water connected
- Home design: Mobile home (24' x 56') remains on site; Updated/remodeled condition; Single-story; Front entry; Developer source for living area; Has a view
- Construction: Hardboard exterior; Composition/shingle roof; Block skirt; Brick and mortar perimeter foundation; Year built: other source
- Exterior features: Covered concrete patio; Rain gutters; In-ground, fenced community pool heated with gas; Community spa that is in-ground and heated; Shed (1); Landscaped lot with greenbelt; Lot on lakefront with community fishing; Private paved road frontage
Interior
- Kitchen: Gas cooktop; Gas oven; Refrigerator; Formica counters
- Bedrooms: One-level home
- Flooring: Carpet; Wood
- Bathrooms: Two full bathrooms; Walk-in shower
- Heating & cooling: Central cooling; Central furnace heating
- Interior features: Beamed ceilings; Open floor plan; Cathedral/vaulted ceilings; Formica counters; Mirrored closet doors; Drapes/curtains and window screens; Formal entry
- Laundry & utility: Dedicated laundry room; Washer included; Dryer included; Washer hookup
Neighborhood map
What this means for you Summary
Snapshot
- This is a 2-bed/2.0-bath manufactured listed at $76k. Condition is rated good.
Deal economics
- At list price, monthly cash flow is $1k ($16k/yr) — positive.
- The deal already cash-flows at list — no discount required.
- Meets the 1% rule at list price ($2k rent vs $76k).
- Recommended offer: $75k (1.5% below list) — sets the bar for market timing.
- Cap rate 27.7% vs local median 3.8% in San Jacinto — top-decile yield for the area; either an underpriced asset or a hidden risk that comps aren't pricing in. Stress-test before assuming the spread holds.
Location & tenants
- Location reads 63/100 on livability (#467 in CA) — a middle-class / working-renter tenant base. Strengths: housing A+; Watch: employment D+, schools D-, amenities F.
- San Jacinto Unified (suburban): math 13% / reading 36% proficiency, ranked #421 of 517 in CA (top 81%) — low school quality limits family demand, transient renter base, plan for 1-2y turnover; 68% free/reduced lunch — lower-income household profile, screen leases tightly.
- Market conditions: Rents rising (+2.6%/yr); 159 active listings in the ZIP; 11 comparable units currently listed for rent nearby; rentals at typical pace (median 24d on market — plan ~3-4 weeks tenant-placement turnaround); 9,195 units permitted in Riverside County in 2024 (1,512 in 5+ unit buildings).
- This rent runs 42% of the median local income ($68k/yr) — at the standard rent-burdened threshold; future hikes will face affordability resistance.
Forward outlook
- Local home prices are declining (-3.0%/yr); year-one equity from $525 of loan paydown is wiped out by about $2k of value loss. Plan a longer hold.
- Riverside County population projected at +22% by 2050 — long-run rental-demand tailwind backs the buy-and-hold thesis.
- At projected returns (-3.0% appreciation + 2.6% rent growth), your $21k cash investment doubles in ~2 years — after that, you're playing with house money.
Negotiation context
- It's been on market 16 days — a 2% lower offer ($75k) is reasonable based on typical stale-listing flexibility.
Risks & watch-outs
- Climate carrying-cost: severe wildfire risk; extreme-heat days projected 4→11/yr by 2055 (HVAC capex compounding) — expect insurance premiums to compound above CPI over the hold.
Questions for the listing agent
- Built in 1978 — when were the roof, HVAC, electrical panel, plumbing, and water heater last replaced?
- Is there a deadline driving the sale (1031 exchange, divorce, estate, relocation)? That informs how much negotiation room exists.
- Schools are D-rated, which usually means shorter tenancies and higher turnover. Who's the typical renter profile here, and what's been the actual vacancy rate?
- What's the average days-on-market for RENTAL listings here right now (not sales)? A rising rental-DOM trend means longer vacancies and softer asking-rent achievability than the comps imply.
- What's the recent tenant-quality profile in this submarket — average credit score on applications, eviction rate, late-payment / NSF rate, and stable-employment percentage? A property-management company in the area should have these aggregated.
- How much new for-sale + rental construction is in the pipeline within 1–3 miles? Heavy new supply typically softens prices + rents 12–24 months out; constrained supply supports both.
Investment metrics
- 1% rule
- 3.14% ✓
- Cap rate
- 27.72%
- Cash-on-cash
- 76.54%
- DSCR
- 4.41
- GRM
- 2.7
CMA / ARV
- ARV (on-the-fly)
- $86,016
- Comps found
- 11
Show comp detail 11 sales within ~0.75 mi
| Address | Dist | Beds/Ba | Sqft | Sold | Price | $/sf | Match |
|---|---|---|---|---|---|---|---|
| 2230 Lake Park Dr #223 | 0.02mi | 2/2.0 | 1,344 (0%) | 4mo | $77,500 | $58 | 96 |
| 2230 Lake Park Dr #133 | 0.02mi | 3/2.0 (+1) | 1,325 (-1%) | 3mo | $195,500 | $148 | 89 |
| 2230 Lake Park #193 | 0.14mi | 2/2.0 | 1,296 (-4%) | 2mo | $118,000 | $91 | 86 |
| 2230 Lake Park Dr #106 | 0.02mi | 2/2.0 | 1,440 (+7%) | 2mo | $35,000 | $24 | 85 |
| 2230-223 Lake Park Dr | 0.14mi | 2/2.0 | 1,344 (0%) | 17mo | $100,000 | $74 | 79 |
| 2230 Lake Park #127 | 0.14mi | 2/2.0 | 1,440 (+7%) | 3mo | $32,000 | $22 | 79 |
| 2230 Lake Park Dr #174 | 0.03mi | 2/2.0 | 1,440 (+7%) | 16mo | $142,000 | $99 | 73 |
| 2230 Lake Park Dr #143 | 0.14mi | 2/2.0 | 1,440 (+7%) | 14mo | $75,000 | $52 | 70 |
| 2230 Lake Park Dr #91 | 0.14mi | 2/2.0 | 1,440 (+7%) | 21mo | $67,000 | $47 | 64 |
| 2230 Lake Park Dr #81 | 0.14mi | 2/2.0 | 1,440 (+7%) | 24mo | $113,000 | $78 | 62 |
| 1499 Old Mountain Ave #93 | 0.73mi | 2/2.0 | 1,440 (+7%) | 9mo | $91,500 | $64 | 47 |
Match score weights: distance 35% · size 25% · config 20% · recency 20%. Top-matched comps best support the ARV.
Projected returns pro-forma
-3.0% appreciation · 2.61% rent growth · sell at horizon
- IRR
- 76.1%
- Equity multiple
- 4.44×
- Total profit
- $73,240
- Equity at exit
- $11,332
- IRR
- 79.6%
- Equity multiple
- 9.06×
- Total profit
- $171,448
- Equity at exit
- $6,571
Cash invested: $21,280 (down + closing). Projections, not guarantees.
Landlord ↔ Tenant lean methodology
- Overall (STATE)
- 18 Strongly Tenant-Friendly
- State California
- 18 Strongly Tenant-Friendly · D+13
- County
- — inherits STATE
- City
- — inherits STATE
ZIP-level market 92583
- Home prices YoY
- -14.8%
- Rents YoY
- 2.6%
- Active inventory
- 159
- Price-to-rent
- 2.7×
Monthly cashflow live
- Estimated rent
- $2,383 high interval (Pro) →
- Mortgage (P&I)
- −$399
- Tax est. 1.5%
- −$95 /mo · $1,140/yr
- Insurance
- −$32
- HOA
- −$0
- Vacancy / Maint / Mgmt
- −$500
- Net cashflow
- $1,357
Break-even live
UW: 25.0% down · 7.5% · 30yr · 1.5% tax · 5.0% vac · 8.0% maint · 8.0% mgmt
Financing live
Cash to close
- Down payment
- $19,000
- Closing costs
- $2,280
- Reserves months
- —
- Total cash needed
- —
Loan-product check · same deal, 3 products live
Conventional
25% down · 7.5% · 30yr
- Down + closing
- —
- Monthly P&I
- —
- Monthly cashflow
- —
- DSCR
- —
- Eligible?
- —
Personal DTI + credit; lowest rate.
DSCR
20% down · 8.5% · 30yr
- Down + closing
- —
- Monthly P&I
- —
- Monthly cashflow
- —
- DSCR
- —
- Eligible?
- —
No personal income docs; deal must DSCR.
Hard money
10% down · 12.0% · 12mo
- Down + closing
- —
- Monthly P&I
- —
- Monthly cashflow
- —
- DSCR
- —
- Eligible?
- —
Short-term bridge; refi at stabilization.
Rent comps 11 comps
| Address | Beds | Baths | Sqft | Rent | $/sqft | DOM | Units | Dist |
|---|---|---|---|---|---|---|---|---|
| 904 Bergamo Ave San Jacinto, CA | 2.0 | 2.0 | 1596 | $2,600 | $1.63 | 10d | 1 | 0.74mi |
| 905 Verona Ave San Jacinto, CA | 2.0 | 2.0 | 1417 | $2,300 | $1.62 | 17d | 1 | 0.78mi |
| 1129 Osprey St San Jacinto, CA | 3.0 | 2.0 | 1582 | $2,700 | $1.71 | 43d | 1 | 0.97mi |
| 492 Foursquare Pl San Jacinto, CA | 3.0 | 2.0 | 1573 | $3,500 | $2.23 | 1d | 1 | 1.17mi |
| 620 E Main St San Jacinto, CA | 2.0 | 2.0 | 900 | $1,600 | $1.78 | 24d | 1 | 1.20mi |
| 646 Field Maple Pl GLMN HOT SPGS, CA | 3.0–4.0 | 2.0–3.0 | 1825 | $2,850 | $1.56 | 1d | 9 | 1.31mi |
| 621 S Mistletoe Ave San Jacinto, CA | 2.0 | 2.0 | 1500 | $2,000 | $1.33 | 43d | 1 | 1.38mi |
| 1939 Hooper Dr San Jacinto, CA | 2.0 | 2.0 | 1111 | $1,950 | $1.76 | 24d | 1 | 1.44mi |
| 1809 Rue Chenin Blanc San Jacinto, CA | 3.0 | 2.0 | 1548 | $2,500 | $1.61 | 4d | 1 | 1.46mi |
| 700 Minor St San Jacinto, CA | 2.0 | 1.0 | 878 | $1,600 | $1.82 | 43d | 1 | 1.49mi |
| 700 Minor St San Jacinto, CA | 2.0 | 1.0 | 878 | $1,700 | $1.94 | 24d | 1 | 1.49mi |
Listing history 13 events
-
2026-06-18days on market $76,000 Active 16 DOM
-
2026-06-17days on market $76,000 Active 15 DOM
-
2026-06-16days on market $76,000 Active 14 DOM
-
2026-06-15days on market $76,000 Active 13 DOM
-
2026-06-13days on market $76,000 Active 11 DOM
-
2026-06-13remarks 498-char remark
-
2026-06-13days on market $76,000 Active 10 DOM
-
2026-06-09days on market $76,000 Active 7 DOM
-
2026-06-08days on market $76,000 Active 6 DOM
-
2026-06-07days on market $76,000 Active 5 DOM
-
2026-06-04days on market $76,000 Active 2 DOM
-
2026-06-03remarks 447-char remark
-
2026-06-03$76,000 Active 1 DOM
ⓘ Source: listings_history table (triggers on properties + properties_extension) + one-shot
backfill from property_details.listing_events for pre-trigger history.
Climate risk First Street
- Flood 3/10 Moderate FEMA zone X · 10% chance over 30 yrs
- Wildfire 9/10 Extreme
- Heat 7/10 Severe 4 d/yr ≥102°F today · 11 d/yr by 30 yrs out
- Wind 1/10 Low
- Air quality 6/10 Major 11 unhealthy d/yr today · 13 by 30 yrs out
Nearby sold comps map
Loading sold comps map…
Walkable amenities ~0.75 mi
Loading nearby amenities…
Taxation est. · year 1
- Rental income
- $28,596
- − Mortgage interest
- −$4,257
- − Property taxes
- −$1,140
- − Insurance
- −$380
- − Repairs & maintenance
- −$2,288
- − Management
- −$2,288
- − Depreciation
- −$2,211
- Taxable income
- $16,033
- Est. tax owed @ 24.0%
- −$3,848
- After-tax cash flow
- $12,440/yr
For passive investors: Depreciation is non-cash, so a rental often shows a tax loss while cash-flowing — sheltering income. Rental losses are passive: they offset passive income freely, and up to $25,000/yr can offset ordinary (W-2) income if you actively participate and your MAGI is under $100k (phasing out to $0 by $150k); unused losses carry forward. On sale, claimed depreciation is recaptured at up to 25%, and gains may owe capital-gains tax (a 1031 exchange can defer both). Figures are a year-1 estimate at your 24.0% rate — not tax advice; consult a CPA.
Condition & rehab AI · 6 photos
This move-in ready manufactured home in a senior park community offers a beautiful view and is well-maintained with good systems and finishes.
Value-add opportunities
- Both Paint exterior — Enhances curb appeal and value
- Both Replace carpets — Fresh carpeting improves comfort and value
Renovation cost estimate screening
Value-add ROI direction
- Both Paint exterior — Enhances curb appeal and value ↑
- Both Replace carpets — Fresh carpeting improves comfort and value ↑
ⓘ Cost ranges are severity-bucket heuristics (US national rule-of-thumb). Get contractor quotes + a written scope before underwriting a rehab budget.
Schools (NCES district)
- District
- San Jacinto Unified
- NCES district ID
- 0634440
- Math proficiency
- 13% ▼ -9.00%
- Reading proficiency
- 36% ▬ 0.00%
- Median HH income
- $43,560
- Composite
- 20.94/100
- National rank
- #8478
- State rank
- #421 of 517 in CA
Livability — San Jacinto
- Score
- 63/100
- State rank
- #467
- US rank
- #15889
Category grades
Schools grade is shown separately in the Schools card above.
Census & demographics
- Census place
- San Jacinto, CA
- County
- Riverside County · 2,287,001 people
- City population
- 33,778
- Metro
- Riverside-San Bernardino-Ontario, CA
- Population (ZIP)
- 33,778
- Household income
- $68,351
- Rent vs Own
- Severe rent burden
- 747.0
Population outlook (Riverside County) Hauer SSP2
- Today (2025)
- 2,664,475 people
- By 2030
- 2,802,692 · +5.2%
- By 2040
- 3,050,904 · +14.5%
- By 2050
- 3,256,783 · +22.2%
- By 2075
- 3,655,058 · +37.2%
- By 2100
- 3,766,594 · +41.4%
Race, ethnicity, and origin ACS 2023
- Neighborhood character
- Diverse neighborhood (Simpson 0.57)
- Race & ethnicity
- Hispanic / Latino 60% White 26% Two or more races 23% Black 5% Asian 3% Native American 3%
- Hispanic origin (detail)
- Mexican 52%
- Common ancestry
- Lithuanian 1% Iranian 1% Portuguese 1%
- Foreign-born
- 20% · Canada
- Languages at home
- 56% English-only · Spanish 40% Tagalog/Filipino 2% Other Asian/Pacific 1%
Political lean MEDSL · Riverside
- 2024 margin
- Toss-up / Even · D 48.0% · R 49.3% · Other 2.6%
- 2008→2024 swing
- -3.6pp toward R · 2008: 2.3pp · 2024: -1.3pp
- All cycles
- 2024: R+1.3 2020: D+8.0 2016: D+4.3 2012: R+0.4 2008: D+2.3
Not yet ingested
- Civics
- —
Market trends
- HPI YoY
- ▼ -71.15%
- Current HPI
- 407.8584
- Rent YoY
- ▲ 2.61%
- Metro
- Riverside-San Bernardino-Ontario, CA
- State GDP YoY
- ▲ 3.21%
- F500 in state
- 116
Industry mix (Fortune 500 HQ in CA)
| Industry | F500 HQs | Revenue |
|---|---|---|
| Technology | 27 | $1,492B |
|
||
| Financial Services | 3 | $174B |
|
||
| Retail | 3 | $44B |
|
||
| Insurance | 3 | $26B |
|
||
| Media / Entertainment | 2 | $115B |
|
||
| Pharmaceuticals / Biotech | 2 | $62B |
|
||
Price history
1 event — show timeline
- 2026-06-02 Listed $76,000 CRMLS
Cash-flow waterfall
monthlySold comps — $/sqft
last 12 mo · ≤1 miLoading sold comps…