115 World Of Tennis Sq · Lakeway, TX
Flood risk 1/10 · Minimal
- FEMA flood zone
- X (unshaded)
- Chance of flooding over 30 yrs
- 0.0%
- Est. flood insurance / yr
- $507 – $1,088
Fire risk 4/10 · Minor
- Est. fire insurance / yr
- $1,222 – $2,270
Heat risk 8/10 · Major
- Hot days now (above 107°F)
- 7 days/yr
- Hot days in 30 yrs
- 22 days/yr
Wind risk 6/10 · Moderate
- Chance of severe wind over 30 yrs
- 65.0%
Air-quality risk 1/10 · Minimal
- Unhealthy air days now
- 0 days/yr
- Unhealthy air days in 30 yrs
- 0 days/yr
Risk factors via First Street. Map © Google.
Why this score? — see what drove the D grade
The composite is a weighted blend of 9 inputs, each scored 0–100. Each bar is that input's sub-score; the figure is the points it added to the 100-point composite (weight × sub-score).
- ARV discount +15.0/15.0
- Cash flow +7.7/30.0
- Schools +5.5/10.0
- 1% rule +5.2/10.0
- Livability +3.6/5.0
- Condition / age +2.5/5.0
- Rent growth +2.2/5.0
- DSCR +1.8/10.0
- Appreciation +0.0/10.0
$299,999
🖨 Deal sheet (PDF) 📄 Offer letter ✓ Due diligence
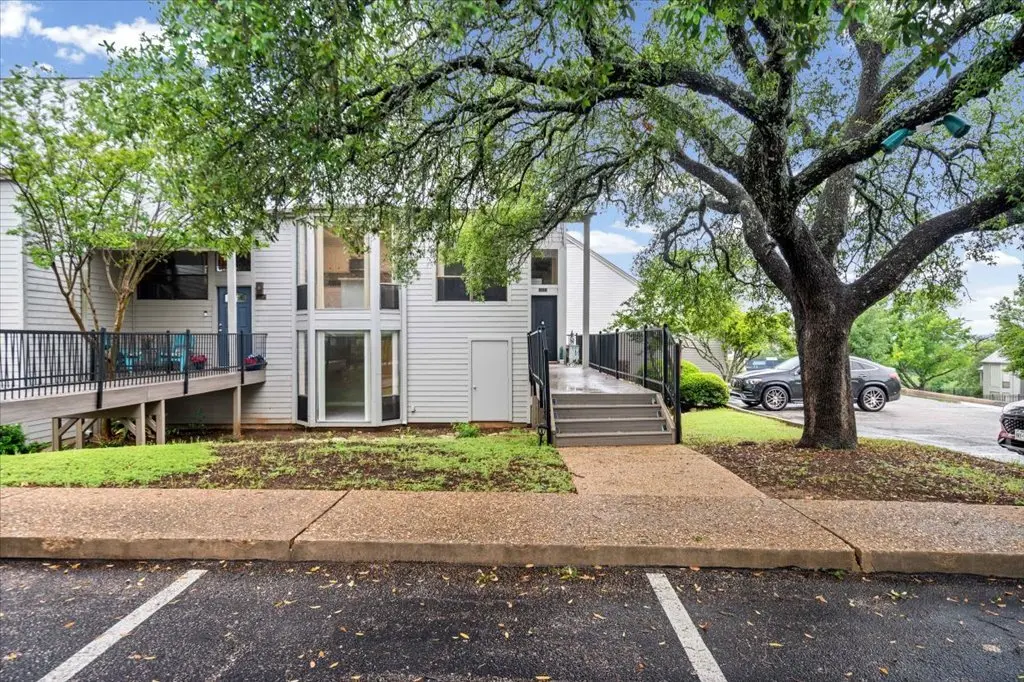
Listing remarks
Rare end-unit opportunity in Lakeway with a spacious layout, abundant natural light, and a price that’s hard to beat. Freshly painted with new flooring throughout, this move-in-ready home features floor-to-ceiling windows, great privacy in the back, ample parking with a designated parking area, and easy in-and-out access within the complex. Generous storage space and a functional floor plan make everyday living easy. Equipped with permanent filters for low-maintenance living. Short-term rentals are allowed, and the complex is now FHA approved — creating exceptional flexibility for both owners and investors.
Key facts
- Natural light
- Functional layout
- $474 HOA
Tags
Property features AI
Finance
- HOA & community: Homeowners association (World of Tennis Condo); Monthly association fee of $474; Association fee covers common area maintenance, structure maintenance, and trash; Community features include community mailbox, sidewalks, tennis courts, trails/paths, and curbs
Exterior
- Parking: Parking lot with 2 total spaces
- Utilities: Cable available; Electricity connected; High-speed internet available; Sewer connected (Municipal Utility District); Water connected (Municipal Utility District); Underground utilities
- Home design: Two-story property; Faces northeast; Resale property
- Construction: HardiPlank-type exterior; Metal roof; Slab foundation; Year built from public records
- Exterior features: Balcony; Deck; Patio; Rain gutters; Tennis courts; Large trees on lot
Interior
- Kitchen: Dishwasher; Electric range / range; Microwave; Garbage disposal
- Bedrooms: Three main-level bedrooms
- Flooring: Carpet; Laminate; Terrazzo; Tile
- Bathrooms: Three full bathrooms
- Heating & cooling: Central heating (electric); Central air (electric)
- Interior features: Beamed and open beam ceilings; Tray ceilings; Ceiling fans; Crown molding; Granite counters; Tile counters; Kitchen island; Pantry; Bar; Walk-in closets; Blinds; Tinted windows
- Laundry & utility: Indoor laundry in a laundry closet
Neighborhood map
What this means for you Summary
Snapshot
- This is a 3-bed/4.0-bath condo listed at $300k.
Deal economics
- At list price, monthly cash flow is $-340 ($-4k/yr) — negative.
- To cash-flow at today's rent, offer at most $240k (20.1% below list).
- Meets the 1% rule at list price ($3k rent vs $300k).
- Recommended offer: $240k (20.1% below list) — sets the bar for cash-flow.
- Cap rate 4.9% vs local median 1.7% in Lakeway — top-decile yield for the area; either an underpriced asset or a hidden risk that comps aren't pricing in. Stress-test before assuming the spread holds.
Location & tenants
- Location reads 71/100 on livability (#330 in TX) — a middle-class / working-renter tenant base. Strengths: crime A+, employment A+, housing A+; Watch: amenities F, commute F, cost of living F.
- Lake Travis ISD (rural): math 57% / reading 61% proficiency, ranked #39 of 826 in TX (top 5%) — acceptable for families but not a draw, mixed tenant base, ~2y average lease; only 15% free/reduced lunch — higher-income household profile.
- Zoned schools: Serene Hills El (math 56% / reading 54%, grade C, #602 of 4,322 statewide, top 14%, 627 students, 7% FRL); Hudson Bend Middle (math 57% / reading 52%, grade B-, #256 of 1,662 statewide, top 16%, 900 students, 0% FRL); Lake Travis H S (math 54% / reading 75%, grade B-, #199 of 1,632 statewide, top 14%, 3,701 students, 0% FRL).
- Market conditions: Rents soft (-1.2%/yr); 506 active listings in the ZIP; 14 comparable units currently listed for rent nearby; rentals leasing fast (median 13d on market — plan ~1-2 weeks tenant-placement turnaround); high-income renter base; 17,121 units permitted in Travis County in 2024 (11,963 in 5+ unit buildings).
Forward outlook
- Local home prices are declining (-3.0%/yr); year-one equity from $2k of loan paydown is wiped out by about $9k of value loss. Plan a longer hold.
- Travis County population projected at +60% by 2050 — long-run rental-demand tailwind backs the buy-and-hold thesis.
Negotiation context
- It's been on market 45 days — a 3% lower offer ($291k) is reasonable based on typical stale-listing flexibility.
- 4 sale attempts; this cycle's ask has dropped $19k (6%) from the opening price — seller is motivated, your offer sets the floor, not the list.
Risks & watch-outs
- Climate carrying-cost: major wind risk, 65% chance of damaging wind over 30y; extreme-heat days projected 7→22/yr by 2055 (HVAC capex compounding) — expect insurance premiums to compound above CPI over the hold.
Questions for the listing agent
- What do current leases actually rent for vs. the listed asking? Can we see a recent rent roll and the last 12 months of T-12 income?
- It's been on market 45 days. Have you received any prior offers? Is the seller open to a 20% concession, seller financing, or rate buy-down credit?
- Built in 1971 — when were the roof, HVAC, electrical panel, plumbing, and water heater last replaced?
- What does the HOA fee cover, when was the last increase, and are there any pending special assessments or reserve-fund shortfalls?
- Any open or pending special assessments — roof, HVAC, plumbing, elevator, façade? What's the per-unit balance and payoff schedule, and is the seller paying it off at close or rolling it to the buyer?
- Is there a deadline driving the sale (1031 exchange, divorce, estate, relocation)? That informs how much negotiation room exists.
- Schools are B-rated — typically a magnet for longer-tenancy family renters. What's the average tenant stay here, and is there a school-zone premium baked into asking?
- The area grade is low — what's the realistic commute time and amenity access for the typical tenant pool here? Any planned neighborhood developments (good or bad) we should know about?
- What's the average days-on-market for RENTAL listings here right now (not sales)? A rising rental-DOM trend means longer vacancies and softer asking-rent achievability than the comps imply.
- What's the recent tenant-quality profile in this submarket — average credit score on applications, eviction rate, late-payment / NSF rate, and stable-employment percentage? A property-management company in the area should have these aggregated.
- How much new apartment / multifamily construction is in the pipeline within 1–3 miles? Heavy new supply (>2% of stock underway) typically softens rents 12–24 months out; light construction supports rent growth.
Investment metrics
- 1% rule
- 1.02% ✓
- Cap rate
- 4.93%
- Cash-on-cash
- -4.86%
- DSCR
- 0.78
- GRM
- 8.2
CMA / ARV
- ARV (median comp)
- $366,561
- List price
- $299,999
- Delta
- -18.16%
- Verdict
- UNDERPRICED
- Comps
- 20 within 1.0 mi
Projected returns pro-forma
-3.0% appreciation · 0.0% rent growth · sell at horizon
- IRR
- -29.1%
- Equity multiple
- 0.06×
- Total profit
- $-78,818
- Equity at exit
- $44,731
- IRR
- -57.9%
- Equity multiple
- -0.54×
- Total profit
- $-129,386
- Equity at exit
- $25,938
Cash invested: $84,000 (down + closing). Projections, not guarantees.
Landlord ↔ Tenant lean methodology
- Overall (STATE)
- 87 Strongly Landlord-Friendly
- State Texas
- 87 Strongly Landlord-Friendly · R+5
- County
- — inherits STATE
- City
- — inherits STATE
ZIP-level market 78738
- Home prices YoY
- -5.5%
- Rents YoY
- -1.2%
- Active inventory
- 506
- Price-to-rent
- 8.2×
Monthly cashflow live
- Estimated rent
- $3,067 high interval (Pro) →
- Mortgage (P&I)
- −$1,573
- Tax from tax record
- −$591 /mo · $7,098/yr
- Insurance
- −$125
- HOA
- −$474
- Vacancy / Maint / Mgmt
- −$644
- Net cashflow
- $-340
Break-even live
Sensitivity live
| Price | -10% $-171 | -5% $-256 | +0% $-340 | +5% $-425 | +10% $-510 |
|---|---|---|---|---|---|
| Rent | -10% $-583 | -5% $-462 | +0% $-340 | +5% $-219 | +10% $-98 |
| Rate | -1.0pp $-189 | -0.5pp $-264 | base $-340 | +0.5pp $-418 | +1.0pp $-497 |
UW: 25.0% down · 7.5% · 30yr · 1.5% tax · 5.0% vac · 8.0% maint · 8.0% mgmt
Financing live
Cash to close
- Down payment
- $75,000
- Closing costs
- $9,000
- Reserves months
- —
- Total cash needed
- —
Loan-product check · same deal, 3 products live
Conventional
25% down · 7.5% · 30yr
- Down + closing
- —
- Monthly P&I
- —
- Monthly cashflow
- —
- DSCR
- —
- Eligible?
- —
Personal DTI + credit; lowest rate.
DSCR
20% down · 8.5% · 30yr
- Down + closing
- —
- Monthly P&I
- —
- Monthly cashflow
- —
- DSCR
- —
- Eligible?
- —
No personal income docs; deal must DSCR.
Hard money
10% down · 12.0% · 12mo
- Down + closing
- —
- Monthly P&I
- —
- Monthly cashflow
- —
- DSCR
- —
- Eligible?
- —
Short-term bridge; refi at stabilization.
Rent comps 14 comps
| Address | Beds | Baths | Sqft | Rent | $/sqft | DOM | Units | Dist |
|---|---|---|---|---|---|---|---|---|
| 105 World of Tennis Sq Lakeway, TX | 3.0 | 3.0 | 2192 | $2,500 | $1.14 | 26d | 1 | 0.03mi |
| 120 World of Tennis Sq Lakeway, TX | 4.0 | 4.0 | 2192 | $3,495 | $1.59 | 6d | 1 | 0.05mi |
| 204 World of Tennis Sq Lakeway, TX | 4.0 | 4.0 | 2192 | $2,950 | $1.35 | 45d | 1 | 0.18mi |
| 208 Maxwell Way Lakeway, TX | 4.0 | 3.0 | 2146 | $4,100 | $1.91 | 19d | 1 | 0.23mi |
| 4 Muirfield Greens Cv Lakeway, TX | 4.0 | 2.5 | 2188 | $2,800 | $1.28 | 6d | 1 | 0.47mi |
| 1 Crystal Springs Ct The Hills, TX | 4.0 | 4.0 | 2789 | $2,999 | $1.08 | 26d | 1 | 0.53mi |
| 611 Lido St Lakeway, TX | 3.0 | 2.5 | 2155 | $3,150 | $1.46 | 0d | 1 | 0.55mi |
| 126 Lido St Lakeway, TX | 3.0 | 2.0 | 2472 | $3,400 | $1.38 | 6d | 1 | 0.56mi |
| 100 Lido Cir Lakeway, TX | 2.0–3.0 | 1.5–3.0 | 1637 | $2,300 | $1.41 | 6d | 1 | 0.85mi |
| 110 Pennybacker Ln Austin, TX | 4.0 | 3.5 | 2872 | $4,500 | $1.57 | 16d | 1 | 0.89mi |
| 112 Highlander Cv Lakeway, TX | 3.0 | 3.0 | 2480 | $2,900 | $1.17 | 12d | 1 | 1.04mi |
| 1 Madrone Estates CV Lakeway, TX | 1.0–3.0 | 1.0–2.5 | 1114 | $1,953 | $1.75 | 0d | 1 | 1.13mi |
| 6 Sunview Rd The Hills, TX | 3.0 | 3.5 | 2590 | $3,495 | $1.35 | 6d | 1 | 1.19mi |
| 103 Comet Lakeway, TX | 3.0 | 2.0 | 2359 | $2,750 | $1.17 | 45d | 1 | 1.27mi |
HOA detail condo
- Monthly dues
- $474 · $5,688/yr
- Assessments
- None detected in remarks — confirm with the listing agent.
Listing history 24 events
-
2026-06-21days on market $299,999 Active 45 DOM
-
2026-06-18days on market $299,999 Active 42 DOM
-
2026-06-17days on market $299,999 Active 41 DOM
-
2026-06-16days on market $299,999 Active 40 DOM
-
2026-06-15days on market $299,999 Active 39 DOM
-
2026-06-13pricedays on market $299,999 Active 37 DOM
-
2026-06-09days on market $319,000 Active 33 DOM
-
2026-06-08days on market $319,000 Active 32 DOM
-
2026-06-07days on market $319,000 Active 31 DOM
-
2026-06-04days on market $319,000 Active 28 DOM
-
2026-06-03days on market $319,000 Active 27 DOM
-
2026-06-02days on market $319,000 Active 26 DOM
-
2026-06-01days on market $319,000 Active 25 DOM
-
2026-05-31days on market $319,000 Active 24 DOM
-
2026-05-07$319,000 Active 626-char remark
-
2025-11-20price
-
2025-10-10Active
-
2025-09-08price
-
2025-08-02Active
-
2025-06-02price
-
2025-02-13price
-
2025-01-28Active
-
1999-07-07soldstatus
-
1984-05-16soldstatus
ⓘ Source: listings_history table (triggers on properties + properties_extension) + one-shot
backfill from property_details.listing_events for pre-trigger history.
Tax reassessment forecast TX · Resets to sale price
- Current annual tax
- $7,098 · $591/mo
- Projected year-2 tax
- $7,098 · $591/mo
- Expected delta
- $0/yr ($0/mo · 0.0%)
ⓘ Screening estimate from a state-policy table — verify with the county assessor before closing.
Climate risk First Street
- Flood 1/10 Low FEMA zone X (unshaded) · 0% chance over 30 yrs
- Wildfire 4/10 Moderate
- Heat 8/10 Severe 7 d/yr ≥107°F today · 22 d/yr by 30 yrs out
- Wind 6/10 Major 65% chance of damaging wind over 30 yrs
- Air quality 1/10 Low 0 unhealthy d/yr today · 0 by 30 yrs out
Nearby sold comps map
Loading sold comps map…
Walkable amenities ~0.75 mi
Loading nearby amenities…
Taxation est. · year 1
- Rental income
- $36,808
- − Mortgage interest
- −$16,805
- − Property taxes
- −$7,098
- − Insurance
- −$1,500
- − Repairs & maintenance
- −$2,945
- − Management
- −$2,945
- − HOA
- −$5,688
- − Depreciation
- −$8,727
- Taxable loss
- −$8,899
- Est. tax savings @ 24.0%
- +$2,136
- After-tax cash flow
- $-1,950/yr
For passive investors: Depreciation is non-cash, so a rental often shows a tax loss while cash-flowing — sheltering income. Rental losses are passive: they offset passive income freely, and up to $25,000/yr can offset ordinary (W-2) income if you actively participate and your MAGI is under $100k (phasing out to $0 by $150k); unused losses carry forward. On sale, claimed depreciation is recaptured at up to 25%, and gains may owe capital-gains tax (a 1031 exchange can defer both). Figures are a year-1 estimate at your 24.0% rate — not tax advice; consult a CPA.
Schools (NCES district)
- District
- Lake Travis ISD
- NCES district ID
- 4826470
- Math proficiency
- 57% ▼ -12.00%
- Reading proficiency
- 61% ▼ -9.00%
- Median HH income
- $101,194
- Composite
- 55.13/100
- National rank
- #1283
- State rank
- #39 of 826 in TX
Livability — Lakeway
- Score
- 71/100
- State rank
- #330
- US rank
- #7227
Category grades
Schools grade is shown separately in the Schools card above.
Census & demographics
- Census place
- Lakeway, TX
- County
- Travis County · 1,299,254 people
- City population
- 22,145
- Metro
- Austin-Round Rock-Georgetown, TX
- Population (ZIP)
- 31,019
- Household income
- $183,048
- Rent vs Own
- Severe rent burden
- 611.0
Population outlook (Travis County) Hauer SSP2
- Today (2025)
- 1,545,133 people
- By 2030
- 1,729,269 · +11.9%
- By 2040
- 2,097,596 · +35.8%
- By 2050
- 2,463,890 · +59.5%
- By 2075
- 3,249,374 · +110.3%
- By 2100
- 3,801,868 · +146.1%
Race, ethnicity, and origin ACS 2023
- Neighborhood character
- Predominantly White (69%)
- Race & ethnicity
- White 69% Asian 14% Hispanic / Latino 12% Two or more races 8% Black 3%
- Hispanic origin (detail)
- Mexican 7%
- Common ancestry
- Italian 10% Romanian 3% Slovak 3%
- Foreign-born
- 15% · Canada, China, Vietnam
- Languages at home
- 81% English-only · Spanish 7% Other Indo-European 6% Chinese 3%
Political lean MEDSL · Travis
- 2024 margin
- Solid D (+39.3) · D 68.8% · R 29.4% · Other 1.8%
- 2008→2024 swing
- +9.9pp toward D · 2008: 29.4pp · 2024: 39.3pp
- All cycles
- 2024: D+39.3 2020: D+45.0 2016: D+38.9 2012: D+23.9 2008: D+29.4
Not yet ingested
- Civics
- —
Market trends
- HPI YoY
- ▼ -30.28%
- Current HPI
- 518.22
- Rent YoY
- ▼ -1.22%
- Metro
- Austin-Round Rock-Georgetown, TX
- State GDP YoY
- ▲ 3.95%
- F500 in state
- 110
Industry mix (Fortune 500 HQ in TX)
| Industry | F500 HQs | Revenue |
|---|---|---|
| Energy | 16 | $1,198B |
|
||
| Technology | 5 | $198B |
|
||
| Engineering / Construction | 4 | $72B |
|
||
| Energy Services | 3 | $60B |
|
||
| Utilities | 3 | $41B |
|
||
| Healthcare | 2 | $330B |
|
||
Price history
-6.0% since first listed11 events — show timeline
- 2026-06-12 Price Changed $299,999 Unlock MLS
- 2026-05-07 Listed $319,000 Unlock MLS
- 2025-11-20 Price Changed — Unlock MLS
- 2025-10-10 Listed — Unlock MLS
- 2025-09-08 Price Changed — Unlock MLS
- 2025-08-02 Listed — Unlock MLS
- 2025-06-02 Price Changed — Unlock MLS
- 2025-02-13 Price Changed — Unlock MLS
- 2025-01-28 Listed — Unlock MLS
- 1999-07-07 Sold (Public Records) — Public Records
- 1984-05-16 Sold (Public Records) — Public Records
Property tax history
+3.4%/yrLatest (2026): $7,098 · -6.4% YoY. Source: county tax records.
Cash-flow waterfall
monthlySold comps — $/sqft
last 12 mo · ≤1 miLoading sold comps…