 🌊 Lakefront
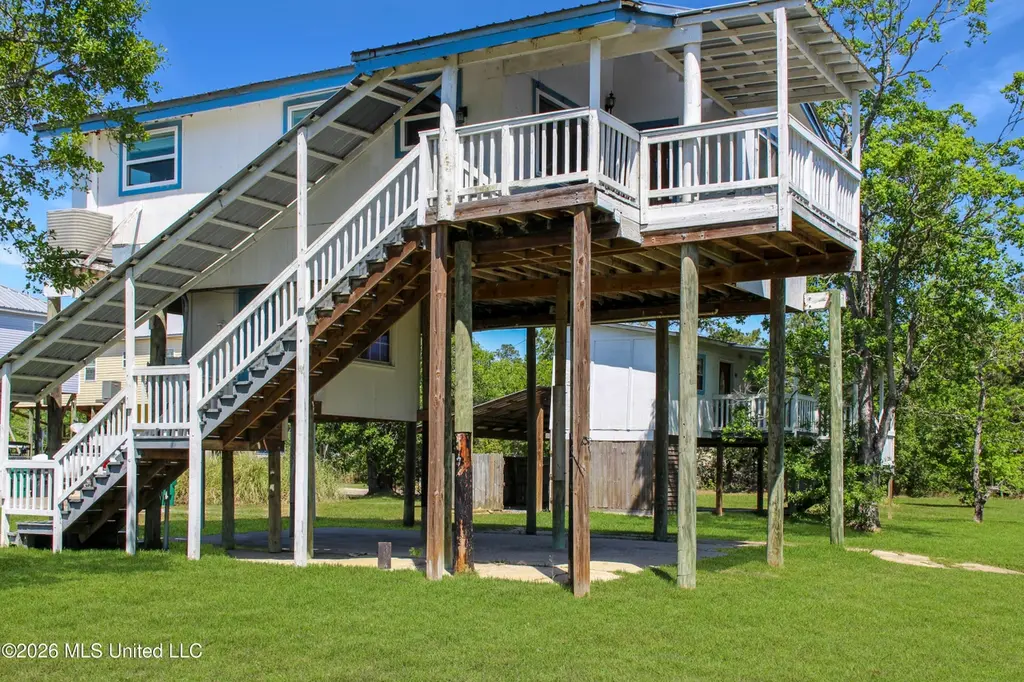
4021 Sailfish St · Bay St. Louis, MS
Flood risk 10/10 · Severe
- FEMA flood zone
- AE
- Chance of flooding over 30 yrs
- 0.99%
- Est. flood insurance / yr
- $1,737 – $8,500
Fire risk 2/10 · Minimal
- Est. fire insurance / yr
- $1,241 – $2,305
Heat risk 10/10 · Severe
- Hot days now (above 107°F)
- 7 days/yr
- Hot days in 30 yrs
- 21 days/yr
Wind risk 10/10 · Severe
- Chance of severe wind over 30 yrs
- 99.0%
Air-quality risk 1/10 · Minimal
- Unhealthy air days now
- 0 days/yr
- Unhealthy air days in 30 yrs
- 0 days/yr
Risk factors via First Street. Map © Google.
Why this score? — see what drove the C+ grade
The composite is a weighted blend of 9 inputs, each scored 0–100. Each bar is that input's sub-score; the figure is the points it added to the 100-point composite (weight × sub-score).
- Cash flow +28.1/30.0
- DSCR +10.0/10.0
- 1% rule +7.6/10.0
- ARV discount +7.5/15.0
- Schools +3.9/10.0
- Rent growth +2.5/5.0
- Livability +2.5/5.0
- Condition / age +2.5/5.0
- Appreciation +0.0/10.0
$139,900
🖨 Deal sheet (PDF) 📄 Offer letter ✓ Due diligence
Listing remarks
Oversized waterfront lot with private boat ramp! This unique property offers water frontage on two sides, providing incredible views and easy access for boating and fishing. The main camp features 2 bedrooms, 1 bathroom, and an open floor plan that's perfect for relaxing weekend getaways. Enjoy outdoor living on the covered deck overlooking the water--ideal for morning coffee or evening sunsets. A second, energy-efficient unit on the property offers additional space and also includes its own covered deck, making it great for guests, rental income, or a separate retreat. The large lot gives you all the room you need for playing, and boat parking. All this located just minutes from I-10, offe
Key facts
- Covered deck
- Water frontage
- Private boat ramp
Tags
Property features AI
Finance
- HOA & community: Community amenities: Boating, Fishing, Marina, RV/Boat Storage
Exterior
- Parking: Carport for 2 vehicles; Gravel parking
- Utilities: Public water; Public sewer; Electricity connected; Water connected
- Home design: Single family residence; Two-story home; Fixer condition; Entry on two levels
- Construction: Wood siding; Built on pilings/steel/wood foundation
- Exterior features: Deck; Front porch; Dock; Corner lot; Canal front waterfront
Interior
- Kitchen: Electric range; Range hood
- Bedrooms: Two levels (home has two stories)
- Flooring: Laminate flooring
- Bathrooms: 1 full bathroom
- Heating & cooling: Heat pump heating; Central air conditioning; Ceiling fan(s) for cooling
- Interior features: Ceiling fans; Open floor plan
- Laundry & utility: Laundry room; Water heater
Neighborhood map
What this means for you Summary
Snapshot
- This is a 2-bed/1.0-bath single-family listed at $140k.
Deal economics
- At list price, monthly cash flow is $12 ($142/yr) — positive.
- The deal already cash-flows at list — no discount required.
- Meets the 1% rule at list price ($2k rent vs $140k).
- Recommended offer: $138k (1.5% below list) — sets the bar for market timing.
- Cap rate 10.1% vs local median 1.8% in Bay St. Louis — top-decile yield for the area; either an underpriced asset or a hidden risk that comps aren't pricing in. Stress-test before assuming the spread holds.
Location & tenants
- Location reads: area grade C — affects rentability + tenant quality, not the cash-flow math above.
- Bay St Louis Waveland School District (suburban): math 51% / reading 43% proficiency, ranked #21 of 130 in MS (top 16%) — families likely to look elsewhere, expect single-tenant / working-renter base with shorter leases; 74% free/reduced lunch — lower-income household profile, screen leases tightly.
- Zoned schools: Waveland Elementary School (425 students, 100% FRL); Bay Waveland Middle School (math 51% / reading 42%, grade D+, #38 of 179 statewide, top 21%, 392 students, 100% FRL); Bay High School (math 47% / reading 37%, grade F, #43 of 197 statewide, top 24%, 491 students, 100% FRL) — zoned schools average 100% FRL vs 74% district-wide (26 pts higher); higher-poverty schools than district average — tighter screening recommended.
- Market conditions: 610 active listings in the ZIP; 3 comparable units currently listed for rent nearby; rentals at typical pace (median 15d on market — plan ~3-4 weeks tenant-placement turnaround); 248 units permitted in Hancock County in 2024 (0 in 5+ unit buildings).
Forward outlook
- Local home prices are declining (-3.0%/yr); year-one equity from $967 of loan paydown is wiped out by about $4k of value loss. Plan a longer hold.
- Hancock County population projected at +20% by 2050 — long-run rental-demand tailwind backs the buy-and-hold thesis.
Negotiation context
- It's been on market 19 days — a 2% lower offer ($138k) is reasonable based on typical stale-listing flexibility.
- 5 sale attempts since 3y ago with the ask held roughly flat each time — persistent listings suggest the price (not the market) is what's stuck; bring a comps-based counter.
Risks & watch-outs
- Watch-outs: flood insurance adds $427/mo.
- Climate carrying-cost: in FEMA flood zone AE (mandatory federal flood insurance); severe wind risk, 99% chance of damaging wind over 30y; extreme-heat days projected 7→21/yr by 2055 (HVAC capex compounding) — expect insurance premiums to compound above CPI over the hold.
Questions for the listing agent
- Built in 1965 — when were the roof, HVAC, electrical panel, plumbing, and water heater last replaced?
- What's the actual annual flood-insurance premium (NFIP or private), and is the property in a SFHA with mandatory coverage?
- Is there a deadline driving the sale (1031 exchange, divorce, estate, relocation)? That informs how much negotiation room exists.
- This sits on a lake — are riparian / water-frontage rights deeded with the parcel? Any dock permits, shoreline easements, or HOA water-use restrictions?
- What's the documented flood / surge / shoreline-erosion history here (FEMA AND non-FEMA — e.g., storm surge, creek backup, septic-field saturation)?
- Any water-quality or seasonal algae-bloom issues that affect tenant satisfaction or short-term-rental demand?
- What's the average days-on-market for RENTAL listings here right now (not sales)? A rising rental-DOM trend means longer vacancies and softer asking-rent achievability than the comps imply.
- What's the recent tenant-quality profile in this submarket — average credit score on applications, eviction rate, late-payment / NSF rate, and stable-employment percentage? A property-management company in the area should have these aggregated.
- How much new for-sale + rental construction is in the pipeline within 1–3 miles? Heavy new supply typically softens prices + rents 12–24 months out; constrained supply supports both.
Investment metrics
- 1% rule
- 1.26% ✓
- Cap rate
- 10.05%
- Cash-on-cash
- 13.43%
- DSCR
- 1.60
- GRM
- 6.6
CMA / ARV
- ARV (on-the-fly)
- $316,865
- Comps found
- 8
Show comp detail 8 sales within ~0.75 mi
| Address | Dist | Beds/Ba | Sqft | Sold | Price | $/sf | Match |
|---|---|---|---|---|---|---|---|
| 4099 Shark St | 0.14mi | 2/1.0 | 736 (-6%) | 22mo | $155,900 | $212 | 64 |
| 4081 Cardinal St | 0.66mi | 2/1.0 | 768 (-2%) | 12mo | $247,000 | $322 | 56 |
| 10063 Alabama St | 0.61mi | 2/1.0 | 800 (+2%) | 22mo | $239,000 | $299 | 50 |
| 5061 1st Ave | 0.69mi | 2/1.0 | 864 (+10%) | 8mo | $229,999 | $266 | 44 |
| 11024 New York St | 0.63mi | 1/1.0 (-1) | 852 (+8%) | 15mo | $280,000 | $329 | 39 |
| 4015 Cardinal St | 0.59mi | 2/1.0 | 864 (+10%) | 23mo | $289,500 | $335 | 37 |
| 4141 5th St | 0.31mi | 2/3.0 | 895 (+14%) | 24mo | $89,999 | $101 | 34 |
| 10222 E Bayou View Dr | 0.39mi | 1/1.5 (-1) | 900 (+15%) | 20mo | $234,900 | $261 | 33 |
Match score weights: distance 35% · size 25% · config 20% · recency 20%. Top-matched comps best support the ARV.
Projected returns pro-forma
-3.0% appreciation · 3.0% rent growth · sell at horizon
- IRR
- -15.5%
- Equity multiple
- 0.45×
- Total profit
- $-21,640
- Equity at exit
- $20,860
- IRR
- -6.6%
- Equity multiple
- 0.57×
- Total profit
- $-16,744
- Equity at exit
- $12,096
Cash invested: $39,172 (down + closing). Projections, not guarantees.
Landlord ↔ Tenant lean methodology
- Overall (STATE)
- 90 Strongly Landlord-Friendly
- State Mississippi
- 90 Strongly Landlord-Friendly · R+11
- County
- — inherits STATE
- City
- — inherits STATE
ZIP-level market 39520
- Active inventory
- 610
- Price-to-rent
- 6.6×
Monthly cashflow live
- Estimated rent
- $1,758 medium interval (Pro) →
- Mortgage (P&I)
- −$734
- Tax from tax record
- −$159 /mo · $1,903/yr
- Insurance
- −$58
- Flood insurance flood zone
- −$427 /mo · $5,118/yr
- HOA
- −$0
- Vacancy / Maint / Mgmt
- −$369
- Net cashflow
- $12
Break-even live
Sensitivity live
| Price | -10% $91 | -5% $51 | +0% $12 | +5% $-28 | +10% $-67 |
|---|---|---|---|---|---|
| Rent | -10% $-127 | -5% $-58 | +0% $12 | +5% $81 | +10% $151 |
| Rate | -1.0pp $82 | -0.5pp $47 | base $12 | +0.5pp $-24 | +1.0pp $-61 |
UW: 25.0% down · 7.5% · 30yr · 1.5% tax · 5.0% vac · 8.0% maint · 8.0% mgmt
Financing live
Cash to close
- Down payment
- $34,975
- Closing costs
- $4,197
- Reserves months
- —
- Total cash needed
- —
Loan-product check · same deal, 3 products live
Conventional
25% down · 7.5% · 30yr
- Down + closing
- —
- Monthly P&I
- —
- Monthly cashflow
- —
- DSCR
- —
- Eligible?
- —
Personal DTI + credit; lowest rate.
DSCR
20% down · 8.5% · 30yr
- Down + closing
- —
- Monthly P&I
- —
- Monthly cashflow
- —
- DSCR
- —
- Eligible?
- —
No personal income docs; deal must DSCR.
Hard money
10% down · 12.0% · 12mo
- Down + closing
- —
- Monthly P&I
- —
- Monthly cashflow
- —
- DSCR
- —
- Eligible?
- —
Short-term bridge; refi at stabilization.
Rent comps 3 comps
| Address | Beds | Baths | Sqft | Rent | $/sqft | DOM | Units | Dist |
|---|---|---|---|---|---|---|---|---|
| 4024 Blue Jay St Bay Saint Louis, MS | 2.0 | 2.0 | 953 | $2,500 | $2.62 | 15d | 1 | 0.65mi |
| 100 Waverly Dr Bay Saint Louis, MS | 1.0–3.0 | 1.0–2.0 | 861 | $1,162 | $1.35 | 13d | 1 | 1.08mi |
| 10055 Peachtree Dr Bay St Louis, MS | 1.0 | 1.0 | 662 | $1,150 | $1.74 | 45d | 1 | 1.17mi |
Listing history 19 events
-
2026-05-07status Pending
-
2026-04-17$139,900 Active
-
2025-09-29price $260,000
-
2025-09-29historical
-
2025-08-07price $230,000
-
2025-06-05price $285,000
-
2025-05-26$265,000 Active
-
2025-05-17historical
-
2025-04-22price $265,000
-
2025-03-12$275,000 Active
-
2024-11-19historical
-
2024-09-18price $281,900
-
2024-08-14price $299,900
-
2024-06-26$321,900 Active
-
2023-08-09historical
-
2023-07-08price $437,000
-
2023-06-17price $438,000
-
2023-06-04$440,000 Active
-
1995-09-12soldstatus
ⓘ Source: listings_history table (triggers on properties + properties_extension) + one-shot
backfill from property_details.listing_events for pre-trigger history.
Tax reassessment forecast MS · Resets to sale price
- Current annual tax
- $1,903 · $159/mo
- Projected year-2 tax
- $1,903 · $159/mo
- Expected delta
- $0/yr ($0/mo · 0.0%)
ⓘ Screening estimate from a state-policy table — verify with the county assessor before closing.
Climate risk First Street
- Flood 10/10 Extreme FEMA zone AE · 99% chance over 30 yrs
- Wildfire 2/10 Low
- Heat 10/10 Extreme 7 d/yr ≥107°F today · 21 d/yr by 30 yrs out
- Wind 10/10 Extreme 99% chance of damaging wind over 30 yrs
- Air quality 1/10 Low 0 unhealthy d/yr today · 0 by 30 yrs out
Nearby sold comps map
Loading sold comps map…
Walkable amenities ~0.75 mi
Loading nearby amenities…
Taxation est. · year 1
- Rental income
- $21,097
- − Mortgage interest
- −$7,837
- − Property taxes
- −$1,903
- − Insurance
- −$5,818
- − Repairs & maintenance
- −$1,688
- − Management
- −$1,688
- − Depreciation
- −$4,070
- Taxable loss
- −$1,906
- Est. tax savings @ 24.0%
- +$457
- After-tax cash flow
- $599/yr
For passive investors: Depreciation is non-cash, so a rental often shows a tax loss while cash-flowing — sheltering income. Rental losses are passive: they offset passive income freely, and up to $25,000/yr can offset ordinary (W-2) income if you actively participate and your MAGI is under $100k (phasing out to $0 by $150k); unused losses carry forward. On sale, claimed depreciation is recaptured at up to 25%, and gains may owe capital-gains tax (a 1031 exchange can defer both). Figures are a year-1 estimate at your 24.0% rate — not tax advice; consult a CPA.
Schools (NCES district)
- District
- Bay St Louis Waveland School District
- NCES district ID
- 2800570
- Math proficiency
- 51% ▲ 4.00%
- Reading proficiency
- 43% ▼ -3.00%
- Median HH income
- $38,774
- Composite
- 39.27/100
- National rank
- #3998
- State rank
- #21 of 130 in MS
Livability — Bay St. Louis
No livability data for this city. (Only ~50 U.S. cities are tracked.)
Census & demographics
- Census place
- Bay St. Louis, MS
- Population (ZIP)
- 15,471
Population outlook (Hancock County) Hauer SSP2
- Today (2025)
- 52,161 people
- By 2030
- 54,753 · +5.0%
- By 2040
- 59,242 · +13.6%
- By 2050
- 62,417 · +19.7%
- By 2075
- 68,168 · +30.7%
- By 2100
- 69,212 · +32.7%
Race, ethnicity, and origin ACS 2023
- Neighborhood character
- Predominantly White (80%)
- Race & ethnicity
- White 80% Black 11% Two or more races 6% Hispanic / Latino 3% Asian 1%
- Common ancestry
- Lithuanian 15% Romanian 2% Serbian 2%
- Foreign-born
- 3% · Canada, China
- Languages at home
- 96% English-only · Spanish 2% Chinese 1%
Political lean MEDSL · Hancock
- 2024 margin
- Solid R (+58.7) · D 20.1% · R 78.8% · Other 1.1%
- 2008→2024 swing
- -4.4pp toward R · 2008: -54.2pp · 2024: -58.7pp
- All cycles
- 2024: R+58.7 2020: R+55.5 2016: R+59.4 2012: R+52.8 2008: R+54.2
Not yet ingested
- Civics
- —
Market trends
- HPI YoY
- ▼ -169.80%
- Current HPI
- 227.2103
- Rent YoY
- —
- Metro
- —
- State GDP YoY
- —
- F500 in state
- 0
Price history
-68.2% since first listed19 events — show timeline
- 2026-05-07 Pending — MLSU
- 2026-04-17 Listed $139,900 MLSU
- 2025-09-29 Listing Removed — MLSU
- 2025-09-29 Price Changed $260,000 MLSU
- 2025-08-07 Price Changed $230,000 MLSU
- 2025-06-05 Price Changed $285,000 MLSU
- 2025-05-26 Listed $265,000 MLSU
- 2025-05-17 Listing Removed — MLSU
- 2025-04-22 Price Changed $265,000 MLSU
- 2025-03-12 Listed $275,000 MLSU
- 2024-11-19 Listing Removed — MLSU
- 2024-09-18 Price Changed $281,900 MLSU
- 2024-08-14 Price Changed $299,900 MLSU
- 2024-06-26 Listed $321,900 MLSU
- 2023-08-09 Listing Removed — MLSU
- 2023-07-08 Price Changed $437,000 MLSU
- 2023-06-17 Price Changed $438,000 MLSU
- 2023-06-04 Listed $440,000 MLSU
- 1995-09-12 Sold (Public Records) — Public Records
Property tax history
+4.7%/yrLatest (2025): $1,903 · +0.0% YoY. Source: county tax records.
Cash-flow waterfall
monthlySold comps — $/sqft
last 12 mo · ≤1 miLoading sold comps…