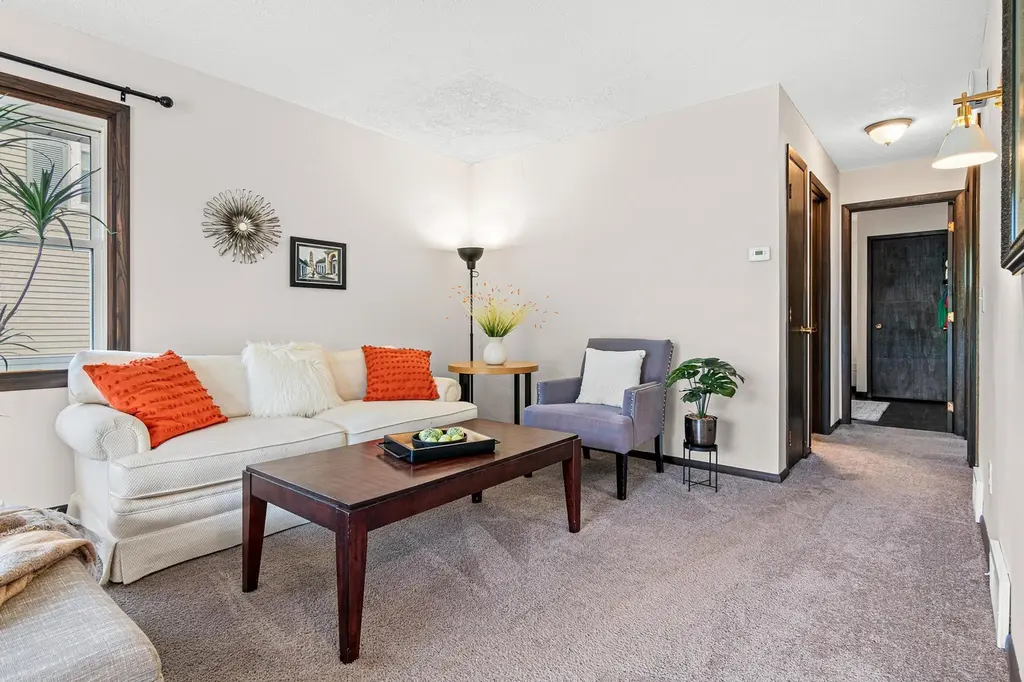
5963 Idlewood Rd · Mound, MN
Flood risk 1/10 · Minimal
- FEMA flood zone
- X (unshaded)
- Chance of flooding over 30 yrs
- 0.0%
- Est. flood insurance / yr
- $473 – $860
Fire risk 1/10 · Minimal
- Est. fire insurance / yr
- $888 – $1,650
Heat risk 2/10 · Minimal
- Hot days now (above 98°F)
- 7 days/yr
- Hot days in 30 yrs
- 14 days/yr
Wind risk 2/10 · Minimal
- Chance of severe wind over 30 yrs
- —
Air-quality risk 2/10 · Minimal
- Unhealthy air days now
- 1 days/yr
- Unhealthy air days in 30 yrs
- 1 days/yr
Risk factors via First Street. Map © Google.
Why this score? — see what drove the D grade
The composite is a weighted blend of 9 inputs, each scored 0–100. Each bar is that input's sub-score; the figure is the points it added to the 100-point composite (weight × sub-score).
- Cash flow +11.8/30.0
- ARV discount +7.5/15.0
- Schools +5.9/10.0
- Livability +4.2/5.0
- DSCR +3.5/10.0
- 1% rule +2.5/10.0
- Rent growth +2.5/5.0
- Condition / age +2.5/5.0
- Appreciation +0.0/10.0
$379,900
🖨 Deal sheet 📄 Offer letter ✓ Due diligence
Key facts
- 6,534 sq ft lot
- 2 garage spots
- Built 1972
Neighborhood map
What this means for you Summary
Snapshot
- This is a 4-bed/2.0-bath single-family listed at $380k.
Deal economics
- At list price, monthly cash flow is $-106 ($-1k/yr) — negative.
- To cash-flow at today's rent, offer at most $361k (4.9% below list).
- To meet the 1% rule (rent ≥ 1% of price), the offer needs to be $285k (25.0% below list).
- Recommended offer: $285k (25.0% below list) — sets the bar for 1% rule.
- Cap rate 6.0% vs local median 1.8% in Mound — top-decile yield for the area; either an underpriced asset or a hidden risk that comps aren't pricing in. Stress-test before assuming the spread holds.
Location & tenants
- Location reads 85/100 on livability (#20 in MN, #559 nationally) — a professional / high-income tenant draw. Strengths: schools A+, crime A+, commute A+; Watch: amenities F.
- Westonka Public School District (rural): math 65% / reading 68% proficiency, ranked #14 of 301 in MN (top 5%) — acceptable for families but not a draw, mixed tenant base, ~2y average lease; only 14% free/reduced lunch — higher-income household profile.
- Market conditions: 147 active listings in the ZIP; 2 comparable units currently listed for rent nearby; solid renter incomes; 4,651 units permitted in Hennepin County in 2024 (2,443 in 5+ unit buildings).
- This rent runs 31% of the median local income ($109k/yr) — at the standard rent-burdened threshold; future hikes will face affordability resistance.
Forward outlook
- Local home prices are declining (-3.0%/yr); year-one equity from $3k of loan paydown is wiped out by about $11k of value loss. Plan a longer hold.
- Hennepin County population projected at +30% by 2050 — long-run rental-demand tailwind backs the buy-and-hold thesis.
Negotiation context
- It's been on market 21 days — a 2% lower offer ($374k) is reasonable based on typical stale-listing flexibility.
- 2 sale attempts with the ask held roughly flat each time — persistent listings suggest the price (not the market) is what's stuck; bring a comps-based counter.
- Current owner paid $24k; list at $380k implies a 1451% gain — meaningful room to come down on a strong offer.
Questions for the listing agent
- What do current leases actually rent for vs. the listed asking? Can we see a recent rent roll and the last 12 months of T-12 income?
- Built in 1972 — when were the roof, HVAC, electrical panel, plumbing, and water heater last replaced?
- Is there a deadline driving the sale (1031 exchange, divorce, estate, relocation)? That informs how much negotiation room exists.
- Schools are A-rated — typically a magnet for longer-tenancy family renters. What's the average tenant stay here, and is there a school-zone premium baked into asking?
- The area grade is low — what's the realistic commute time and amenity access for the typical tenant pool here? Any planned neighborhood developments (good or bad) we should know about?
- What's the average days-on-market for RENTAL listings here right now (not sales)? A rising rental-DOM trend means longer vacancies and softer asking-rent achievability than the comps imply.
- What's the recent tenant-quality profile in this submarket — average credit score on applications, eviction rate, late-payment / NSF rate, and stable-employment percentage? A property-management company in the area should have these aggregated.
- How much new for-sale + rental construction is in the pipeline within 1–3 miles? Heavy new supply typically softens prices + rents 12–24 months out; constrained supply supports both.
Investment metrics
- 1% rule
- 0.75% ✗
- Cap rate
- 5.96%
- Cash-on-cash
- -1.19%
- DSCR
- 0.95
- GRM
- 11.1
CMA / ARV
No comps found within radius.
Projected returns pro-forma
-3.0% appreciation · 3.0% rent growth · sell at horizon
- IRR
- -18.3%
- Equity multiple
- 0.36×
- Total profit
- $-68,416
- Equity at exit
- $56,644
- IRR
- -10.7%
- Equity multiple
- 0.35×
- Total profit
- $-68,741
- Equity at exit
- $32,847
Cash invested: $106,372 (down + closing). Projections, not guarantees.
Landlord ↔ Tenant lean methodology
- Overall (STATE)
- 46 Balanced
- State Minnesota
- 46 Balanced · D+2
- County
- — inherits STATE
- City
- — inherits STATE
ZIP-level market 55364
- Active inventory
- 147
- Price-to-rent
- 11.1×
Monthly cashflow live
- Estimated rent
- $2,850 medium interval (Pro) →
- Mortgage (P&I)
- −$1,992
- Tax from tax record
- −$206 /mo · $2,477/yr
- Insurance
- −$158
- HOA
- −$0
- Vacancy / Maint / Mgmt
- −$598
- Net cashflow
- $-106
Break-even live
UW: 25.0% down · 7.5% · 30yr · 1.5% tax · 5.0% vac · 8.0% maint · 8.0% mgmt
Financing live
Cash to close
- Down payment
- $94,975
- Closing costs
- $11,397
- Reserves months
- —
- Total cash needed
- —
Loan-product check · same deal, 3 products live
Conventional
25% down · 7.5% · 30yr
- Down + closing
- —
- Monthly P&I
- —
- Monthly cashflow
- —
- DSCR
- —
- Eligible?
- —
Personal DTI + credit; lowest rate.
DSCR
20% down · 8.5% · 30yr
- Down + closing
- —
- Monthly P&I
- —
- Monthly cashflow
- —
- DSCR
- —
- Eligible?
- —
No personal income docs; deal must DSCR.
Hard money
10% down · 12.0% · 12mo
- Down + closing
- —
- Monthly P&I
- —
- Monthly cashflow
- —
- DSCR
- —
- Eligible?
- —
Short-term bridge; refi at stabilization.
Rent comps 2 comps
| Address | Beds | Baths | Sqft | Rent | $/sqft | DOM | Units | Dist |
|---|---|---|---|---|---|---|---|---|
| 5912 Bartlett Blvd Mound, MN | 4.0 | 2.5 | 2500 | $7,000 | $2.80 | 1d | 1 | 0.22mi |
| 4870 Glasgow Rd Mound, MN | 3.0 | 3.0 | 2592 | $2,924 | $1.13 | 3d | 1 | 1.46mi |
Listing history 17 events
-
2026-06-18days on market $379,900 Active 21 DOM
-
2026-06-17days on market $379,900 Active 20 DOM
-
2026-06-16days on market $379,900 Active 19 DOM
-
2026-06-15days on market $379,900 Active 18 DOM
-
2026-06-13days on market $379,900 Active 16 DOM
-
2026-06-09days on market $379,900 Active 12 DOM
-
2026-06-08days on market $379,900 Active 11 DOM
-
2026-06-07days on market $379,900 Active 10 DOM
-
2026-06-04days on market $379,900 Active 7 DOM
-
2026-06-03days on market $379,900 Active 6 DOM
-
2026-06-02days on market $379,900 Active 5 DOM
-
2026-06-01days on market $379,900 Active 4 DOM
-
2026-05-31days on market $379,900 Active 3 DOM
-
2026-05-28$379,900 Active
-
2025-03-13historical $2,400
-
2025-02-10$2,400
-
1973-03-01soldstatus $24,500
ⓘ Source: listings_history table (triggers on properties + properties_extension) + one-shot
backfill from property_details.listing_events for pre-trigger history.
Tax reassessment forecast MN · Partial reset (capped growth)
- Current annual tax
- $2,477 · $206/mo
- Projected year-2 tax
- $3,366 · $280/mo
- Expected delta
- +$889/yr (+$74/mo · 35.9%)
ⓘ Screening estimate from a state-policy table — verify with the county assessor before closing.
Climate risk First Street
- Flood 1/10 Low FEMA zone X (unshaded) · 0% chance over 30 yrs
- Wildfire 1/10 Low
- Heat 2/10 Low 7 d/yr ≥98°F today · 14 d/yr by 30 yrs out
- Wind 2/10 Low
- Air quality 2/10 Low 1 unhealthy d/yr today · 1 by 30 yrs out
Nearby sold comps map
Loading sold comps map…
Walkable amenities ~0.75 mi
Loading nearby amenities…
Taxation est. · year 1
- Rental income
- $34,196
- − Mortgage interest
- −$21,280
- − Property taxes
- −$2,477
- − Insurance
- −$1,900
- − Repairs & maintenance
- −$2,736
- − Management
- −$2,736
- − Depreciation
- −$11,052
- Taxable loss
- −$7,984
- Est. tax savings @ 24.0%
- +$1,916
- After-tax cash flow
- $647/yr
For passive investors: Depreciation is non-cash, so a rental often shows a tax loss while cash-flowing — sheltering income. Rental losses are passive: they offset passive income freely, and up to $25,000/yr can offset ordinary (W-2) income if you actively participate and your MAGI is under $100k (phasing out to $0 by $150k); unused losses carry forward. On sale, claimed depreciation is recaptured at up to 25%, and gains may owe capital-gains tax (a 1031 exchange can defer both). Figures are a year-1 estimate at your 24.0% rate — not tax advice; consult a CPA.
Schools (NCES district)
- District
- Westonka Public School District
- NCES district ID
- 2722920
- Math proficiency
- 65% ▼ -14.00%
- Reading proficiency
- 68% ▼ -10.00%
- Median HH income
- $80,965
- Composite
- 59.42/100
- National rank
- #928
- State rank
- #14 of 301 in MN
Livability — Mound
- Score
- 85/100
- State rank
- #20
- US rank
- #559
Category grades
Schools grade is shown separately in the Schools card above.
Census & demographics
- Census place
- Mound, MN
- County
- Hennepin County · 1,150,272 people
- City population
- 14,097
- Metro
- Minneapolis-St. Paul-Bloomington, MN-WI
- Population (ZIP)
- 14,097
- Household income
- $108,725
- Rent vs Own
- Severe rent burden
- 198.0
Population outlook (Hennepin County) Hauer SSP2
- Today (2025)
- 1,405,227 people
- By 2030
- 1,492,650 · +6.2%
- By 2040
- 1,660,157 · +18.1%
- By 2050
- 1,823,498 · +29.8%
- By 2075
- 2,221,283 · +58.1%
- By 2100
- 2,509,976 · +78.6%
Race, ethnicity, and origin ACS 2023
- Neighborhood character
- Predominantly White (89%)
- Race & ethnicity
- White 89% Two or more races 5% Hispanic / Latino 2% Black 1% Asian 1%
- Common ancestry
- Portuguese 19% Lithuanian 3% Slovak 3%
- Foreign-born
- 7% · Canada, China
- Languages at home
- 92% English-only · Spanish 4% Russian/Polish/Slavic 1% Chinese 1%
Political lean MEDSL · Hennepin
- 2024 margin
- Solid D (+42.6) · D 70.2% · R 27.5% · Other 2.3%
- 2008→2024 swing
- +14.0pp toward D · 2008: 28.6pp · 2024: 42.6pp
- All cycles
- 2024: D+42.6 2020: D+43.2 2016: D+35.3 2012: D+27.1 2008: D+28.6
Not yet ingested
- Civics
- —
Market trends
- HPI YoY
- ▼ -395.23%
- Current HPI
- 249.0081
- Rent YoY
- —
- Metro
- Minneapolis-St. Paul-Bloomington, MN-WI
- State GDP YoY
- ▲ 2.41%
- F500 in state
- 34
Industry mix (Fortune 500 HQ in MN)
| Industry | F500 HQs | Revenue |
|---|---|---|
| Healthcare | 2 | $407B |
|
||
| Retail | 2 | $150B |
|
||
| Consumer Goods | 2 | $32B |
|
||
| Industrial Machinery | 2 | $6B |
|
||
| Agriculture | 1 | $40B |
|
||
| Healthcare / Medical Devices | 1 | $32B |
|
||
Price history
+1450.6% since first listed4 events — show timeline
- 2026-05-28 Listed $379,900 NORTHSTARMLS as Distributed by MLS Grid
- 2025-03-13 Rental Removed $2,400 TURBOTENANT
- 2025-02-10 Listed for Rent $2,400 TURBOTENANT
- 1973-03-01 Sold (Public Records) $24,500 Public Records
Property tax history
+1.2%/yrLatest (2025): $2,477 · -20.3% YoY. Source: county tax records.
Cash-flow waterfall
monthlySold comps — $/sqft
last 12 mo · ≤1 miLoading sold comps…