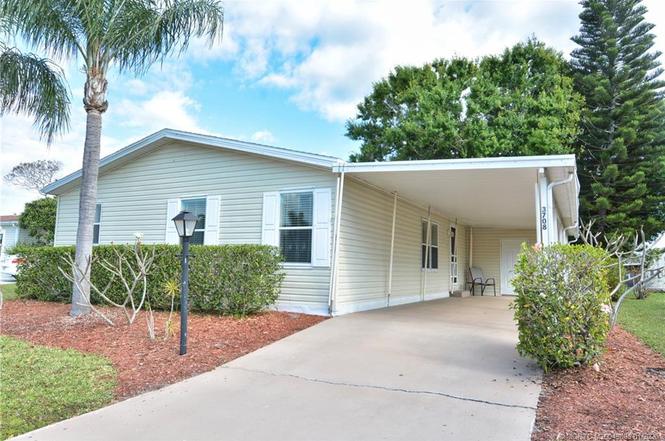
3708 Hydrilla Ct · Indian River Estates, FL
Flood risk 1/10 · Minimal
- FEMA flood zone
- X (unshaded)
- Chance of flooding over 30 yrs
- 0.0%
- Est. flood insurance / yr
- $507 – $1,088
Fire risk 5/10 · Moderate
- Est. fire insurance / yr
- $947 – $1,759
Heat risk 10/10 · Severe
- Hot days now (above 106°F)
- 7 days/yr
- Hot days in 30 yrs
- 24 days/yr
Wind risk 10/10 · Severe
- Chance of severe wind over 30 yrs
- 99.0%
Air-quality risk 2/10 · Minimal
- Unhealthy air days now
- 1 days/yr
- Unhealthy air days in 30 yrs
- 1 days/yr
Risk factors via First Street. Map © Google.
Why this score? — see what drove the B+ grade
The composite is a weighted blend of 9 inputs, each scored 0–100. Each bar is that input's sub-score; the figure is the points it added to the 100-point composite (weight × sub-score).
- Cash flow +30.0/30.0
- ARV discount +15.0/15.0
- 1% rule +10.0/10.0
- DSCR +10.0/10.0
- Schools +3.7/10.0
- Livability +3.2/5.0
- Rent growth +3.0/5.0
- Condition / age +2.5/5.0
- Appreciation +0.0/10.0
$99,900
🖨 Deal sheet (PDF) 📄 Offer letter ✓ Due diligence
Listing remarks
"30000.00 PRICE DROP. SELLER READY TO SELL AT THIS ROCK BOTTOM PRICE. " "FINANCING AVAILABLE" This fabulous home is vacant and ready for you to move in. Split floor plan great for privacy. Screened patio for your enjoyment. All appliances included. This amazing community offers a live theater, tennis courts, golf course, 3 club houses that offer pools, gyms and tennis courts. Beautiful Grille Restaurant with wonderful food. Stop in and try it while you're checking out the area. Land lease property.
Key facts
- Screened patio
- Split floor plan
- Tennis courts
Tags
Property features AI
Finance
- Other: Pets allowed with number and size limits
- Financial info: Land lease: $550
- HOA & community: Homeowners association with a $285 monthly fee; HOA fee covers common areas, cable TV, internet, and trash; Senior community
Exterior
- Parking: 1 total parking space; 1 covered parking space
- Utilities: Electricity available
- Home design: Single-story home; Resale property
- Exterior features: Community pool; Community amenities include basketball court, billiard room, clubhouse, fitness center, golf, gated entry, kitchen facilities, library, pickleball, on-site property manager, restaurant, sauna, shuffleboard, and tennis courts
Interior
- Bathrooms: 2 full bathrooms
- Heating & cooling: Central heating (electric); Central air conditioning (electric); Ceiling fans
- Interior features: Unfurnished
Neighborhood map
What this means for you Summary
Snapshot
- This is a 2-bed/2.0-bath manufactured listed at $100k.
Deal economics
- At list price, monthly cash flow is $557 ($7k/yr) — positive.
- The deal already cash-flows at list — no discount required.
- Meets the 1% rule at list price ($2k rent vs $100k).
- Recommended offer: $88k (12.0% below list) — sets the bar for market timing.
- Cap rate 13.0% vs local median 5.3% in Indian River Estates — top-decile yield for the area; either an underpriced asset or a hidden risk that comps aren't pricing in. Stress-test before assuming the spread holds.
Location & tenants
- Location reads 65/100 on livability (#653 in FL) — a middle-class / working-renter tenant base. Strengths: cost of living A+, housing A+, crime B+; Watch: employment D+, amenities F, commute F.
- St. Lucie (urban): math 40% / reading 48% proficiency, ranked #51 of 73 in FL (top 70%) — families likely to look elsewhere, expect single-tenant / working-renter base with shorter leases.
- Zoned schools: Manatee Academy K-8 (math 53% / reading 51%, grade C-, #990 of 2,144 statewide, top 48%, 1,664 students, 65% FRL); Southern Oaks Middle School (math 39% / reading 43%, grade F, #353 of 571 statewide, top 63%, 894 students, 76% FRL); Fort Pierce Central High School (math 15% / reading 45%, grade F, #441 of 667 statewide, top 67%, 3,091 students, 62% FRL).
- Market conditions: Rents rising (+1.9%/yr); 645 active listings in the ZIP; 8 comparable units currently listed for rent nearby; rentals at typical pace (median 16d on market — plan ~3-4 weeks tenant-placement turnaround); 4,868 units permitted in St. Lucie County in 2024 (268 in 5+ unit buildings).
- This rent runs 41% of the median local income ($62k/yr) — at the standard rent-burdened threshold; future hikes will face affordability resistance.
Forward outlook
- Local home prices are declining (-3.0%/yr); year-one equity from $691 of loan paydown is wiped out by about $3k of value loss. Plan a longer hold.
- St. Lucie County population projected at +20% by 2050 — long-run rental-demand tailwind backs the buy-and-hold thesis.
- At projected returns (-3.0% appreciation + 1.9% rent growth), your $28k cash investment doubles in ~6 years — after that, you're playing with house money.
Negotiation context
- It's been on market 449 days — a 12% lower offer ($88k) is reasonable based on typical stale-listing flexibility.
- 14 sale attempts since 21y ago; this cycle's ask has dropped $20k (17%) from the opening price — seller is motivated, your offer sets the floor, not the list.
Risks & watch-outs
- Watch-outs: property tax is 3.0% of price.
- Climate carrying-cost: severe wind risk, 99% chance of damaging wind over 30y; moderate wildfire risk; extreme-heat days projected 7→24/yr by 2055 (HVAC capex compounding) — expect insurance premiums to compound above CPI over the hold.
Questions for the listing agent
- It's been on market 449 days. Have you received any prior offers? Is the seller open to a 12% concession, seller financing, or rate buy-down credit?
- Property tax is high relative to price — has the assessment been appealed recently, and will the sale trigger a re-assessment?
- What does the HOA fee cover, when was the last increase, and are there any pending special assessments or reserve-fund shortfalls?
- Why hasn't it sold? Are there any deal-killer items the seller is aware of (foundation, flood, title, zoning, code violations)?
- Is there a deadline driving the sale (1031 exchange, divorce, estate, relocation)? That informs how much negotiation room exists.
- Schools are F-rated, which usually means shorter tenancies and higher turnover. Who's the typical renter profile here, and what's been the actual vacancy rate?
- What's the average days-on-market for RENTAL listings here right now (not sales)? A rising rental-DOM trend means longer vacancies and softer asking-rent achievability than the comps imply.
- What's the recent tenant-quality profile in this submarket — average credit score on applications, eviction rate, late-payment / NSF rate, and stable-employment percentage? A property-management company in the area should have these aggregated.
- How much new for-sale + rental construction is in the pipeline within 1–3 miles? Heavy new supply typically softens prices + rents 12–24 months out; constrained supply supports both.
Investment metrics
- 1% rule
- 2.10% ✓
- Cap rate
- 12.98%
- Cash-on-cash
- 23.88%
- DSCR
- 2.06
- GRM
- 4.0
CMA / ARV
- ARV (on-the-fly)
- $167,670
- Comps found
- 12
Show comp detail 12 sales within ~0.75 mi
| Address | Dist | Beds/Ba | Sqft | Sold | Price | $/sf | Match |
|---|---|---|---|---|---|---|---|
| 3801 Meadowlark Cir | 0.23mi | 2/2.0 | 1,216 (+0%) | 4mo | $152,000 | $125 | 86 |
| 7921 Meadowlark Ln | 0.10mi | 2/2.0 | 1,301 (+7%) | 2mo | $115,000 | $88 | 81 |
| 3801 Westchester Ct | 0.49mi | 2/2.0 | 1,225 (+1%) | 7mo | $210,000 | $171 | 70 |
| 3422 Feriwinkle Ct | 0.52mi | 2/2.0 | 1,184 (-3%) | 4mo | $205,000 | $173 | 68 |
| 7953 Horned Lark Cir | 0.54mi | 2/2.0 | 1,286 (+6%) | 1mo | $130,000 | $101 | 64 |
| 3033 Satinleaf Ln | 0.60mi | 2/2.0 | 1,248 (+3%) | 4mo | $195,000 | $156 | 64 |
| 3005 Approach Shot Way | 0.43mi | 2/2.0 | 1,333 (+10%) | 3mo | $149,900 | $112 | 61 |
| 2816 Eagles Nest Way | 0.56mi | 2/2.0 | 1,134 (-7%) | 7mo | $146,000 | $129 | 56 |
| 2948 Fiddlewood Cir | 0.73mi | 2/2.0 | 1,280 (+5%) | 1mo | $122,000 | $95 | 56 |
| 3817 Sleepy Hollow Ln | 0.40mi | 2/2.0 | 1,390 (+14%) | 4mo | $260,000 | $187 | 54 |
| 3788 Satinwood Ct | 0.69mi | 2/2.0 | 1,090 (-10%) | 2mo | $150,000 | $138 | 49 |
| 8394 Delphinium Ct | 0.57mi | 3/2.0 (+1) | 1,392 (+15%) | 4mo | $220,000 | $158 | 41 |
Match score weights: distance 35% · size 25% · config 20% · recency 20%. Top-matched comps best support the ARV.
Projected returns pro-forma
-3.0% appreciation · 1.92% rent growth · sell at horizon
- IRR
- 15.6%
- Equity multiple
- 1.62×
- Total profit
- $17,296
- Equity at exit
- $14,895
- IRR
- 23.3%
- Equity multiple
- 2.89×
- Total profit
- $52,819
- Equity at exit
- $8,638
Cash invested: $27,972 (down + closing). Projections, not guarantees.
Landlord ↔ Tenant lean methodology
- Overall (STATE)
- 87 Strongly Landlord-Friendly
- State Florida
- 87 Strongly Landlord-Friendly · R+3
- County
- — inherits STATE
- City
- — inherits STATE
ZIP-level market 34952
- Home prices YoY
- -29.6%
- Rents YoY
- 1.9%
- Active inventory
- 645
- Price-to-rent
- 4.0×
Monthly cashflow live
- Estimated rent
- $2,095 high interval (Pro) →
- Mortgage (P&I)
- −$524
- Tax from tax record
- −$247 /mo · $2,970/yr
- Insurance
- −$42
- HOA
- −$285
- Vacancy / Maint / Mgmt
- −$440
- Net cashflow
- $557
Break-even live
Sensitivity live
| Price | -10% $613 | -5% $585 | +0% $557 | +5% $528 | +10% $500 |
|---|---|---|---|---|---|
| Rent | -10% $391 | -5% $474 | +0% $557 | +5% $639 | +10% $722 |
| Rate | -1.0pp $607 | -0.5pp $582 | base $557 | +0.5pp $531 | +1.0pp $504 |
UW: 25.0% down · 7.5% · 30yr · 1.5% tax · 5.0% vac · 8.0% maint · 8.0% mgmt
Financing live
Cash to close
- Down payment
- $24,975
- Closing costs
- $2,997
- Reserves months
- —
- Total cash needed
- —
Loan-product check · same deal, 3 products live
Conventional
25% down · 7.5% · 30yr
- Down + closing
- —
- Monthly P&I
- —
- Monthly cashflow
- —
- DSCR
- —
- Eligible?
- —
Personal DTI + credit; lowest rate.
DSCR
20% down · 8.5% · 30yr
- Down + closing
- —
- Monthly P&I
- —
- Monthly cashflow
- —
- DSCR
- —
- Eligible?
- —
No personal income docs; deal must DSCR.
Hard money
10% down · 12.0% · 12mo
- Down + closing
- —
- Monthly P&I
- —
- Monthly cashflow
- —
- DSCR
- —
- Eligible?
- —
Short-term bridge; refi at stabilization.
Rent comps 8 comps
| Address | Beds | Baths | Sqft | Rent | $/sqft | DOM | Units | Dist |
|---|---|---|---|---|---|---|---|---|
| 3784 Sapodilla Ct Port Saint Lucie, FL | 2.0 | 2.0 | 1121 | $2,300 | $2.05 | 25d | 1 | 0.64mi |
| 71 W Caribbean Port St. Lucie, FL | 2.0 | 2.0 | 1417 | $1,700 | $1.20 | 25d | 1 | 1.22mi |
| 1900 Bella Vista Way Port Saint Lucie, FL | 1.0–2.0 | 1.0–2.0 | 995 | $1,764 | $1.77 | 15d | 15 | 1.23mi |
| 1131 SE Parrish Ct Port Saint Lucie, FL | 2.0 | 1.0 | 902 | $2,000 | $2.22 | 25d | 1 | 1.23mi |
| 2209 SE East Dunbrooke Cir Port Saint Lucie, FL | 3.0 | 2.0 | 1212 | $2,950 | $2.43 | 15d | 1 | 1.27mi |
| 2130 SE Wild Meadow Cir Port Saint Lucie, FL | 2.0 | 2.0 | 1440 | $1,695 | $1.18 | 15d | 1 | 1.40mi |
| 2058 SE Wild Meadow Cir #101 Port St Lucie, FL | 2.0 | 2.5 | 1425 | $2,200 | $1.54 | 15d | 1 | 1.41mi |
| 1811 SE Walton Lakes Dr Port Saint Lucie, FL | 2.0 | 1.0–2.0 | 1117 | $1,926 | $1.72 | 15d | 6 | 1.46mi |
HOA detail
- Monthly dues
- $285 · $3,420/yr
- Likely covers
- poolgym
Listing history 50 events
-
2026-06-21days on market $99,900 Active 449 DOM
-
2026-06-18days on market $99,900 Active 446 DOM
-
2026-06-17days on market $99,900 Active 445 DOM
-
2026-06-16days on market $99,900 Active 444 DOM
-
2026-06-15days on market $99,900 Active 443 DOM
-
2026-06-14days on market $99,900 Active 441 DOM
-
2026-06-13days on market $99,900 Active 440 DOM
-
2026-06-10days on market $99,900 Active 438 DOM
-
2026-06-09days on market $99,900 Active 437 DOM
-
2026-06-08days on market $99,900 Active 436 DOM
-
2026-06-07days on market $99,900 Active 435 DOM
-
2026-06-05days on market $99,900 Active 432 DOM
-
2026-06-03days on market $99,900 Active 431 DOM
-
2026-06-02days on market $99,900 Active 430 DOM
-
2026-06-01days on market $99,900 Active 429 DOM
-
2026-05-31days on market $99,900 Active 428 DOM
-
2026-05-30days on market $99,900 Active 427 DOM
-
2026-04-08price $99,900
-
2026-04-06price $110,000
-
2026-03-01status Active
-
2026-02-28historical
-
2025-03-28$120,000 Active
-
2025-02-26historical
-
2025-01-23price $129,000
-
2024-11-15$139,000 Active
-
2024-11-12historical
-
2024-10-26price $139,900
-
2024-08-28$145,000 Active
-
2024-08-02historical
-
2024-04-12price $159,900
-
2024-03-23price $164,990
-
2024-02-01$175,000 Active
-
2017-06-19soldstatus $92,000
-
2017-06-08soldstatus $69,000 Closed
-
2017-05-30status Pending
-
2017-05-18$69,999 Active
-
2017-04-02historical
-
2017-02-11price $54,000
-
2016-12-22$59,999 Active
-
2015-02-05historical
-
2015-02-05historical
-
2015-02-05historical
-
2012-12-10$49,900
-
2011-03-30$54,500
-
2007-05-07$69,900
-
2007-04-18historical
-
2006-08-31soldstatus $62,000
-
2006-08-31$94,900
-
2006-07-07historical
-
2006-03-06historical
ⓘ Source: listings_history table (triggers on properties + properties_extension) + one-shot
backfill from property_details.listing_events for pre-trigger history.
Tax reassessment forecast FL · Resets to sale price
- Current annual tax
- $2,970 · $247/mo
- Projected year-2 tax
- $2,970 · $247/mo
- Expected delta
- $0/yr ($0/mo · 0.0%)
ⓘ Screening estimate from a state-policy table — verify with the county assessor before closing.
Climate risk First Street
- Flood 1/10 Low FEMA zone X (unshaded) · 0% chance over 30 yrs
- Wildfire 5/10 Major
- Heat 10/10 Extreme 7 d/yr ≥106°F today · 24 d/yr by 30 yrs out
- Wind 10/10 Extreme 99% chance of damaging wind over 30 yrs
- Air quality 2/10 Low 1 unhealthy d/yr today · 1 by 30 yrs out
Nearby sold comps map
Loading sold comps map…
Walkable amenities ~0.75 mi
Loading nearby amenities…
Taxation est. · year 1
- Rental income
- $25,134
- − Mortgage interest
- −$5,596
- − Property taxes
- −$2,970
- − Insurance
- −$500
- − Repairs & maintenance
- −$2,011
- − Management
- −$2,011
- − HOA
- −$3,420
- − Depreciation
- −$2,906
- Taxable income
- $5,721
- Est. tax owed @ 24.0%
- −$1,373
- After-tax cash flow
- $5,307/yr
For passive investors: Depreciation is non-cash, so a rental often shows a tax loss while cash-flowing — sheltering income. Rental losses are passive: they offset passive income freely, and up to $25,000/yr can offset ordinary (W-2) income if you actively participate and your MAGI is under $100k (phasing out to $0 by $150k); unused losses carry forward. On sale, claimed depreciation is recaptured at up to 25%, and gains may owe capital-gains tax (a 1031 exchange can defer both). Figures are a year-1 estimate at your 24.0% rate — not tax advice; consult a CPA.
Schools (NCES district)
- District
- St. Lucie
- NCES district ID
- 1201770
- Math proficiency
- 40% ▼ -11.00%
- Reading proficiency
- 48% ▼ -4.00%
- Median HH income
- $44,737
- Composite
- 37.28/100
- National rank
- #4449
- State rank
- #51 of 73 in FL
Livability — Indian River Estates
- Score
- 65/100
- State rank
- #653
- US rank
- #12946
Category grades
Schools grade is shown separately in the Schools card above.
Census & demographics
- County
- Saint Lucie County · 337,150 people
- City population
- 27,447
- Metro
- Port St. Lucie, FL
- Population (ZIP)
- 42,655
- Household income
- $61,628
- Rent vs Own
- Severe rent burden
- 1759.0
Population outlook (St. Lucie County) Hauer SSP2
- Today (2025)
- 338,016 people
- By 2030
- 355,687 · +5.2%
- By 2040
- 385,521 · +14.1%
- By 2050
- 406,106 · +20.1%
- By 2075
- 441,054 · +30.5%
- By 2100
- 436,885 · +29.2%
Race, ethnicity, and origin ACS 2023
- Neighborhood character
- Diverse neighborhood (Simpson 0.57)
- Race & ethnicity
- White 62% Hispanic / Latino 19% Two or more races 14% Black 10% Asian 3%
- Hispanic origin (detail)
- Mexican 4% Puerto Rican 4% Cuban 2% Dominican 2%
- Common ancestry
- Romanian 3% Lithuanian 2% Hispanic 1%
- Foreign-born
- 18% · Canada, Jamaica, China
- Languages at home
- 76% English-only · Spanish 16% French/Haitian/Cajun 3% Tagalog/Filipino 2%
Political lean MEDSL · St. Lucie
- 2024 margin
- Lean R (+9.1) · D 45.1% · R 54.2%
- 2008→2024 swing
- -21.2pp toward R · 2008: 12.1pp · 2024: -9.1pp
- All cycles
- 2024: R+9.1 2020: R+1.6 2016: R+2.5 2012: D+7.9 2008: D+12.1
Not yet ingested
- Civics
- —
Market trends
- HPI YoY
- ▼ -155.80%
- Current HPI
- 371.0573
- Rent YoY
- ▲ 1.92%
- Metro
- Port St. Lucie, FL
- State GDP YoY
- ▲ 3.28%
- F500 in state
- 36
Industry mix (Fortune 500 HQ in FL)
| Industry | F500 HQs | Revenue |
|---|---|---|
| Industrial Technology | 2 | $29B |
|
||
| Insurance | 2 | $17B |
|
||
| Retail | 1 | $60B |
|
||
| Technology Distribution | 1 | $58B |
|
||
| Homebuilding | 1 | $35B |
|
||
| Technology Manufacturing | 1 | $35B |
|
||
Price history
-98.8% since first listed38 events — show timeline
- 2026-04-08 Price Changed $99,900 MCRTC
- 2026-04-06 Price Changed $110,000 MCRTC
- 2026-03-01 Relisted — MCRTC
- 2026-02-28 Listing Removed — MCRTC
- 2025-03-28 Listed $120,000 MCRTC
- 2025-02-26 Listing Removed — Beaches MLS
- 2025-01-23 Price Changed $129,000 Beaches MLS
- 2024-11-15 Listed $139,000 Beaches MLS
- 2024-11-12 Listing Removed — Beaches MLS
- 2024-10-26 Price Changed $139,900 Beaches MLS
- 2024-08-28 Listed $145,000 Beaches MLS
- 2024-08-02 Listing Removed — Beaches MLS
- 2024-04-12 Price Changed $159,900 Beaches MLS
- 2024-03-23 Price Changed $164,990 Beaches MLS
- 2024-02-01 Listed $175,000 Beaches MLS
- 2017-06-19 Sold (Public Records) $92,000 Public Records
- 2017-06-08 Sold (MLS) $69,000 Beaches MLS
- 2017-05-30 Pending — Beaches MLS
- 2017-05-18 Listed $69,999 Beaches MLS
- 2017-04-02 Listing Removed — Beaches MLS
- 2017-02-11 Price Changed $54,000 Beaches MLS
- 2016-12-22 Listed $59,999 Beaches MLS
- 2015-02-05 Listing Removed — Beaches MLS
- 2015-02-05 Listing Removed — Beaches MLS
- 2015-02-05 Listing Removed — Beaches MLS
- 2012-12-10 Listed $49,900 Beaches MLS
- 2011-03-30 Listed $54,500 Beaches MLS
- 2007-05-07 Listed $69,900 Beaches MLS
- 2007-04-18 Listing Removed — Beaches MLS
- 2006-08-31 Listed $94,900 Beaches MLS
- 2006-08-31 Sold (MLS) $62,000 Beaches MLS
- 2006-07-07 Listing Removed — Beaches MLS
- 2006-03-06 Listing Removed — Beaches MLS
- 2006-01-17 Listed $99,000 Beaches MLS
- 2005-12-22 Listed $124,900 Beaches MLS
- 2005-12-19 Listing Removed — Beaches MLS
- 2005-09-27 Listed $124,900 Beaches MLS
- 2003-12-08 Sold (Public Records) $8,500,000 Public Records
Property tax history
+9.6%/yrLatest (2025): $2,970 · +0.5% YoY. Source: county tax records.
Cash-flow waterfall
monthlySold comps — $/sqft
last 12 mo · ≤1 miLoading sold comps…