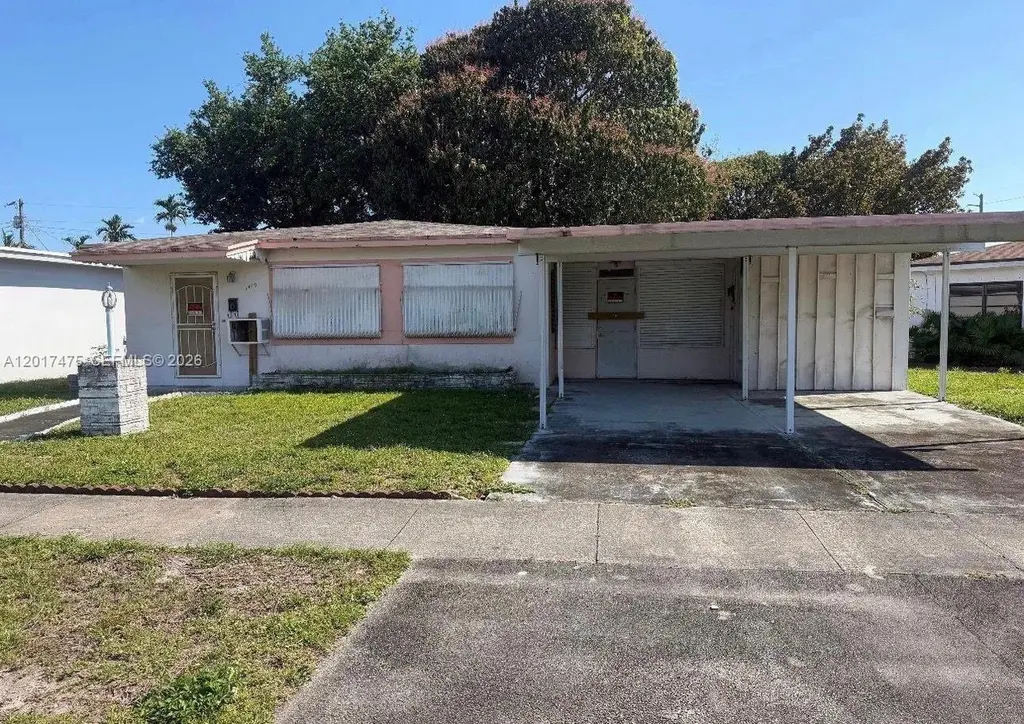
1410 NE 161st St · North Miami Beach, FL
Flood risk 4/10 · Minor
- FEMA flood zone
- X (unshaded)
- Chance of flooding over 30 yrs
- 0.24%
- Est. flood insurance / yr
- $507 – $1,088
Fire risk 1/10 · Minimal
- Est. fire insurance / yr
- $947 – $1,759
Heat risk 10/10 · Severe
- Hot days now (above 104°F)
- 7 days/yr
- Hot days in 30 yrs
- 27 days/yr
Wind risk 10/10 · Severe
- Chance of severe wind over 30 yrs
- 99.0%
Air-quality risk 2/10 · Minimal
- Unhealthy air days now
- 1 days/yr
- Unhealthy air days in 30 yrs
- 2 days/yr
Risk factors via First Street. Map © Google.
Why this score? — see what drove the C- grade
The composite is a weighted blend of 9 inputs, each scored 0–100. Each bar is that input's sub-score; the figure is the points it added to the 100-point composite (weight × sub-score).
- Cash flow +19.5/30.0
- ARV discount +7.7/15.0
- DSCR +6.2/10.0
- 1% rule +5.1/10.0
- Schools +4.2/10.0
- Livability +4.1/5.0
- Condition / age +2.5/5.0
- Rent growth +2.1/5.0
- Appreciation +0.0/10.0
$415,000
🖨 Deal sheet 📄 Offer letter ✓ Due diligence
Listing remarks
Great 3/2 with garage on a large 8,165 sf lot. Spacious layout with strong upside potential for a rental or fix and flip project. Handyman special with plenty of value add opportunity. Property will need a roof. Investors special. Cash only.
Key facts
- 8,165 sq ft lot
- Parking
- Built 1959
Property features AI
Exterior
- Parking: Covered carport (1 space)
- Utilities: Public water; Septic tank sewer
- Home design: 1-story single-family residence; Faces north; Fixer condition
- Construction: Block construction; Shingle roof; Resale property
- Exterior features: Fenced yard; Less than quarter-acre lot
Interior
- Bedrooms: Includes a bedroom on the main level
- Flooring: Tile flooring
- Bathrooms: 2 full bathrooms
- Interior features: First-floor entry; Bedroom on main level
Neighborhood map
What this means for you Summary
Snapshot
- This is a 3-bed/2.0-bath single-family listed at $415k.
Deal economics
- At list price, monthly cash flow is $470 ($6k/yr) — positive.
- The deal already cash-flows at list — no discount required.
- Meets the 1% rule at list price ($4k rent vs $415k).
- Cap rate 7.7% vs local median 5.2% in North Miami Beach — top-decile yield for the area; either an underpriced asset or a hidden risk that comps aren't pricing in. Stress-test before assuming the spread holds.
Location & tenants
- Location reads 82/100 on livability (#71 in FL, #1,177 nationally) — a professional / high-income tenant draw. Strengths: commute A+, housing A+, health & safety A+; Watch: employment D+, crime F.
- Miami-Dade (suburban): math 45% / reading 54% proficiency, ranked #40 of 73 in FL (top 55%) — families likely to look elsewhere, expect single-tenant / working-renter base with shorter leases; 64% free/reduced lunch — lower-income household profile, screen leases tightly.
- Market conditions: Rents soft (-1.6%/yr); 284 active listings in the ZIP; 10,051 units permitted in Miami-Dade County in 2024 (7,758 in 5+ unit buildings).
- At $4,179/mo this rent would consume 83% of the median local household income ($61k/yr) (locally 2509% of renters already pay >50% of income on rent) — very limited rent-growth headroom before tenants either downsize or default.
Forward outlook
- Local home prices are declining (-3.0%/yr); year-one equity from $3k of loan paydown is wiped out by about $12k of value loss. Plan a longer hold.
- Miami-Dade County population projected at +28% by 2050 — long-run rental-demand tailwind backs the buy-and-hold thesis.
Negotiation context
- Only 5 days on market — expect competitive offers; lowballing is unlikely to land.
- 2 sale attempts since 9y ago with the ask held roughly flat each time — persistent listings suggest the price (not the market) is what's stuck; bring a comps-based counter.
Risks & watch-outs
- Watch-outs: built in 1959 — expect roof / HVAC / electrical / plumbing capex.
- Climate carrying-cost: severe wind risk, 99% chance of damaging wind over 30y; extreme-heat days projected 7→27/yr by 2055 (HVAC capex compounding) — expect insurance premiums to compound above CPI over the hold.
Questions for the listing agent
- Built in 1959 — when were the roof, HVAC, electrical panel, plumbing, and water heater last replaced?
- Is there a deadline driving the sale (1031 exchange, divorce, estate, relocation)? That informs how much negotiation room exists.
- Crime grade is F in this area — have there been break-ins, vandalism, or insurance claims at this property in the last 3 years? What carrier currently insures it and at what premium?
- What's the average days-on-market for RENTAL listings here right now (not sales)? A rising rental-DOM trend means longer vacancies and softer asking-rent achievability than the comps imply.
- What's the recent tenant-quality profile in this submarket — average credit score on applications, eviction rate, late-payment / NSF rate, and stable-employment percentage? A property-management company in the area should have these aggregated.
- How much new for-sale + rental construction is in the pipeline within 1–3 miles? Heavy new supply typically softens prices + rents 12–24 months out; constrained supply supports both.
Investment metrics
- 1% rule
- 1.01% ✓
- Cap rate
- 7.65%
- Cash-on-cash
- 4.86%
- DSCR
- 1.22
- GRM
- 8.3
CMA / ARV
- ARV (on-the-fly)
- $416,740
- Comps found
- 3
Show comp detail 3 sales within ~0.75 mi
| Address | Dist | Beds/Ba | Sqft | Sold | Price | $/sf | Match |
|---|---|---|---|---|---|---|---|
| 1410 NE 161st St | 0.00mi | 3/2.0 | 1,340 (0%) | 1mo | $417,000 | $311 | 99 |
| 1620 NE 160th St | 0.25mi | 2/2.0 (-1) | 1,450 (+8%) | 24mo | $425,000 | $293 | 50 |
| 1071 NE 160th Ter | 0.45mi | 2/1.0 (-1) | 1,184 (-12%) | 5mo | $370,000 | $313 | 47 |
Match score weights: distance 35% · size 25% · config 20% · recency 20%. Top-matched comps best support the ARV.
Projected returns pro-forma
-3.0% appreciation · 0.0% rent growth · sell at horizon
- IRR
- -12.1%
- Equity multiple
- 0.57×
- Total profit
- $-49,503
- Equity at exit
- $61,878
- IRR
- -8.2%
- Equity multiple
- 0.56×
- Total profit
- $-51,706
- Equity at exit
- $35,882
Cash invested: $116,200 (down + closing). Projections, not guarantees.
Landlord ↔ Tenant lean methodology
- Overall (STATE)
- 87 Strongly Landlord-Friendly
- State Florida
- 87 Strongly Landlord-Friendly · R+3
- County
- — inherits STATE
- City
- — inherits STATE
ZIP-level market 33162
- Rents YoY
- -1.6%
- Active inventory
- 284
- Price-to-rent
- 8.3×
Monthly cashflow live
- Estimated rent
- $4,179 medium interval (Pro) →
- Mortgage (P&I)
- −$2,176
- Tax from tax record
- −$482 /mo · $5,784/yr
- Insurance
- −$173
- HOA
- −$0
- Vacancy / Maint / Mgmt
- −$878
- Net cashflow
- $470
Break-even live
UW: 25.0% down · 7.5% · 30yr · 1.5% tax · 5.0% vac · 8.0% maint · 8.0% mgmt
Financing live
Cash to close
- Down payment
- $103,750
- Closing costs
- $12,450
- Reserves months
- —
- Total cash needed
- —
Loan-product check · same deal, 3 products live
Conventional
25% down · 7.5% · 30yr
- Down + closing
- —
- Monthly P&I
- —
- Monthly cashflow
- —
- DSCR
- —
- Eligible?
- —
Personal DTI + credit; lowest rate.
DSCR
20% down · 8.5% · 30yr
- Down + closing
- —
- Monthly P&I
- —
- Monthly cashflow
- —
- DSCR
- —
- Eligible?
- —
No personal income docs; deal must DSCR.
Hard money
10% down · 12.0% · 12mo
- Down + closing
- —
- Monthly P&I
- —
- Monthly cashflow
- —
- DSCR
- —
- Eligible?
- —
Short-term bridge; refi at stabilization.
Listing history 6 events
-
2026-05-17status Pending
-
2026-05-12$415,000 Active
-
2026-03-30soldstatus $382,500
-
2017-11-20historical
-
2017-08-15$300,000 Active
-
1989-02-03soldstatus $58,000
ⓘ Source: listings_history table (triggers on properties + properties_extension) + one-shot
backfill from property_details.listing_events for pre-trigger history.
Tax reassessment forecast FL · Resets to sale price
- Current annual tax
- $5,784 · $482/mo
- Projected year-2 tax
- $5,784 · $482/mo
- Expected delta
- $0/yr ($0/mo · 0.0%)
ⓘ Screening estimate from a state-policy table — verify with the county assessor before closing.
Climate risk First Street
- Flood 4/10 Moderate FEMA zone X (unshaded) · 24% chance over 30 yrs
- Wildfire 1/10 Low
- Heat 10/10 Extreme 7 d/yr ≥104°F today · 27 d/yr by 30 yrs out
- Wind 10/10 Extreme 99% chance of damaging wind over 30 yrs
- Air quality 2/10 Low 1 unhealthy d/yr today · 2 by 30 yrs out
Nearby sold comps map
Loading sold comps map…
Walkable amenities ~0.75 mi
Loading nearby amenities…
Taxation est. · year 1
- Rental income
- $50,149
- − Mortgage interest
- −$23,246
- − Property taxes
- −$5,784
- − Insurance
- −$2,075
- − Repairs & maintenance
- −$4,012
- − Management
- −$4,012
- − Depreciation
- −$12,073
- Taxable loss
- −$1,053
- Est. tax savings @ 24.0%
- +$253
- After-tax cash flow
- $5,896/yr
For passive investors: Depreciation is non-cash, so a rental often shows a tax loss while cash-flowing — sheltering income. Rental losses are passive: they offset passive income freely, and up to $25,000/yr can offset ordinary (W-2) income if you actively participate and your MAGI is under $100k (phasing out to $0 by $150k); unused losses carry forward. On sale, claimed depreciation is recaptured at up to 25%, and gains may owe capital-gains tax (a 1031 exchange can defer both). Figures are a year-1 estimate at your 24.0% rate — not tax advice; consult a CPA.
Schools (NCES district)
- District
- Miami-Dade
- NCES district ID
- 1200390
- Math proficiency
- 45% ▼ -16.00%
- Reading proficiency
- 54% ▼ -5.00%
- Median HH income
- $43,928
- Composite
- 41.76/100
- National rank
- #3397
- State rank
- #40 of 73 in FL
Livability — North Miami Beach
- Score
- 82/100
- State rank
- #71
- US rank
- #1177
Category grades
Schools grade is shown separately in the Schools card above.
Census & demographics
- Census place
- North Miami Beach, FL
- County
- Miami-Dade County · 2,697,751 people
- City population
- 90,324
- Metro
- Miami-Fort Lauderdale-Pompano Beach, FL
- Population (ZIP)
- 46,606
- Household income
- $60,692
- Rent vs Own
- Severe rent burden
- 2509.0
Population outlook (Miami-Dade County) Hauer SSP2
- Today (2025)
- 3,126,439 people
- By 2030
- 3,325,765 · +6.4%
- By 2040
- 3,697,561 · +18.3%
- By 2050
- 4,012,134 · +28.3%
- By 2075
- 4,605,612 · +47.3%
- By 2100
- 4,866,598 · +55.7%
Race, ethnicity, and origin ACS 2023
- Neighborhood character
- Diverse neighborhood (Simpson 0.62)
- Race & ethnicity
- Black 53% Hispanic / Latino 30% Two or more races 15% White 12% Asian 2%
- Hispanic origin (detail)
- Puerto Rican 4% Cuban 7% Dominican 3%
- Common ancestry
- Hispanic 31% Romanian 1% Scotch-Irish 1%
- Foreign-born
- 52% · Canada, Jamaica, Dominican Republic
- Languages at home
- 29% English-only · French/Haitian/Cajun 35% Spanish 30% Other Indo-European 2%
Political lean MEDSL · Miami-Dade
- 2024 margin
- R (+11.4) · D 43.9% · R 55.4%
- 2008→2024 swing
- -27.6pp toward R · 2008: 16.1pp · 2024: -11.4pp
- All cycles
- 2024: R+11.4 2020: D+7.3 2016: D+29.6 2012: D+23.7 2008: D+16.1
Not yet ingested
- Civics
- —
Market trends
- HPI YoY
- ▼ -445.57%
- Current HPI
- 596.6178
- Rent YoY
- ▼ -1.59%
- Metro
- Miami-Fort Lauderdale-Pompano Beach, FL
- State GDP YoY
- ▲ 3.28%
- F500 in state
- 36
Industry mix (Fortune 500 HQ in FL)
| Industry | F500 HQs | Revenue |
|---|---|---|
| Industrial Technology | 2 | $29B |
|
||
| Insurance | 2 | $17B |
|
||
| Retail | 1 | $60B |
|
||
| Technology Distribution | 1 | $58B |
|
||
| Homebuilding | 1 | $35B |
|
||
| Technology Manufacturing | 1 | $35B |
|
||
Price history
+615.5% since first listed6 events — show timeline
- 2026-05-17 Pending — MARMLS
- 2026-05-12 Listed $415,000 MARMLS
- 2026-03-30 Sold (Public Records) $382,500 Public Records
- 2017-11-20 Listing Removed — MARMLS
- 2017-08-15 Listed $300,000 MARMLS
- 1989-02-03 Sold (Public Records) $58,000 Public Records
Property tax history
+7.6%/yrLatest (2025): $5,784 · +11.7% YoY. Source: county tax records.
Cash-flow waterfall
monthlySold comps — $/sqft
last 12 mo · ≤1 miLoading sold comps…