4516 Reily Ln · Collinston, LA
Flood risk 1/10 · Minimal
- FEMA flood zone
- X
- Chance of flooding over 30 yrs
- 0.0%
- Est. flood insurance / yr
- $507 – $1,088
Fire risk 3/10 · Minor
- Est. fire insurance / yr
- $1,269 – $2,357
Heat risk 7/10 · Major
- Hot days now (above 111°F)
- 7 days/yr
- Hot days in 30 yrs
- 20 days/yr
Wind risk 6/10 · Moderate
- Chance of severe wind over 30 yrs
- 74.0%
Air-quality risk 1/10 · Minimal
- Unhealthy air days now
- 0 days/yr
- Unhealthy air days in 30 yrs
- 0 days/yr
Risk factors via First Street. Map © Google.
Why this score? — see what drove the B grade
The composite is a weighted blend of 9 inputs, each scored 0–100. Each bar is that input's sub-score; the figure is the points it added to the 100-point composite (weight × sub-score).
- Cash flow +30.0/30.0
- DSCR +10.0/10.0
- 1% rule +8.2/10.0
- ARV discount +7.5/15.0
- Appreciation +6.3/10.0
- Rent growth +2.5/5.0
- Condition / age +2.5/5.0
- Livability +2.3/5.0
- Schools +1.1/10.0
$85,000
🖨 Deal sheet (PDF) 📄 Offer letter ✓ Due diligence
Listing remarks
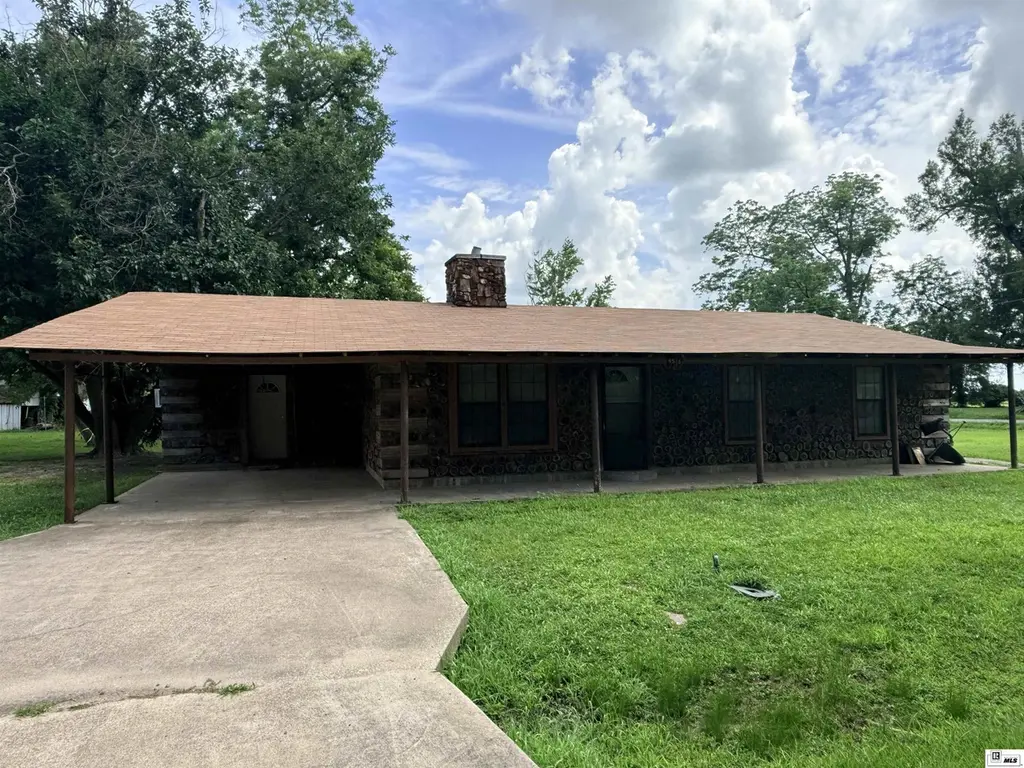
Check out this affording listing in downtown Collinston. This house is located behind the Methodist Church on a quiet corner lot.
Key facts
- Quiet corner lot
- 0.67 acre lot
- Garage
Tags
Property features AI
Finance
- Other: Located behind the Methodist Church in Collinston (Directions provided); Subdivision: Collinston
- HOA & community: No association amenities
Exterior
- Parking: 1-car garage; Carport
- Utilities: Public water; Public sewer; Natural gas available and connected
- Home design: Single-family residence (site build); One story; Entry level: 1; Log construction
- Construction: Log construction; Fiberglass roof; Slab foundation; Built as a site-built home
- Exterior features: Covered patio/porch; Corner lot
Interior
- Kitchen: Dishwasher; Range hood; Electric range
- Bedrooms: 3 bedrooms on the main level
- Bathrooms: 1 full bathroom on the main level
- Heating & cooling: Space heater; Ceiling fan(s) for cooling; Wall/window cooling units
- Interior features: Ceiling fans; Double-pane windows; Living room fireplace (1)
- Laundry & utility: Electric water heater
Neighborhood map
What this means for you Summary
Snapshot
- This is a 3-bed/1.0-bath single-family listed at $85k.
Deal economics
- At list price, monthly cash flow is $346 ($4k/yr) — positive.
- The deal already cash-flows at list — no discount required.
- Meets the 1% rule at list price ($1k rent vs $85k).
Location & tenants
- Location reads 46/100 on livability (#451 in LA) — a working-class tenant base; expect higher turnover. Strengths: cost of living A+; Watch: health & safety D, crime F, amenities F.
- Morehouse Parish (town): math 10% / reading 19% proficiency, ranked #83 of 98 in LA (top 85%) — low school quality limits family demand, transient renter base, plan for 1-2y turnover; 78% free/reduced lunch — lower-income household profile, screen leases tightly.
- Zoned schools: Morehouse Elementary School (math 3% / reading 9%, grade F, #630 of 646 statewide, top 98%, 587 students, 6% FRL); Bastrop High School (math 3% / reading 7%, grade F, #260 of 265 statewide, top 100%, 902 students, 6% FRL) — zoned schools average 6% FRL vs 78% district-wide (72 pts lower); this property's tenant base skews higher-income than the district average.
- Market conditions: 8 active listings in the ZIP; 11 units permitted in Morehouse Parish in 2024 (0 in 5+ unit buildings).
Forward outlook
- In year one you build about $3k of equity ($588 loan paydown + $2k appreciation (2.6% local appreciation)).
- Morehouse County population projected at -29% by 2050 — secular population decline; favor cash flow + early exit over multi-decade hold.
- At projected returns (2.6% appreciation + 3.0% rent growth), your $24k cash investment doubles in ~4 years — after that, you're playing with house money.
Negotiation context
- Only 9 days on market — expect competitive offers; lowballing is unlikely to land.
Risks & watch-outs
- Climate carrying-cost: major wind risk, 74% chance of damaging wind over 30y; extreme-heat days projected 7→20/yr by 2055 (HVAC capex compounding) — expect insurance premiums to compound above CPI over the hold.
Questions for the listing agent
- Is there a deadline driving the sale (1031 exchange, divorce, estate, relocation)? That informs how much negotiation room exists.
- Schools are F-rated, which usually means shorter tenancies and higher turnover. Who's the typical renter profile here, and what's been the actual vacancy rate?
- Crime grade is F in this area — have there been break-ins, vandalism, or insurance claims at this property in the last 3 years? What carrier currently insures it and at what premium?
- What's the average days-on-market for RENTAL listings here right now (not sales)? A rising rental-DOM trend means longer vacancies and softer asking-rent achievability than the comps imply.
- What's the recent tenant-quality profile in this submarket — average credit score on applications, eviction rate, late-payment / NSF rate, and stable-employment percentage? A property-management company in the area should have these aggregated.
- How much new for-sale + rental construction is in the pipeline within 1–3 miles? Heavy new supply typically softens prices + rents 12–24 months out; constrained supply supports both.
Investment metrics
- 1% rule
- 1.32% ✓
- Cap rate
- 11.18%
- Cash-on-cash
- 17.44%
- DSCR
- 1.78
- GRM
- 6.3
CMA / ARV
No comps found within radius.
Projected returns pro-forma
2.58% appreciation · 3.0% rent growth · sell at horizon
- IRR
- 23.0%
- Equity multiple
- 2.28×
- Total profit
- $30,365
- Equity at exit
- $36,208
- IRR
- 24.3%
- Equity multiple
- 4.35×
- Total profit
- $79,615
- Equity at exit
- $54,284
Cash invested: $23,800 (down + closing). Projections, not guarantees.
Landlord ↔ Tenant lean methodology
- Overall (STATE)
- 90 Strongly Landlord-Friendly
- State Louisiana
- 90 Strongly Landlord-Friendly · R+12
- County
- — inherits STATE
- City
- — inherits STATE
ZIP-level market 71229
- Home prices YoY
- 2.3%
- Active inventory
- 8
- Price-to-rent
- 6.3×
Monthly cashflow live
- Estimated rent
- $1,124 medium interval (Pro) →
- Mortgage (P&I)
- −$446
- Tax from tax record
- −$61 /mo · $728/yr
- Insurance
- −$35
- HOA
- −$0
- Lot rent
- −$0
- Vacancy / Maint / Mgmt
- −$236
- Net cashflow
- $346
Break-even live
Sensitivity live
| Price | -10% $394 | -5% $370 | +0% $346 | +5% $322 | +10% $298 |
|---|---|---|---|---|---|
| Rent | -10% $257 | -5% $301 | +0% $346 | +5% $390 | +10% $435 |
| Rate | -1.0pp $389 | -0.5pp $367 | base $346 | +0.5pp $324 | +1.0pp $301 |
UW: 25.0% down · 7.5% · 30yr · 1.5% tax · 5.0% vac · 8.0% maint · 8.0% mgmt
Financing live
Cash to close
- Down payment
- $21,250
- Closing costs
- $2,550
- Reserves months
- —
- Total cash needed
- —
Loan-product check · same deal, 3 products live
Conventional
25% down · 7.5% · 30yr
- Down + closing
- —
- Monthly P&I
- —
- Monthly cashflow
- —
- DSCR
- —
- Eligible?
- —
Personal DTI + credit; lowest rate.
DSCR
20% down · 8.5% · 30yr
- Down + closing
- —
- Monthly P&I
- —
- Monthly cashflow
- —
- DSCR
- —
- Eligible?
- —
No personal income docs; deal must DSCR.
Hard money
10% down · 12.0% · 12mo
- Down + closing
- —
- Monthly P&I
- —
- Monthly cashflow
- —
- DSCR
- —
- Eligible?
- —
Short-term bridge; refi at stabilization.
Listing history 8 events
-
2026-06-21days on market $85,000 Active 9 DOM
-
2026-06-19days on market $85,000 Active 7 DOM
-
2026-06-18days on market $85,000 Active 6 DOM
-
2026-06-17days on market $85,000 Active 5 DOM
-
2026-06-16days on market $85,000 Active 4 DOM
-
2026-06-15days on market $85,000 Active 3 DOM
-
2026-06-13remarks 129-char remark
-
2026-06-13$85,000 Active 1 DOM
ⓘ Source: listings_history table (triggers on properties + properties_extension) + one-shot
backfill from property_details.listing_events for pre-trigger history.
Tax reassessment forecast LA · Resets to sale price
- Current annual tax
- $728 · $61/mo
- Projected year-2 tax
- $728 · $61/mo
- Expected delta
- $0/yr ($0/mo · 0.0%)
ⓘ Screening estimate from a state-policy table — verify with the county assessor before closing.
Climate risk First Street
- Flood 1/10 Low FEMA zone X · 0% chance over 30 yrs
- Wildfire 3/10 Moderate
- Heat 7/10 Severe 7 d/yr ≥111°F today · 20 d/yr by 30 yrs out
- Wind 6/10 Major 74% chance of damaging wind over 30 yrs
- Air quality 1/10 Low 0 unhealthy d/yr today · 0 by 30 yrs out
Nearby sold comps map
Loading sold comps map…
Walkable amenities ~0.75 mi
Loading nearby amenities…
Taxation est. · year 1
- Rental income
- $13,484
- − Mortgage interest
- −$4,761
- − Property taxes
- −$728
- − Insurance
- −$425
- − Repairs & maintenance
- −$1,079
- − Management
- −$1,079
- − Depreciation
- −$2,473
- Taxable income
- $2,939
- Est. tax owed @ 24.0%
- −$705
- After-tax cash flow
- $3,445/yr
For passive investors: Depreciation is non-cash, so a rental often shows a tax loss while cash-flowing — sheltering income. Rental losses are passive: they offset passive income freely, and up to $25,000/yr can offset ordinary (W-2) income if you actively participate and your MAGI is under $100k (phasing out to $0 by $150k); unused losses carry forward. On sale, claimed depreciation is recaptured at up to 25%, and gains may owe capital-gains tax (a 1031 exchange can defer both). Figures are a year-1 estimate at your 24.0% rate — not tax advice; consult a CPA.
Schools (NCES district)
- District
- Morehouse Parish
- NCES district ID
- 2201110
- Math proficiency
- 10% ▼ -29.00%
- Reading proficiency
- 19% ▼ -29.00%
- Median HH income
- $30,482
- Composite
- 11.46/100
- National rank
- #9704
- State rank
- #83 of 98 in LA
Livability — Collinston
- Score
- 46/100
- State rank
- #451
- US rank
- #26513
Category grades
Schools grade is shown separately in the Schools card above.
Census & demographics
- Census place
- Collinston, LA
- Population (ZIP)
- 1,462
Population outlook (Morehouse County) Hauer SSP2
- Today (2025)
- 23,631 people
- By 2030
- 22,114 · -6.4%
- By 2040
- 19,203 · -18.7%
- By 2050
- 16,698 · -29.3%
- By 2075
- 11,998 · -49.2%
- By 2100
- 8,622 · -63.5%
Race, ethnicity, and origin ACS 2023
- Neighborhood character
- Predominantly White (67%)
- Race & ethnicity
- White 67% Black 27% Two or more races 5% Hispanic / Latino 2%
- Common ancestry
- Lithuanian 10% Slovak 4%
- Foreign-born
- 2%
- Languages at home
- 98% English-only · Spanish 1%
Political lean MEDSL · Morehouse
- 2024 margin
- R (+19.4) · D 39.7% · R 59.0% · Other 1.3%
- 2008→2024 swing
- -8.3pp toward R · 2008: -11.1pp · 2024: -19.4pp
- All cycles
- 2024: R+19.4 2020: R+13.5 2016: R+11.4 2012: R+5.6 2008: R+11.1
Not yet ingested
- Civics
- —
Market trends
- HPI YoY
- ▲ 2.58%
- Current HPI
- 115.1058
- Rent YoY
- —
- Metro
- —
- State GDP YoY
- ▲ 3.29%
- F500 in state
- 10
Industry mix (Fortune 500 HQ in LA)
| Industry | F500 HQs | Revenue |
|---|---|---|
| Telecommunications | 2 | $23B |
|
||
| Utilities | 1 | $12B |
|
||
| Wholesale / Distribution | 1 | $5B |
|
||
| Advertising | 1 | $2B |
|
||
Price history
1 event — show timeline
- 2026-06-12 Listed $85,000 NELABOR
Property tax history
+4.0%/yrLatest (2024): $728 · +31.5% YoY. Source: county tax records.
Cash-flow waterfall
monthlySold comps — $/sqft
last 12 mo · ≤1 miLoading sold comps…