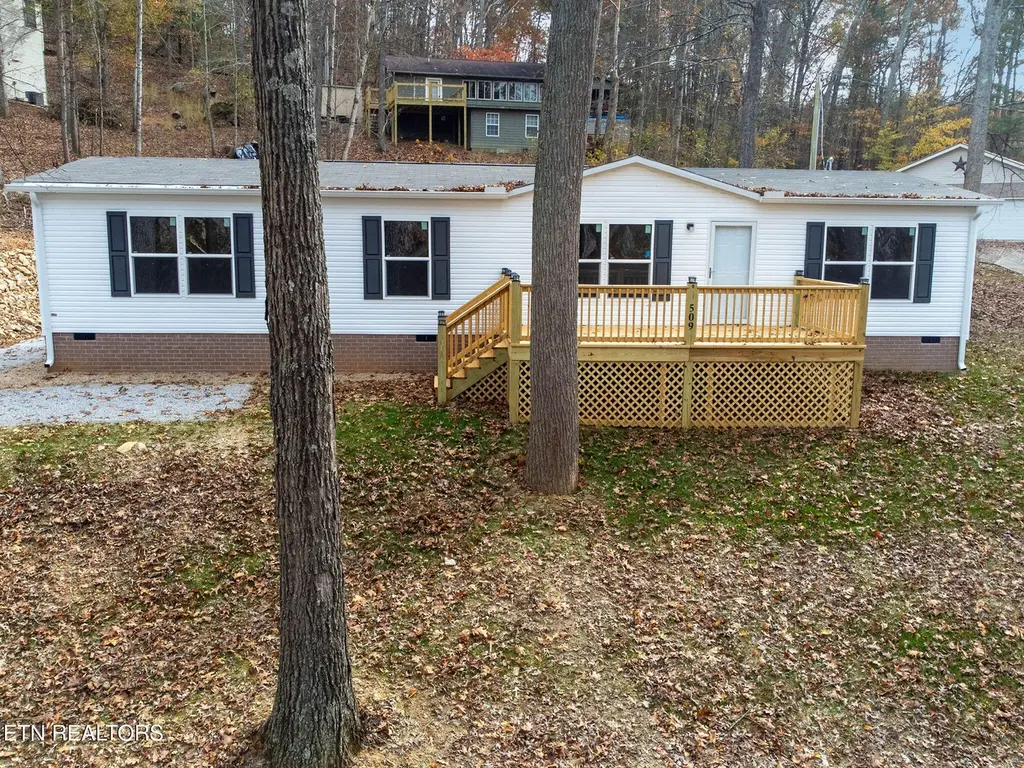
509 Lakewood Rd · Kingston, TN
Flood risk 9/10 · Severe
- FEMA flood zone
- X (unshaded)
- Chance of flooding over 30 yrs
- 0.99%
- Est. flood insurance / yr
- $507 – $1,088
Fire risk 4/10 · Minor
- Est. fire insurance / yr
- $949 – $1,763
Heat risk 5/10 · Moderate
- Hot days now (above 104°F)
- 7 days/yr
- Hot days in 30 yrs
- 20 days/yr
Wind risk 2/10 · Minimal
- Chance of severe wind over 30 yrs
- 3.0%
Air-quality risk 3/10 · Minor
- Unhealthy air days now
- 2 days/yr
- Unhealthy air days in 30 yrs
- 2 days/yr
Risk factors via First Street. Map © Google.
Why this score? — see what drove the D grade
The composite is a weighted blend of 9 inputs, each scored 0–100. Each bar is that input's sub-score; the figure is the points it added to the 100-point composite (weight × sub-score).
- Cash flow +13.9/30.0
- ARV discount +7.5/15.0
- DSCR +4.2/10.0
- 1% rule +3.9/10.0
- Livability +3.2/5.0
- Rent growth +2.5/5.0
- Schools +2.5/10.0
- Condition / age +2.5/5.0
- Appreciation +0.0/10.0
$269,999
🖨 Deal sheet (PDF) 📄 Offer letter ✓ Due diligence
Listing remarks
Lake access and public boat ramp!!! Discover lakeview living in this brand-new 2025 Clayton home, perfectly set on a quiet . 46-acre lot in Kingston, TN. Offering 1,580 sq. ft. , 3 bedrooms, 2 baths, and a flexible bonus room that can easily function as a 4th bedroom, this home blends modern design with a peaceful setting. The open kitchen features a large island and LVP flooring, while the spacious primary bedroom includes a soaking tub and walk-in shower. Outdoors, relax on the expansive 20x10 front porch with lake views, or enjoy the private backyard with its own 6x8 deck. Watch deer wander through the yard, take in the tranquil surroundings, and launch your boat just half a mile away. C
Key facts
- Flexible bonus room
- Public boat ramp
- Large island
Tags
Property features AI
Exterior
- Parking: Off-street parking
- Utilities: Septic tank
- Home design: Detached property
- Construction: Vinyl siding; Block construction; Crawl space foundation; Built area approximately 1,580 (source: plans)
- Exterior features: Vinyl windows; Boat ramp; Wooded view; Lake view
Interior
- Kitchen: Dishwasher; Refrigerator
- Bathrooms: 2 full bathrooms
- Heating & cooling: Central heating (electric); Central cooling
- Interior features: Walk-in closet(s); Eat-in kitchen; 6 total rooms
Neighborhood map
What this means for you Summary
Snapshot
- This is a 3-bed/2.0-bath other listed at $270k.
Deal economics
- At list price, monthly cash flow is $-36 ($-436/yr) — negative.
- To cash-flow at today's rent, offer at most $265k (1.9% below list).
- To meet the 1% rule (rent ≥ 1% of price), the offer needs to be $240k (11.1% below list).
- Recommended offer: $240k (11.1% below list) — sets the bar for 1% rule.
- Cap rate 6.4% vs local median 2.8% in Kingston — top-decile yield for the area; either an underpriced asset or a hidden risk that comps aren't pricing in. Stress-test before assuming the spread holds.
Location & tenants
- Location reads 63/100 on livability (#205 in TN) — a middle-class / working-renter tenant base. Strengths: crime A+, cost of living A+, housing A+; Watch: amenities F, commute F, employment F.
- Roane County (town): math 30% / reading 29% proficiency, ranked #64 of 139 in TN (top 46%) — low school quality limits family demand, transient renter base, plan for 1-2y turnover.
- Zoned schools: Kingston Elementary (math 36% / reading 36%, grade F, #305 of 952 statewide, top 32%, 808 students, 0% FRL); Cherokee Middle School (math 43% / reading 34%, grade F, #49 of 333 statewide, top 15%, 470 students, 0% FRL); Roane County High School (math 2% / reading 42%, grade F, #156 of 332 statewide, top 49%, 652 students, 0% FRL) — zoned schools average 0% FRL vs 50% district-wide (50 pts lower); this property's tenant base skews higher-income than the district average.
- Market conditions: 153 active listings in the ZIP; 2 comparable units currently listed for rent nearby; 229 units permitted in Roane County in 2024 (0 in 5+ unit buildings).
Forward outlook
- Local home prices are declining (-3.0%/yr); year-one equity from $2k of loan paydown is wiped out by about $8k of value loss. Plan a longer hold.
- Roane County population projected at -21% by 2050 — secular population decline; favor cash flow + early exit over multi-decade hold.
Negotiation context
- It's been on market 21 days — a 2% lower offer ($266k) is reasonable based on typical stale-listing flexibility.
- 7 sale attempts since 5y ago with the ask held roughly flat each time — persistent listings suggest the price (not the market) is what's stuck; bring a comps-based counter.
- Current owner paid $52k; list at $270k implies a 419% gain — meaningful room to come down on a strong offer.
Risks & watch-outs
- Watch-outs: flood insurance adds $66/mo.
- Climate carrying-cost: severe flood risk; extreme-heat days projected 7→20/yr by 2055 (HVAC capex compounding) — expect insurance premiums to compound above CPI over the hold.
Questions for the listing agent
- What do current leases actually rent for vs. the listed asking? Can we see a recent rent roll and the last 12 months of T-12 income?
- What's the actual annual flood-insurance premium (NFIP or private), and is the property in a SFHA with mandatory coverage?
- Is there a deadline driving the sale (1031 exchange, divorce, estate, relocation)? That informs how much negotiation room exists.
- Schools are D-rated, which usually means shorter tenancies and higher turnover. Who's the typical renter profile here, and what's been the actual vacancy rate?
- The area grade is low — what's the realistic commute time and amenity access for the typical tenant pool here? Any planned neighborhood developments (good or bad) we should know about?
- What's the average days-on-market for RENTAL listings here right now (not sales)? A rising rental-DOM trend means longer vacancies and softer asking-rent achievability than the comps imply.
- What's the recent tenant-quality profile in this submarket — average credit score on applications, eviction rate, late-payment / NSF rate, and stable-employment percentage? A property-management company in the area should have these aggregated.
- How much new for-sale + rental construction is in the pipeline within 1–3 miles? Heavy new supply typically softens prices + rents 12–24 months out; constrained supply supports both.
Investment metrics
- 1% rule
- 0.89% ✗
- Cap rate
- 6.43%
- Cash-on-cash
- 0.48%
- DSCR
- 1.02
- GRM
- 9.4
CMA / ARV
No comps found within radius.
Projected returns pro-forma
-3.0% appreciation · 3.0% rent growth · sell at horizon
- IRR
- -17.2%
- Equity multiple
- 0.39×
- Total profit
- $-45,990
- Equity at exit
- $40,258
- IRR
- -9.1%
- Equity multiple
- 0.43×
- Total profit
- $-42,716
- Equity at exit
- $23,345
Cash invested: $75,600 (down + closing). Projections, not guarantees.
Landlord ↔ Tenant lean methodology
- Overall (STATE)
- 87 Strongly Landlord-Friendly
- State Tennessee
- 87 Strongly Landlord-Friendly · R+13
- County
- — inherits STATE
- City
- — inherits STATE
ZIP-level market 37763
- Home prices YoY
- -30.8%
- Active inventory
- 153
- Price-to-rent
- 9.4×
Monthly cashflow live
- Estimated rent
- $2,400 medium interval (Pro) →
- Mortgage (P&I)
- −$1,416
- Tax est. 1.5%
- −$337 /mo · $4,050/yr
- Insurance
- −$112
- Flood insurance flood zone
- −$66 /mo · $798/yr
- HOA
- −$0
- Vacancy / Maint / Mgmt
- −$504
- Net cashflow
- $-36
Break-even live
Sensitivity live
| Price | -10% $150 | -5% $57 | +0% $-36 | +5% $-130 | +10% $-223 |
|---|---|---|---|---|---|
| Rent | -10% $-226 | -5% $-131 | +0% $-36 | +5% $58 | +10% $153 |
| Rate | -1.0pp $100 | -0.5pp $32 | base $-36 | +0.5pp $-106 | +1.0pp $-178 |
UW: 25.0% down · 7.5% · 30yr · 1.5% tax · 5.0% vac · 8.0% maint · 8.0% mgmt
Financing live
Cash to close
- Down payment
- $67,500
- Closing costs
- $8,100
- Reserves months
- —
- Total cash needed
- —
Loan-product check · same deal, 3 products live
Conventional
25% down · 7.5% · 30yr
- Down + closing
- —
- Monthly P&I
- —
- Monthly cashflow
- —
- DSCR
- —
- Eligible?
- —
Personal DTI + credit; lowest rate.
DSCR
20% down · 8.5% · 30yr
- Down + closing
- —
- Monthly P&I
- —
- Monthly cashflow
- —
- DSCR
- —
- Eligible?
- —
No personal income docs; deal must DSCR.
Hard money
10% down · 12.0% · 12mo
- Down + closing
- —
- Monthly P&I
- —
- Monthly cashflow
- —
- DSCR
- —
- Eligible?
- —
Short-term bridge; refi at stabilization.
Rent comps 2 comps
| Address | Beds | Baths | Sqft | Rent | $/sqft | DOM | Units | Dist |
|---|---|---|---|---|---|---|---|---|
| 203 W Cumberland St Kingston, TN | 2.0 | 1.0 | 1094 | $2,400 | $2.19 | 45d | 1 | 1.07mi |
| 203 W Cumberland St Kingston, TN | 2.0 | 1.0 | 1094 | $2,400 | $2.19 | 22d | 1 | 1.07mi |
Listing history 15 events
-
2026-06-21days on market $269,999 Active 21 DOM
-
2026-06-18days on market $269,999 Active 18 DOM
-
2026-06-17days on market $269,999 Active 17 DOM
-
2026-06-16days on market $269,999 Active 16 DOM
-
2026-06-15days on market $269,999 Active 15 DOM
-
2026-06-14days on market $269,999 Active 13 DOM
-
2026-06-13days on market $269,999 Active 12 DOM
-
2026-06-10days on market $269,999 Active 10 DOM
-
2026-06-09days on market $269,999 Active 9 DOM
-
2026-06-08days on market $269,999 Active 8 DOM
-
2026-06-07days on market $269,999 Active 7 DOM
-
2026-06-03days on market $269,999 Active 3 DOM
-
2026-06-02days on market $269,999 Active 2 DOM
-
2026-06-01remarks 699-char remark
-
2026-06-01$269,999 Active 1 DOM
ⓘ Source: listings_history table (triggers on properties + properties_extension) + one-shot
backfill from property_details.listing_events for pre-trigger history.
Climate risk First Street
- Flood 9/10 Extreme FEMA zone X (unshaded) · 99% chance over 30 yrs
- Wildfire 4/10 Moderate
- Heat 5/10 Major 7 d/yr ≥104°F today · 20 d/yr by 30 yrs out
- Wind 2/10 Low 3% chance of damaging wind over 30 yrs
- Air quality 3/10 Moderate 2 unhealthy d/yr today · 2 by 30 yrs out
Nearby sold comps map
Loading sold comps map…
Walkable amenities ~0.75 mi
Loading nearby amenities…
Taxation est. · year 1
- Rental income
- $28,800
- − Mortgage interest
- −$15,124
- − Property taxes
- −$4,050
- − Insurance
- −$2,147
- − Repairs & maintenance
- −$2,304
- − Management
- −$2,304
- − Depreciation
- −$7,855
- Taxable loss
- −$4,984
- Est. tax savings @ 24.0%
- +$1,196
- After-tax cash flow
- $760/yr
For passive investors: Depreciation is non-cash, so a rental often shows a tax loss while cash-flowing — sheltering income. Rental losses are passive: they offset passive income freely, and up to $25,000/yr can offset ordinary (W-2) income if you actively participate and your MAGI is under $100k (phasing out to $0 by $150k); unused losses carry forward. On sale, claimed depreciation is recaptured at up to 25%, and gains may owe capital-gains tax (a 1031 exchange can defer both). Figures are a year-1 estimate at your 24.0% rate — not tax advice; consult a CPA.
Schools (NCES district)
- District
- Roane County
- NCES district ID
- 4703590
- Math proficiency
- 30% ▼ -10.00%
- Reading proficiency
- 29% ▼ -7.00%
- Median HH income
- $41,611
- Composite
- 25.0/100
- National rank
- #7557
- State rank
- #64 of 139 in TN
Livability — Kingston
- Score
- 63/100
- State rank
- #205
- US rank
- #16055
Category grades
Schools grade is shown separately in the Schools card above.
Census & demographics
- Census place
- Kingston, TN
- Population (ZIP)
- 16,394
Population outlook (Roane County) Hauer SSP2
- Today (2025)
- 49,652 people
- By 2030
- 47,648 · -4.0%
- By 2040
- 43,306 · -12.8%
- By 2050
- 39,294 · -20.9%
- By 2075
- 32,318 · -34.9%
- By 2100
- 27,137 · -45.3%
Race, ethnicity, and origin ACS 2023
- Neighborhood character
- Predominantly White (93%)
- Race & ethnicity
- White 93% Two or more races 2% Hispanic / Latino 2% Black 2%
- Common ancestry
- Serbian 3% Slovak 2% Lithuanian 2%
- Foreign-born
- 2% · Canada, Vietnam
- Languages at home
- 97% English-only · Spanish 2% German/W. Germanic 1%
Political lean MEDSL · Roane
- 2024 margin
- Solid R (+54.5) · D 22.1% · R 76.7% · Other 1.2%
- 2008→2024 swing
- -18.3pp toward R · 2008: -36.2pp · 2024: -54.5pp
- All cycles
- 2024: R+54.5 2020: R+50.9 2016: R+51.1 2012: R+41.3 2008: R+36.2
Not yet ingested
- Civics
- —
Market trends
- HPI YoY
- ▼ -104.77%
- Current HPI
- 235.9959
- Rent YoY
- —
- Metro
- —
- State GDP YoY
- ▲ 2.78%
- F500 in state
- 22
Industry mix (Fortune 500 HQ in TN)
| Industry | F500 HQs | Revenue |
|---|---|---|
| Healthcare | 3 | $91B |
|
||
| Retail | 3 | $72B |
|
||
| Transportation / Logistics | 1 | $88B |
|
||
| Paper / Packaging | 1 | $19B |
|
||
| Insurance | 1 | $13B |
|
||
| Energy | 1 | $12B |
|
||
Price history
+2600.0% since first listed32 events — show timeline
- 2026-05-31 Listed $269,999 Knoxville MLS
- 2026-04-16 Listing Removed — Knoxville MLS
- 2026-04-16 Listing Removed — REALTRACS as Distributed by MLS Grid
- 2026-02-07 Price Changed $274,900 Knoxville MLS
- 2026-01-08 Price Changed $279,900 Knoxville MLS
- 2025-11-15 Price Changed $289,900 Knoxville MLS
- 2025-10-22 Price Changed $294,900 Knoxville MLS
- 2025-10-09 Price Changed $299,900 Knoxville MLS
- 2025-09-29 Price Changed $309,900 Knoxville MLS
- 2025-09-18 Listed $274,900 REALTRACS as Distributed by MLS Grid
- 2025-09-18 Listed $319,900 Knoxville MLS
- 2025-04-11 Sold (MLS) $52,000 Knoxville MLS
- 2025-03-12 Contingent — Knoxville MLS
- 2025-03-04 Price Changed $55,000 Knoxville MLS
- 2025-01-31 Price Changed $56,000 Knoxville MLS
- 2025-01-13 Price Changed $57,000 Knoxville MLS
- 2024-12-13 Price Changed $58,000 Knoxville MLS
- 2024-11-08 Listed $59,000 Knoxville MLS
- 2024-11-05 Relisted — Knoxville MLS
- 2024-10-01 Pending — Knoxville MLS
- 2024-10-01 Listing Removed — Knoxville MLS
- 2024-08-12 Price Changed $59,900 Knoxville MLS
- 2024-06-26 Price Changed $65,000 Knoxville MLS
- 2024-05-29 Listed $75,000 Knoxville MLS
- 2023-05-04 Sold (Public Records) $50,000 Public Records
- 2022-01-01 Listing Removed — Knoxville MLS
- 2021-04-23 Listed $50,000 Knoxville MLS
- 2011-03-22 Sold (Public Records) $98,000 Public Records
- 2004-08-25 Sold (Public Records) $15,000 Public Records
- 2001-04-18 Sold (Public Records) $12,000 Public Records
- 2001-04-18 Sold (Public Records) $12,000 Public Records
- 1997-12-01 Sold (Public Records) $10,000 Public Records
Property tax history
+4.0%/yrLatest (2025): $255 · +18.1% YoY. Source: county tax records.
Cash-flow waterfall
monthlySold comps — $/sqft
last 12 mo · ≤1 miLoading sold comps…