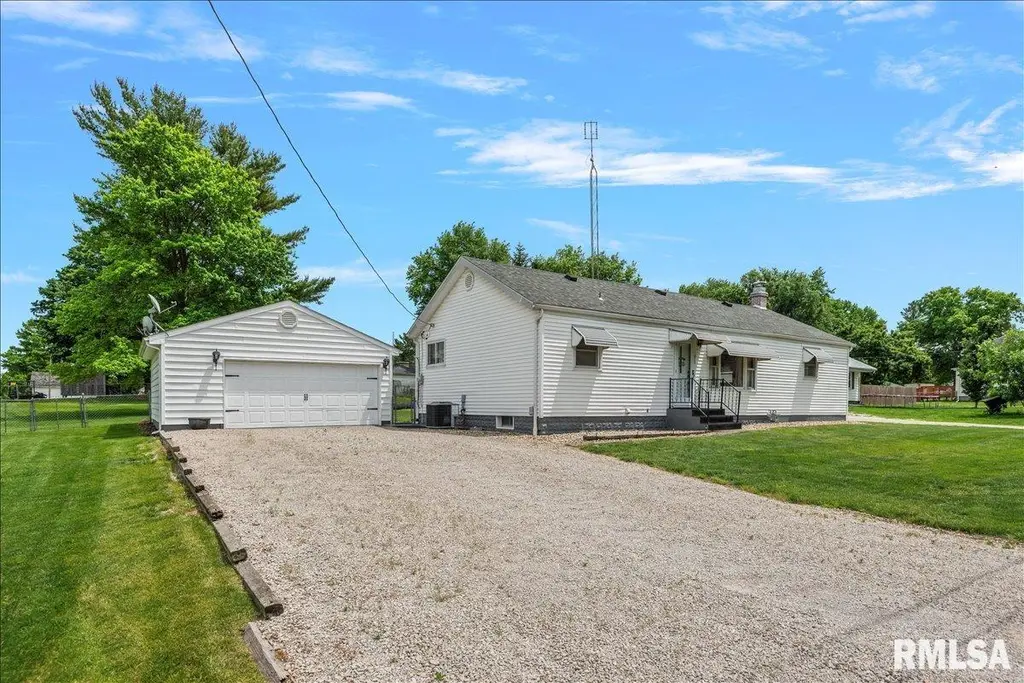
410 N Ewing St · Tallula, IL
Flood risk 1/10 · Minimal
- FEMA flood zone
- X (unshaded)
- Chance of flooding over 30 yrs
- 0.0%
- Est. flood insurance / yr
- $507 – $1,088
Fire risk 1/10 · Minimal
- Est. fire insurance / yr
- $804 – $1,492
Heat risk 3/10 · Minor
- Hot days now (above 105°F)
- 7 days/yr
- Hot days in 30 yrs
- 20 days/yr
Wind risk 2/10 · Minimal
- Chance of severe wind over 30 yrs
- 2.0%
Air-quality risk 2/10 · Minimal
- Unhealthy air days now
- 1 days/yr
- Unhealthy air days in 30 yrs
- 2 days/yr
Risk factors via First Street. Map © Google.
Why this score? — see what drove the C- grade
The composite is a weighted blend of 9 inputs, each scored 0–100. Each bar is that input's sub-score; the figure is the points it added to the 100-point composite (weight × sub-score).
- Cash flow +23.6/30.0
- DSCR +7.6/10.0
- Appreciation +6.0/10.0
- 1% rule +5.3/10.0
- Livability +2.9/5.0
- Rent growth +2.5/5.0
- Condition / age +2.5/5.0
- Schools +2.1/10.0
- ARV discount +0.0/15.0
$99,900
🖨 Deal sheet (PDF) 📄 Offer letter ✓ Due diligence
Listing remarks
Enjoy small town living in this well maintained 2 bedroom 1 bath ranch style home. Step inside to the spacious & inviting living room space with sliding glass door access opening to the back yard patio area. The furnace was replaced in 2025 and the A/C condenser unit in May of 2025. Roof was replaced in 2014 and most of the windows have been replaced. HUGE fenced back yard (1 lot & 1/2 of another included) & a 2.5 car detached garage make this property a must see! Laundry can be moved from the 2nd bedroom to the basement using the outside entrance to the basement. Schedule your showing today!
Key facts
- 0.39 acre lot
- 2 garage spots
- Built 1953
Property features AI
Exterior
- Parking: Detached garage with approximately 2.5 car spaces
- Utilities: Public water; Public sewer
- Home design: Single family residence; Residential zoning; Contains basement (crawl space, unfinished)
- Construction: Shingle roof; Built in 1953
- Exterior features: Replacement windows; Gravel and paved road access
Interior
- Kitchen: Microwave; Refrigerator
- Bedrooms: 2 bedrooms (one 14 x 11.5 on main level; one 9.5 x 11 on main level)
- Flooring: Carpet in bedrooms, living room, dining room, and kitchen
- Bathrooms: 1 full bathroom
- Heating & cooling: Central air; Forced air heating
- Interior features: Ceiling fan(s); Non-functional living room fireplace (1 total)
Neighborhood map
What this means for you Summary
Snapshot
- This is a 2-bed/1.0-bath single-family listed at $100k.
Deal economics
- At list price, monthly cash flow is $189 ($2k/yr) — positive.
- The deal already cash-flows at list — no discount required.
- Meets the 1% rule at list price ($1k rent vs $100k).
Location & tenants
- Location reads 58/100 on livability (#1,099 in IL) — a working-class tenant base; expect higher turnover. Strengths: cost of living A+, housing A+; Watch: crime D, amenities F, commute F.
- Porta CUSD 202 (town): math 16% / reading 29% proficiency, ranked #363 of 620 in IL (top 58%) — low school quality limits family demand, transient renter base, plan for 1-2y turnover.
- Zoned schools: Petersburg Elem School (345 students, 0% FRL); Porta High School (math 22% / reading 32%, grade F, #218 of 693 statewide, top 35%, 428 students, 0% FRL) — zoned schools average 0% FRL vs 32% district-wide (32 pts lower); this property's tenant base skews higher-income than the district average.
- Market conditions: 4 active listings in the ZIP; 9 units permitted in Menard County in 2024 (0 in 5+ unit buildings).
Forward outlook
- In year one you build about $3k of equity ($691 loan paydown + $2k appreciation (2.1% local appreciation)).
- Menard County population projected at -17% by 2050 — secular population decline; favor cash flow + early exit over multi-decade hold.
- At projected returns (2.1% appreciation + 3.0% rent growth), your $28k cash investment doubles in ~5 years — after that, you're playing with house money.
Negotiation context
- Only 9 days on market — expect competitive offers; lowballing is unlikely to land.
Risks & watch-outs
- Watch-outs: built in 1953 — expect roof / HVAC / electrical / plumbing capex.
Questions for the listing agent
- Built in 1953 — when were the roof, HVAC, electrical panel, plumbing, and water heater last replaced?
- Is there a deadline driving the sale (1031 exchange, divorce, estate, relocation)? That informs how much negotiation room exists.
- Schools are F-rated, which usually means shorter tenancies and higher turnover. Who's the typical renter profile here, and what's been the actual vacancy rate?
- Crime grade is D in this area — have there been break-ins, vandalism, or insurance claims at this property in the last 3 years? What carrier currently insures it and at what premium?
- What's the average days-on-market for RENTAL listings here right now (not sales)? A rising rental-DOM trend means longer vacancies and softer asking-rent achievability than the comps imply.
- What's the recent tenant-quality profile in this submarket — average credit score on applications, eviction rate, late-payment / NSF rate, and stable-employment percentage? A property-management company in the area should have these aggregated.
- How much new for-sale + rental construction is in the pipeline within 1–3 miles? Heavy new supply typically softens prices + rents 12–24 months out; constrained supply supports both.
Investment metrics
- 1% rule
- 1.03% ✓
- Cap rate
- 8.56%
- Cash-on-cash
- 8.11%
- DSCR
- 1.36
- GRM
- 8.1
CMA / ARV
- ARV (on-the-fly)
- $68,400
- Comps found
- 5
Show comp detail 5 sales within ~0.75 mi
| Address | Dist | Beds/Ba | Sqft | Sold | Price | $/sf | Match |
|---|---|---|---|---|---|---|---|
| 402 N Yates St | 0.09mi | 3/2.0 (+1) | 1,147 (-4%) | 20mo | $65,005 | $57 | 63 |
| 310 N Yates St | 0.12mi | 3/2.0 (+1) | 1,120 (-7%) | 19mo | $75,000 | $67 | 58 |
| 212 Ann Dr | 0.22mi | 2/1.0 | 1,065 (-11%) | 20mo | $80,000 | $75 | 54 |
| 209 S Yates St | 0.46mi | 2/1.0 | 1,076 (-10%) | 17mo | $20,000 | $19 | 47 |
| 104 S Elm St | 0.37mi | 2/1.0 | 1,045 (-13%) | 23mo | $54,500 | $52 | 42 |
Match score weights: distance 35% · size 25% · config 20% · recency 20%. Top-matched comps best support the ARV.
Projected returns pro-forma
2.06% appreciation · 3.0% rent growth · sell at horizon
- IRR
- 12.7%
- Equity multiple
- 1.69×
- Total profit
- $19,180
- Equity at exit
- $39,731
- IRR
- 15.3%
- Equity multiple
- 3.06×
- Total profit
- $57,689
- Equity at exit
- $57,466
Cash invested: $27,972 (down + closing). Projections, not guarantees.
Landlord ↔ Tenant lean methodology
- Overall (STATE)
- 43 Moderately Tenant-Leaning
- State Illinois
- 43 Moderately Tenant-Leaning · D+7
- County
- — inherits STATE
- City
- — inherits STATE
ZIP-level market 62688
- Home prices YoY
- 2.1%
- Active inventory
- 4
- Price-to-rent
- 8.1×
Monthly cashflow live
- Estimated rent
- $1,034 medium interval (Pro) →
- Mortgage (P&I)
- −$524
- Tax from tax record
- −$62 /mo · $744/yr
- Insurance
- −$42
- HOA
- −$0
- Vacancy / Maint / Mgmt
- −$217
- Net cashflow
- $189
Break-even live
Sensitivity live
| Price | -10% $246 | -5% $217 | +0% $189 | +5% $161 | +10% $133 |
|---|---|---|---|---|---|
| Rent | -10% $107 | -5% $148 | +0% $189 | +5% $230 | +10% $271 |
| Rate | -1.0pp $239 | -0.5pp $215 | base $189 | +0.5pp $163 | +1.0pp $137 |
UW: 25.0% down · 7.5% · 30yr · 1.5% tax · 5.0% vac · 8.0% maint · 8.0% mgmt
Financing live
Cash to close
- Down payment
- $24,975
- Closing costs
- $2,997
- Reserves months
- —
- Total cash needed
- —
Loan-product check · same deal, 3 products live
Conventional
25% down · 7.5% · 30yr
- Down + closing
- —
- Monthly P&I
- —
- Monthly cashflow
- —
- DSCR
- —
- Eligible?
- —
Personal DTI + credit; lowest rate.
DSCR
20% down · 8.5% · 30yr
- Down + closing
- —
- Monthly P&I
- —
- Monthly cashflow
- —
- DSCR
- —
- Eligible?
- —
No personal income docs; deal must DSCR.
Hard money
10% down · 12.0% · 12mo
- Down + closing
- —
- Monthly P&I
- —
- Monthly cashflow
- —
- DSCR
- —
- Eligible?
- —
Short-term bridge; refi at stabilization.
Listing history 9 events
-
2026-06-08status $99,900 Pending 9 DOM
-
2026-06-07days on market $99,900 Active 9 DOM
-
2026-06-07days on market $99,900 Active 8 DOM
-
2026-06-04days on market $99,900 Active 5 DOM
-
2026-06-02days on market $99,900 Active 4 DOM
-
2026-06-01days on market $99,900 Active 3 DOM
-
2026-05-31days on market $99,900 Active 2 DOM
-
2026-05-29$99,900 Active
-
2026-05-28historical $99,900
ⓘ Source: listings_history table (triggers on properties + properties_extension) + one-shot
backfill from property_details.listing_events for pre-trigger history.
Tax reassessment forecast IL · Partial reset (capped growth)
- Current annual tax
- $744 · $62/mo
- Projected year-2 tax
- $1,506 · $125/mo
- Expected delta
- +$762/yr (+$63/mo · 102.4%)
ⓘ Screening estimate from a state-policy table — verify with the county assessor before closing.
Climate risk First Street
- Flood 1/10 Low FEMA zone X (unshaded) · 0% chance over 30 yrs
- Wildfire 1/10 Low
- Heat 3/10 Moderate 7 d/yr ≥105°F today · 20 d/yr by 30 yrs out
- Wind 2/10 Low 2% chance of damaging wind over 30 yrs
- Air quality 2/10 Low 1 unhealthy d/yr today · 2 by 30 yrs out
Nearby sold comps map
Loading sold comps map…
Walkable amenities ~0.75 mi
Loading nearby amenities…
Taxation est. · year 1
- Rental income
- $12,405
- − Mortgage interest
- −$5,596
- − Property taxes
- −$744
- − Insurance
- −$500
- − Repairs & maintenance
- −$992
- − Management
- −$992
- − Depreciation
- −$2,906
- Taxable income
- $674
- Est. tax owed @ 24.0%
- −$162
- After-tax cash flow
- $2,108/yr
For passive investors: Depreciation is non-cash, so a rental often shows a tax loss while cash-flowing — sheltering income. Rental losses are passive: they offset passive income freely, and up to $25,000/yr can offset ordinary (W-2) income if you actively participate and your MAGI is under $100k (phasing out to $0 by $150k); unused losses carry forward. On sale, claimed depreciation is recaptured at up to 25%, and gains may owe capital-gains tax (a 1031 exchange can defer both). Figures are a year-1 estimate at your 24.0% rate — not tax advice; consult a CPA.
Schools (NCES district)
- District
- Porta CUSD 202
- NCES district ID
- 1731410
- Math proficiency
- 16% ▼ -9.00%
- Reading proficiency
- 29% ▼ -9.00%
- Median HH income
- $57,294
- Composite
- 20.63/100
- National rank
- #8544
- State rank
- #363 of 620 in IL
Livability — Tallula
- Score
- 58/100
- State rank
- #1099
- US rank
- #20865
Category grades
Schools grade is shown separately in the Schools card above.
Census & demographics
- Census place
- Tallula, IL
- Population (ZIP)
- 783
Population outlook (Menard County) Hauer SSP2
- Today (2025)
- 11,894 people
- By 2030
- 11,493 · -3.4%
- By 2040
- 10,675 · -10.2%
- By 2050
- 9,861 · -17.1%
- By 2075
- 8,334 · -29.9%
- By 2100
- 6,799 · -42.8%
Race, ethnicity, and origin ACS 2023
- Neighborhood character
- Predominantly White (99%)
- Race & ethnicity
- White 99%
- Common ancestry
- Italian 3% Romanian 2% Slovak 2%
- Languages at home
- 99% English-only · Spanish 1%
Political lean MEDSL · Menard
- 2024 margin
- Solid R (+41.5) · D 28.6% · R 70.0% · Other 1.4%
- 2008→2024 swing
- -26.6pp toward R · 2008: -14.9pp · 2024: -41.5pp
- All cycles
- 2024: R+41.5 2020: R+39.4 2016: R+37.7 2012: R+30.1 2008: R+14.9
Not yet ingested
- Civics
- —
Market trends
- HPI YoY
- ▲ 2.06%
- Current HPI
- 98.1121
- Rent YoY
- —
- Metro
- —
- State GDP YoY
- ▲ 1.59%
- F500 in state
- 60
Industry mix (Fortune 500 HQ in IL)
| Industry | F500 HQs | Revenue |
|---|---|---|
| Insurance | 4 | $201B |
|
||
| Consumer Goods | 4 | $87B |
|
||
| Industrial Machinery | 3 | $64B |
|
||
| Healthcare | 2 | $55B |
|
||
| Retail / Pharmacy | 1 | $148B |
|
||
| Agriculture / Food | 1 | $86B |
|
||
Price history
+0.0% since first listed2 events — show timeline
- 2026-05-29 Listed $99,900 RMLSA as Distributed by MLS Grid
- 2026-05-28 Coming Soon $99,900 RMLSA as Distributed by MLS Grid
Property tax history
+0.4%/yrLatest (2024): $744 · -1.1% YoY. Source: county tax records.
Cash-flow waterfall
monthlySold comps — $/sqft
last 12 mo · ≤1 miLoading sold comps…