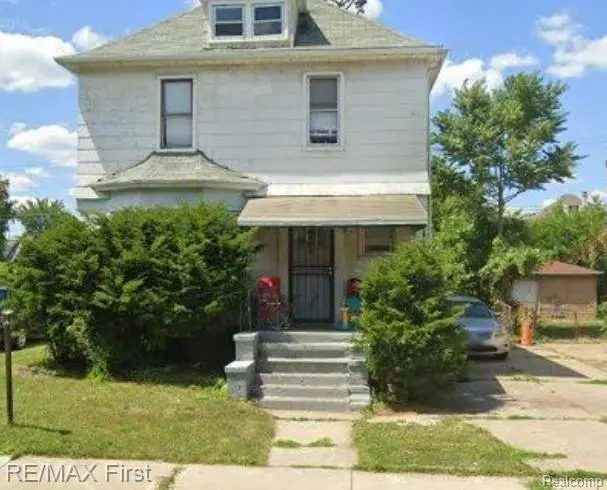
202 Tyler St · Highland Park, MI
Flood risk 1/10 · Minimal
- FEMA flood zone
- X (unshaded)
- Chance of flooding over 30 yrs
- 0.0%
- Est. flood insurance / yr
- $473 – $860
Fire risk 1/10 · Minimal
- Est. fire insurance / yr
- $784 – $1,456
Heat risk 3/10 · Minor
- Hot days now (above 97°F)
- 7 days/yr
- Hot days in 30 yrs
- 14 days/yr
Wind risk 2/10 · Minimal
- Chance of severe wind over 30 yrs
- —
Air-quality risk 4/10 · Minor
- Unhealthy air days now
- 4 days/yr
- Unhealthy air days in 30 yrs
- 6 days/yr
Risk factors via First Street. Map © Google.
Why this score? — see what drove the B grade
The composite is a weighted blend of 9 inputs, each scored 0–100. Each bar is that input's sub-score; the figure is the points it added to the 100-point composite (weight × sub-score).
- Cash flow +30.0/30.0
- 1% rule +10.0/10.0
- DSCR +10.0/10.0
- ARV discount +7.5/15.0
- Schools +5.0/10.0
- Livability +3.7/5.0
- Rent growth +2.5/5.0
- Condition / age +2.5/5.0
- Appreciation +0.0/10.0
$77,600
🖨 Deal sheet 📄 Offer letter ✓ Due diligence
Listing remarks MLS
Your opportunity to have this well-appointed 2-story home. Garage. Great for homeowners or investors. The accuracy of all information, regardless of the source, is not guaranteed or warranted. All information should be independently verified.
Key facts
- 5,227 sq ft lot
- Garage
- Built 1914
Neighborhood map
What this means for you Summary
Snapshot
- This is a 3-bed/1.0-bath single-family listed at $78k.
Deal economics
- At list price, monthly cash flow is $567 ($7k/yr) — positive.
- The deal already cash-flows at list — no discount required.
- Meets the 1% rule at list price ($1k rent vs $78k).
Location & tenants
- Location reads 73/100 on livability (#214 in MI) — a middle-class / working-renter tenant base. Strengths: commute A+, cost of living A+, housing A+; Watch: schools F, crime F, employment F.
- Market conditions: 216 active listings in the ZIP; 26 comparable units currently listed for rent nearby; rentals at typical pace (median 18d on market — plan ~3-4 weeks tenant-placement turnaround); lower-income renter base — watch delinquency; 2,639 units permitted in Wayne County in 2024 (1,216 in 5+ unit buildings).
- This rent runs 43% of the median local income ($38k/yr) — at the standard rent-burdened threshold; future hikes will face affordability resistance.
Forward outlook
- Local home prices are declining (-3.0%/yr); year-one equity from $537 of loan paydown is wiped out by about $2k of value loss. Plan a longer hold.
- Wayne County population projected at -17% by 2050 — secular population decline; favor cash flow + early exit over multi-decade hold.
- At projected returns (-3.0% appreciation + 3.0% rent growth), your $22k cash investment doubles in ~4 years — after that, you're playing with house money.
Negotiation context
- Only 1 days on market — expect competitive offers; lowballing is unlikely to land.
- 3 sale attempts; this cycle's ask has dropped $12k (13%) from the opening price — seller is motivated, your offer sets the floor, not the list.
Risks & watch-outs
- Watch-outs: built in 1914 — expect roof / HVAC / electrical / plumbing capex.
Questions for the listing agent
- Built in 1914 — when were the roof, HVAC, electrical panel, plumbing, and water heater last replaced?
- Is there a deadline driving the sale (1031 exchange, divorce, estate, relocation)? That informs how much negotiation room exists.
- Schools are F-rated, which usually means shorter tenancies and higher turnover. Who's the typical renter profile here, and what's been the actual vacancy rate?
- Crime grade is F in this area — have there been break-ins, vandalism, or insurance claims at this property in the last 3 years? What carrier currently insures it and at what premium?
- What's the average days-on-market for RENTAL listings here right now (not sales)? A rising rental-DOM trend means longer vacancies and softer asking-rent achievability than the comps imply.
- What's the recent tenant-quality profile in this submarket — average credit score on applications, eviction rate, late-payment / NSF rate, and stable-employment percentage? A property-management company in the area should have these aggregated.
- How much new for-sale + rental construction is in the pipeline within 1–3 miles? Heavy new supply typically softens prices + rents 12–24 months out; constrained supply supports both.
Investment metrics
- 1% rule
- 1.77% ✓
- Cap rate
- 15.06%
- Cash-on-cash
- 31.29%
- DSCR
- 2.39
- GRM
- 4.7
CMA / ARV
- ARV (median comp)
- $48,602
- List price
- $77,600
- Delta
- 59.68%
- Verdict
- OVERPRICED
- Comps
- 20 within 1.0 mi
Show comp detail 12 sales within ~0.75 mi
| Address | Dist | Beds/Ba | Sqft | Sold | Price | $/sf | Match |
|---|---|---|---|---|---|---|---|
| 213 Avalon St | 0.14mi | 3/2.5 | 1,404 (-2%) | 1mo | $139,000 | $99 | 83 |
| 186 Tyler St | 0.03mi | 3/1.5 | 1,428 (-0%) | 19mo | $91,000 | $64 | 80 |
| 219 Waverly St | 0.05mi | 3/1.0 | 1,557 (+8%) | 6mo | $145,000 | $93 | 79 |
| 199 Waverly St | 0.03mi | 3/1.0 | 1,324 (-8%) | 11mo | $35,000 | $26 | 77 |
| 134 Tyler St | 0.13mi | 4/1.0 (+1) | 1,280 (-11%) | 4mo | $28,000 | $22 | 68 |
| 189 Tuxedo St | 0.67mi | 3/1.0 | 1,425 (-1%) | 4mo | $25,000 | $18 | 65 |
| 63 Tyler St | 0.27mi | 3/2.0 | 1,610 (+12%) | 14mo | $220,000 | $137 | 51 |
| 1568 Highland St | 0.55mi | 4/2.0 (+1) | 1,344 (-6%) | 6mo | $65,000 | $48 | 50 |
| 1689 Tyler St | 0.59mi | 3/1.5 | 1,260 (-12%) | 6mo | $77,300 | $61 | 45 |
| 1563 W Buena Vista St | 0.45mi | 2/1.0 (-1) | 1,312 (-9%) | 18mo | $52,000 | $40 | 44 |
| 1981 Leslie St | 0.74mi | 3/1.5 | 1,518 (+6%) | 13mo | $50,000 | $33 | 43 |
| 53 Richton St | 0.55mi | 3/1.0 | 1,602 (+12%) | 16mo | $20,000 | $12 | 42 |
Match score weights: distance 35% · size 25% · config 20% · recency 20%. Top-matched comps best support the ARV.
Projected returns pro-forma
-3.0% appreciation · 3.0% rent growth · sell at horizon
- IRR
- 26.1%
- Equity multiple
- 2.08×
- Total profit
- $23,527
- Equity at exit
- $11,570
- IRR
- 33.8%
- Equity multiple
- 4.08×
- Total profit
- $67,006
- Equity at exit
- $6,709
Cash invested: $21,728 (down + closing). Projections, not guarantees.
Landlord ↔ Tenant lean methodology
- Overall (STATE)
- 62 Landlord-Friendly
- State Michigan
- 62 Landlord-Friendly · EVEN
- County
- — inherits STATE
- City
- — inherits STATE
ZIP-level market 48203
- Home prices YoY
- -23.3%
- Active inventory
- 216
- Price-to-rent
- 4.7×
Monthly cashflow live
- Estimated rent
- $1,377 high interval (Pro) →
- Mortgage (P&I)
- −$407
- Tax from tax record
- −$82 /mo · $986/yr
- Insurance
- −$32
- HOA
- −$0
- Vacancy / Maint / Mgmt
- −$289
- Net cashflow
- $567
Break-even live
UW: 25.0% down · 7.5% · 30yr · 1.5% tax · 5.0% vac · 8.0% maint · 8.0% mgmt
Financing live
Cash to close
- Down payment
- $19,400
- Closing costs
- $2,328
- Reserves months
- —
- Total cash needed
- —
Loan-product check · same deal, 3 products live
Conventional
25% down · 7.5% · 30yr
- Down + closing
- —
- Monthly P&I
- —
- Monthly cashflow
- —
- DSCR
- —
- Eligible?
- —
Personal DTI + credit; lowest rate.
DSCR
20% down · 8.5% · 30yr
- Down + closing
- —
- Monthly P&I
- —
- Monthly cashflow
- —
- DSCR
- —
- Eligible?
- —
No personal income docs; deal must DSCR.
Hard money
10% down · 12.0% · 12mo
- Down + closing
- —
- Monthly P&I
- —
- Monthly cashflow
- —
- DSCR
- —
- Eligible?
- —
Short-term bridge; refi at stabilization.
Rent comps 26 comps
| Address | Beds | Baths | Sqft | Rent | $/sqft | DOM | Units | Dist |
|---|---|---|---|---|---|---|---|---|
| 64 Glendale St Highland Park, MI | 4.0 | 1.0 | 1464 | $1,500 | $1.02 | 10d | 1 | 0.34mi |
| 27 Pasadena St Highland Park, MI | 2.0 | 1.0 | 900 | $825 | $0.92 | 43d | 1 | 0.43mi |
| 1926 Clements St Unit 1926 Detroit, MI | 3.0 | 1.0 | 1150 | $1,250 | $1.09 | 19d | 1 | 0.66mi |
| 1926 Clements St Detroit, MI | 3.0 | 1.0 | 1150 | $1,150 | $1.00 | 4d | 1 | 0.66mi |
| 101 Colorado St Unit NA Highland Park, MI | 4.0 | 1.5 | 1695 | $1,500 | $0.88 | 24d | 1 | 0.68mi |
| 168 Beresford St Highland Park, MI | 4.0 | 1.0 | 1541 | $1,475 | $0.96 | 17d | 1 | 0.76mi |
| 165 Rhode Island St Highland Park, MI | 4.0 | 1.5 | 1639 | $1,200 | $0.73 | 17d | 1 | 0.82mi |
| 2285 Cortland St Detroit, MI | 2.0 | 1.0 | 900 | $1,000 | $1.11 | 16d | 1 | 0.91mi |
| 2023 Tuxedo St Detroit, MI | 2.0 | 1.0 | 950 | $1,050 | $1.11 | 24d | 1 | 0.96mi |
| 2474 Fullerton St Detroit, MI | 3.0 | 1.0 | 1400 | $1,300 | $0.93 | 14d | 1 | 1.01mi |
| 1427 Calvert Ave Detroit, MI | 3.0 | 1.0 | 1100 | $1,750 | $1.59 | 43d | 1 | 1.01mi |
| 1427 Calvert Ave Detroit, MI | 3.0 | 1.0 | 1100 | $1,850 | $1.68 | 24d | 1 | 1.01mi |
| 326 Eason St Highland Park, MI | 3.0 | 1.0 | 1256 | $1,300 | $1.04 | 17d | 1 | 1.10mi |
| 520 Englewood St Detroit, MI | 4.0 | 1.5 | 1086 | $1,725 | $1.59 | 24d | 1 | 1.11mi |
| 9844 Woodrow Wilson St Detroit, MI | 3.0 | 1.0 | 1187 | $1,300 | $1.10 | 12d | 1 | 1.11mi |
| 1929 Calvert Ave Unit 2 Detroit, MI | 3.0 | 1.0 | 1414 | $1,199 | $0.85 | 14d | 1 | 1.15mi |
| 2045 Calvert St Detroit, MI | 2.0 | 2.0 | 1400 | $1,600 | $1.14 | 43d | 1 | 1.21mi |
| 2638 Richton St Unit 2638 Richton Upper Detroit, MI | 2.0 | 1.0 | 1000 | $900 | $0.90 | 43d | 1 | 1.22mi |
| 2676 Sturtevant St Unit 1 Detroit, MI | 2.0 | 1.0 | 1000 | $1,000 | $1.00 | 24d | 1 | 1.22mi |
| 101 Stevens St Highland Park, MI | 3.0 | 1.5 | 1152 | $1,600 | $1.39 | 17d | 1 | 1.26mi |
| 613 Belmont St Detroit, MI | 3.0 | 1.0 | 1100 | $1,350 | $1.23 | 17d | 1 | 1.34mi |
| 2634 Lawrence St Detroit, MI | 3.0 | 1.5 | 1388 | $1,600 | $1.15 | 1d | 1 | 1.39mi |
| 3209 W Grand St Detroit, MI | 3.0 | 1.0 | 1550 | $1,103 | $0.71 | 43d | 1 | 1.44mi |
| 505 Westminster St Detroit, MI | 3.0 | 1.0 | 1700 | $1,400 | $0.82 | 17d | 1 | 1.48mi |
| 70 Clairmount Ave Unit 2B Detroit, MI | 2.0 | 1.0 | 955 | $1,400 | $1.47 | 2d | 1 | 1.48mi |
| 2653 Calvert Ave Unit 1 Detroit, MI | 3.0 | 1.0 | 1305 | $1,200 | $0.92 | 43d | 1 | 1.50mi |
Listing history 18 events
-
2026-06-18remarks 408-char remark
-
2026-06-18pricedays on market $77,600 Active 1 DOM
-
2026-06-04days on market $77,608 Active 174 DOM
-
2026-06-03days on market $77,608 Active 173 DOM
-
2026-06-02days on market $77,608 Active 172 DOM
-
2026-06-01days on market $77,608 Active 171 DOM
-
2026-05-31days on market $77,608 Active 170 DOM
-
2026-05-19price $77,608 242-char remark
Show marketing remark (242 chars)
Your opportunity to have this well-appointed 2-story home. Garage. Great for homeowners or investors. The accuracy of all information, regardless of the source, is not guaranteed or warranted. All information should be independently verified.
-
2026-05-18price $77,608 242-char remark
Show marketing remark (242 chars)
Your opportunity to have this well-appointed 2-story home. Garage. Great for homeowners or investors. The accuracy of all information, regardless of the source, is not guaranteed or warranted. All information should be independently verified.
-
2026-03-27status Active 242-char remark
Show marketing remark (242 chars)
Your opportunity to have this well-appointed 2-story home. Garage. Great for homeowners or investors. The accuracy of all information, regardless of the source, is not guaranteed or warranted. All information should be independently verified.
-
2026-03-26historical 242-char remark
Show marketing remark (242 chars)
Your opportunity to have this well-appointed 2-story home. Garage. Great for homeowners or investors. The accuracy of all information, regardless of the source, is not guaranteed or warranted. All information should be independently verified.
-
2026-03-21price $79,900 242-char remark
Show marketing remark (242 chars)
Your opportunity to have this well-appointed 2-story home. Garage. Great for homeowners or investors. The accuracy of all information, regardless of the source, is not guaranteed or warranted. All information should be independently verified.
-
2026-02-22price $88,900 242-char remark
Show marketing remark (242 chars)
Your opportunity to have this well-appointed 2-story home. Garage. Great for homeowners or investors. The accuracy of all information, regardless of the source, is not guaranteed or warranted. All information should be independently verified.
-
2026-02-21price $88,900 242-char remark
Show marketing remark (242 chars)
Your opportunity to have this well-appointed 2-story home. Garage. Great for homeowners or investors. The accuracy of all information, regardless of the source, is not guaranteed or warranted. All information should be independently verified.
-
2025-12-11$89,400 Active 242-char remark
Show marketing remark (242 chars)
Your opportunity to have this well-appointed 2-story home. Garage. Great for homeowners or investors. The accuracy of all information, regardless of the source, is not guaranteed or warranted. All information should be independently verified.
-
2019-11-14soldstatus $143,000
ⓘ Source: listings_history table (triggers on properties + properties_extension) + one-shot
backfill from property_details.listing_events for pre-trigger history.
Tax reassessment forecast MI · Partial reset (capped growth)
- Current annual tax
- $986 · $82/mo
- Projected year-2 tax
- $1,090 · $91/mo
- Expected delta
- +$105/yr (+$9/mo · 10.6%)
ⓘ Screening estimate from a state-policy table — verify with the county assessor before closing.
Climate risk First Street
- Flood 1/10 Low FEMA zone X (unshaded) · 0% chance over 30 yrs
- Wildfire 1/10 Low
- Heat 3/10 Moderate 7 d/yr ≥97°F today · 14 d/yr by 30 yrs out
- Wind 2/10 Low
- Air quality 4/10 Moderate 4 unhealthy d/yr today · 6 by 30 yrs out
Nearby sold comps map
Loading sold comps map…
Walkable amenities ~0.75 mi
Loading nearby amenities…
Taxation est. · year 1
- Rental income
- $16,528
- − Mortgage interest
- −$4,347
- − Property taxes
- −$986
- − Insurance
- −$388
- − Repairs & maintenance
- −$1,322
- − Management
- −$1,322
- − Depreciation
- −$2,257
- Taxable income
- $5,905
- Est. tax owed @ 24.0%
- −$1,417
- After-tax cash flow
- $5,383/yr
For passive investors: Depreciation is non-cash, so a rental often shows a tax loss while cash-flowing — sheltering income. Rental losses are passive: they offset passive income freely, and up to $25,000/yr can offset ordinary (W-2) income if you actively participate and your MAGI is under $100k (phasing out to $0 by $150k); unused losses carry forward. On sale, claimed depreciation is recaptured at up to 25%, and gains may owe capital-gains tax (a 1031 exchange can defer both). Figures are a year-1 estimate at your 24.0% rate — not tax advice; consult a CPA.
Schools (NCES district)
No district data.
Livability — Highland Park
- Score
- 73/100
- State rank
- #214
- US rank
- #5271
Category grades
Schools grade is shown separately in the Schools card above.
Census & demographics
- Census place
- Highland Park, MI
- County
- Wayne County · 1,562,939 people
- Metro
- Detroit-Warren-Dearborn, MI
- Population (ZIP)
- 20,049
- Household income
- $38,404
- Rent vs Own
- Severe rent burden
- 1192.0
Population outlook (Wayne County) Hauer SSP2
- Today (2025)
- 1,675,273 people
- By 2030
- 1,620,300 · -3.3%
- By 2040
- 1,502,341 · -10.3%
- By 2050
- 1,384,039 · -17.4%
- By 2075
- 1,124,592 · -32.9%
- By 2100
- 881,193 · -47.4%
Race, ethnicity, and origin ACS 2023
- Neighborhood character
- Predominantly Black (85%)
- Race & ethnicity
- Black 85% White 8% Two or more races 5% Hispanic / Latino 2%
- Common ancestry
- Lithuanian 1%
- Foreign-born
- 2% · Canada
- Languages at home
- 95% English-only · Spanish 3% French/Haitian/Cajun 1%
Political lean MEDSL · Wayne
- 2024 margin
- Strong D (+29.0) · D 62.7% · R 33.7% · Other 3.6%
- 2008→2024 swing
- -20.5pp toward R · 2008: 49.5pp · 2024: 29.0pp
- All cycles
- 2024: D+29.0 2020: D+38.1 2016: D+37.3 2012: D+46.9 2008: D+49.5
Not yet ingested
- Civics
- —
Market trends
- HPI YoY
- ▼ -90.13%
- Current HPI
- 297.0176
- Rent YoY
- —
- Metro
- Detroit-Warren-Dearborn, MI
- State GDP YoY
- ▲ 1.37%
- F500 in state
- 28
Industry mix (Fortune 500 HQ in MI)
| Industry | F500 HQs | Revenue |
|---|---|---|
| Automotive Parts | 3 | $48B |
|
||
| Automotive | 2 | $372B |
|
||
| Chemicals | 1 | $45B |
|
||
| Automotive Retail | 1 | $29B |
|
||
| Healthcare / Medical Devices | 1 | $23B |
|
||
| Automotive Technology | 1 | $20B |
|
||
Price history
-45.7% since first listed11 events — show timeline
- 2026-05-19 Price Changed $77,608 MiRealSource-MiMLS
- 2026-05-18 Price Changed $77,608 REALCOMP
- 2026-03-27 Relisted — REALCOMP
- 2026-03-26 Listing Removed — REALCOMP
- 2026-03-21 Price Changed $79,900 MiRealSource-MiMLS
- 2026-03-21 Price Changed $79,900 REALCOMP
- 2026-02-22 Price Changed $88,900 MiRealSource-MiMLS
- 2026-02-21 Price Changed $88,900 REALCOMP
- 2025-12-11 Listed $89,400 REALCOMP
- 2025-12-11 Listed $89,400 MiRealSource-MiMLS
- 2019-11-14 Sold (Public Records) $143,000 Public Records
Property tax history
+0.6%/yrLatest (2025): $986 · -18.5% YoY. Source: county tax records.
Cash-flow waterfall
monthlySold comps — $/sqft
last 12 mo · ≤1 miLoading sold comps…