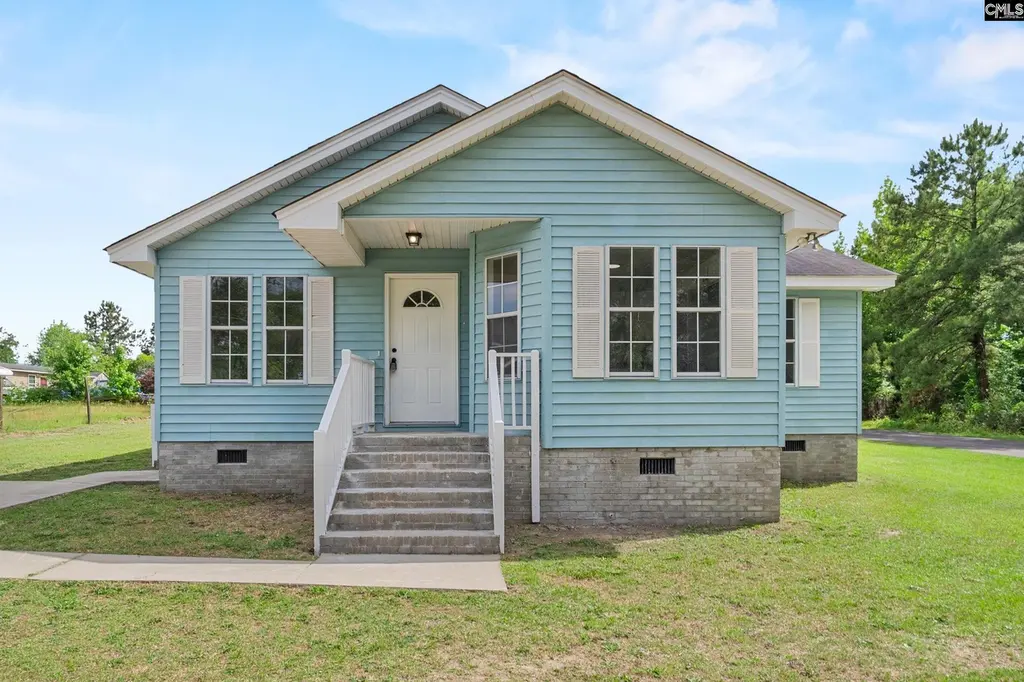
119 Sunny Acres Dr · Eastover, SC
Flood risk 1/10 · Minimal
- FEMA flood zone
- X
- Chance of flooding over 30 yrs
- 0.0%
- Est. flood insurance / yr
- $435 – $905
Fire risk 3/10 · Minor
- Est. fire insurance / yr
- $783 – $1,453
Heat risk 7/10 · Major
- Hot days now (above threshold)
- 7 days/yr
- Hot days in 30 yrs
- 16 days/yr
Wind risk No data
- Chance of severe wind over 30 yrs
- —
Air-quality risk No data
- Unhealthy air days now
- —
- Unhealthy air days in 30 yrs
- —
Risk factors via First Street. Map © Google.
Why this score? — see what drove the C- grade
The composite is a weighted blend of 9 inputs, each scored 0–100. Each bar is that input's sub-score; the figure is the points it added to the 100-point composite (weight × sub-score).
- Cash flow +16.9/30.0
- Appreciation +10.0/10.0
- ARV discount +7.5/15.0
- DSCR +5.3/10.0
- 1% rule +4.1/10.0
- Schools +2.6/10.0
- Rent growth +2.5/5.0
- Livability +2.5/5.0
- Condition / age +2.5/5.0
$154,999
🖨 Deal sheet 📄 Offer letter ✓ Due diligence
Listing remarks
This beautifully renovated 3 bedroom 2 bath home sits on a corner lot and is just minutes to shopping and schools. With granite countertops, stainless steel appliances, LVP flooring throughout and a private master bathroom, this affordable home feels very luxurious. Seller is offering $5000 in closing cost assistance with an acceptable contract and this home qualifies for full financing through USDA. You could be in this home for no money down. Disclaimer: CMLS has not reviewed and, therefore, does not endorse vendors who may appear in listings.
Key facts
- Lvp flooring
- Granite countertops
- Corner lot
Tags
Property features AI
Exterior
- Utilities: Public water; Public sewer
- Home design: Single-story home
- Construction: Crawlspace foundation
- Exterior features: Vinyl exterior finish; Paved road access
Interior
- Kitchen: Granite countertops; Painted cabinets; Luxury vinyl plank flooring in kitchen
- Bedrooms: Master bedroom on main level with private bath, tub/shower, and ceiling fan; Bedroom 2 on main level with shared bath, tub/shower and box ceilings; Bedroom 3 on main level with shared bath and tub/shower
- Flooring: Luxury vinyl plank flooring
- Bathrooms: Two full bathrooms
- Heating & cooling: Central heating (electric); Central cooling with heat pump on first level
- Interior features: Cathedral ceilings in living area; Luxury vinyl plank flooring throughout main living areas
- Laundry & utility: Washer/dryer located on main level
Neighborhood map
What this means for you Summary
Snapshot
- This is a 3-bed/2.0-bath single-family listed at $155k.
Deal economics
- At list price, monthly cash flow is $103 ($1k/yr) — positive.
- The deal already cash-flows at list — no discount required.
- To meet the 1% rule (rent ≥ 1% of price), the offer needs to be $141k (9.1% below list).
- Recommended offer: $141k (9.1% below list) — sets the bar for 1% rule.
Location & tenants
- Location reads 49/100 on livability (#370 in SC) — a working-class tenant base; expect higher turnover. Strengths: cost of living A+; Watch: crime F, amenities F, commute F.
- Richland 01 (urban): math 26% / reading 36% proficiency, ranked #54 of 80 in SC (top 68%) — families likely to look elsewhere, expect single-tenant / working-renter base with shorter leases; 64% free/reduced lunch — lower-income household profile, screen leases tightly.
- Zoned schools: Webber School (math 30% / reading 30%, grade F, #394 of 597 statewide, top 66%, 190 students, 100% FRL); Lower Richland High (math 5% / reading 64%, grade F, #185 of 196 statewide, top 94%, 1,244 students, 100% FRL) — zoned schools average 100% FRL vs 64% district-wide (36 pts higher); higher-poverty schools than district average — tighter screening recommended.
- Market conditions: 54 active listings in the ZIP; 3,472 units permitted in Richland County in 2024 (1,096 in 5+ unit buildings).
Forward outlook
- In year one you build about $17k of equity ($1k loan paydown + $16k appreciation (10.0% local appreciation)).
- Richland County population projected at +30% by 2050 — long-run rental-demand tailwind backs the buy-and-hold thesis.
- At projected returns (10.0% appreciation + 3.0% rent growth), your $43k cash investment doubles in ~3 years — after that, you're playing with house money.
- By year 3, paydown + projected appreciation supports a ~$42k cash-out refi (75% LTV) — recoverable capital for the next deal without selling this one.
Negotiation context
- It's been on market 35 days — a 3% lower offer ($150k) is reasonable based on typical stale-listing flexibility.
- Current owner paid $55k; list at $155k implies a 182% gain — meaningful room to come down on a strong offer.
Risks & watch-outs
- Climate carrying-cost: extreme-heat days projected 7→16/yr by 2055 (HVAC capex compounding) — expect insurance premiums to compound above CPI over the hold.
Questions for the listing agent
- It's been on market 35 days. Have you received any prior offers? Is the seller open to a 9% concession, seller financing, or rate buy-down credit?
- Is there a deadline driving the sale (1031 exchange, divorce, estate, relocation)? That informs how much negotiation room exists.
- Schools are F-rated, which usually means shorter tenancies and higher turnover. Who's the typical renter profile here, and what's been the actual vacancy rate?
- Crime grade is F in this area — have there been break-ins, vandalism, or insurance claims at this property in the last 3 years? What carrier currently insures it and at what premium?
- What's the average days-on-market for RENTAL listings here right now (not sales)? A rising rental-DOM trend means longer vacancies and softer asking-rent achievability than the comps imply.
- What's the recent tenant-quality profile in this submarket — average credit score on applications, eviction rate, late-payment / NSF rate, and stable-employment percentage? A property-management company in the area should have these aggregated.
- How much new for-sale + rental construction is in the pipeline within 1–3 miles? Heavy new supply typically softens prices + rents 12–24 months out; constrained supply supports both.
Investment metrics
- 1% rule
- 0.91% ✗
- Cap rate
- 7.09%
- Cash-on-cash
- 2.86%
- DSCR
- 1.13
- GRM
- 9.2
CMA / ARV
No comps found within radius.
Projected returns pro-forma
10.0% appreciation · 3.0% rent growth · sell at horizon
- IRR
- 26.3%
- Equity multiple
- 3.10×
- Total profit
- $90,981
- Equity at exit
- $139,635
- IRR
- 23.1%
- Equity multiple
- 7.05×
- Total profit
- $262,717
- Equity at exit
- $301,129
Cash invested: $43,400 (down + closing). Projections, not guarantees.
Landlord ↔ Tenant lean methodology
- Overall (STATE)
- 90 Strongly Landlord-Friendly
- State South Carolina
- 90 Strongly Landlord-Friendly · R+6
- County
- — inherits STATE
- City
- — inherits STATE
ZIP-level market 29044
- Home prices YoY
- 7.0%
- Active inventory
- 54
- Price-to-rent
- 9.2×
Monthly cashflow live
- Estimated rent
- $1,409 medium interval (Pro) →
- Mortgage (P&I)
- −$813
- Tax from tax record
- −$133 /mo · $1,593/yr
- Insurance
- −$65
- HOA
- −$0
- Vacancy / Maint / Mgmt
- −$296
- Net cashflow
- $103
Break-even live
UW: 25.0% down · 7.5% · 30yr · 1.5% tax · 5.0% vac · 8.0% maint · 8.0% mgmt
Financing live
Cash to close
- Down payment
- $38,750
- Closing costs
- $4,650
- Reserves months
- —
- Total cash needed
- —
Loan-product check · same deal, 3 products live
Conventional
25% down · 7.5% · 30yr
- Down + closing
- —
- Monthly P&I
- —
- Monthly cashflow
- —
- DSCR
- —
- Eligible?
- —
Personal DTI + credit; lowest rate.
DSCR
20% down · 8.5% · 30yr
- Down + closing
- —
- Monthly P&I
- —
- Monthly cashflow
- —
- DSCR
- —
- Eligible?
- —
No personal income docs; deal must DSCR.
Hard money
10% down · 12.0% · 12mo
- Down + closing
- —
- Monthly P&I
- —
- Monthly cashflow
- —
- DSCR
- —
- Eligible?
- —
Short-term bridge; refi at stabilization.
Listing history 19 events
-
2026-06-18days on market $154,999 Active 35 DOM
-
2026-06-17days on market $154,999 Active 34 DOM
-
2026-06-16days on market $154,999 Active 33 DOM
-
2026-06-15days on market $154,999 Active 32 DOM
-
2026-06-14days on market $154,999 Active 30 DOM
-
2026-06-10days on market $154,999 Active 27 DOM
-
2026-06-09days on market $154,999 Active 26 DOM
-
2026-06-08days on market $154,999 Active 25 DOM
-
2026-06-07days on market $154,999 Active 24 DOM
-
2026-06-03days on market $154,999 Active 20 DOM
-
2026-06-03days on market $154,999 Active 19 DOM
-
2026-06-01days on market $154,999 Active 18 DOM
-
2026-05-31days on market $154,999 Active 17 DOM
-
2026-05-14$154,999 Active
-
2026-03-24soldstatus $55,000
-
2011-03-28soldstatus $45,000
-
1997-03-13soldstatus $63,000
-
1996-08-12soldstatus $63,000
-
1995-10-11soldstatus $8,500
ⓘ Source: listings_history table (triggers on properties + properties_extension) + one-shot
backfill from property_details.listing_events for pre-trigger history.
Tax reassessment forecast SC · Resets to sale price
- Current annual tax
- $1,593 · $133/mo
- Projected year-2 tax
- $1,593 · $133/mo
- Expected delta
- $0/yr ($0/mo · 0.0%)
ⓘ Screening estimate from a state-policy table — verify with the county assessor before closing.
Climate risk First Street
- Flood 1/10 Low FEMA zone X · 0% chance over 30 yrs
- Wildfire 3/10 Moderate
- Heat 7/10 Severe
Nearby sold comps map
Loading sold comps map…
Walkable amenities ~0.75 mi
Loading nearby amenities…
Taxation est. · year 1
- Rental income
- $16,914
- − Mortgage interest
- −$8,682
- − Property taxes
- −$1,593
- − Insurance
- −$775
- − Repairs & maintenance
- −$1,353
- − Management
- −$1,353
- − Depreciation
- −$4,509
- Taxable loss
- −$1,352
- Est. tax savings @ 24.0%
- +$324
- After-tax cash flow
- $1,564/yr
For passive investors: Depreciation is non-cash, so a rental often shows a tax loss while cash-flowing — sheltering income. Rental losses are passive: they offset passive income freely, and up to $25,000/yr can offset ordinary (W-2) income if you actively participate and your MAGI is under $100k (phasing out to $0 by $150k); unused losses carry forward. On sale, claimed depreciation is recaptured at up to 25%, and gains may owe capital-gains tax (a 1031 exchange can defer both). Figures are a year-1 estimate at your 24.0% rate — not tax advice; consult a CPA.
Schools (NCES district)
- District
- Richland 01
- NCES district ID
- 4503360
- Math proficiency
- 26% ▼ -7.00%
- Reading proficiency
- 36% ▼ -5.00%
- Median HH income
- $38,931
- Composite
- 25.94/100
- National rank
- #7335
- State rank
- #54 of 80 in SC
Livability — Eastover
- Score
- 49/100
- State rank
- #370
- US rank
- #25856
Category grades
Schools grade is shown separately in the Schools card above.
Census & demographics
- Population (ZIP)
- 4,299
Population outlook (Richland County) Hauer SSP2
- Today (2025)
- 459,667 people
- By 2030
- 487,524 · +6.1%
- By 2040
- 542,035 · +17.9%
- By 2050
- 595,371 · +29.5%
- By 2075
- 732,998 · +59.5%
- By 2100
- 820,415 · +78.5%
Race, ethnicity, and origin ACS 2023
- Neighborhood character
- Majority Black (56%)
- Race & ethnicity
- Black 56% White 38% Two or more races 3% Hispanic / Latino 2%
- Common ancestry
- Serbian 2% Italian 2% Romanian 1%
- Foreign-born
- 1% · Canada
- Languages at home
- 97% English-only · Spanish 2%
Political lean MEDSL · Richland
- 2024 margin
- Solid D (+34.6) · D 66.4% · R 31.8% · Other 1.8%
- 2008→2024 swing
- +5.7pp toward D · 2008: 28.9pp · 2024: 34.6pp
- All cycles
- 2024: D+34.6 2020: D+38.3 2016: D+32.9 2012: D+33.3 2008: D+28.9
Not yet ingested
- Civics
- —
Market trends
- HPI YoY
- ▲ 13.20%
- Current HPI
- 200.54
- Rent YoY
- —
- Metro
- —
- State GDP YoY
- ▲ 4.51%
- F500 in state
- 2
Industry mix (Fortune 500 HQ in SC)
| Industry | F500 HQs | Revenue |
|---|---|---|
| Packaging | 1 | $7B |
|
||
Price history
+1723.5% since first listed6 events — show timeline
- 2026-05-14 Listed $154,999 Consolidated MLS
- 2026-03-24 Sold (Public Records) $55,000 Public Records
- 2011-03-28 Sold (Public Records) $45,000 Public Records
- 1997-03-13 Sold (Public Records) $63,000 Public Records
- 1996-08-12 Sold (Public Records) $63,000 Public Records
- 1995-10-11 Sold (Public Records) $8,500 Public Records
Property tax history
+0.7%/yrLatest (2025): $1,593 · +1.7% YoY. Source: county tax records.
Cash-flow waterfall
monthlySold comps — $/sqft
last 12 mo · ≤1 miLoading sold comps…