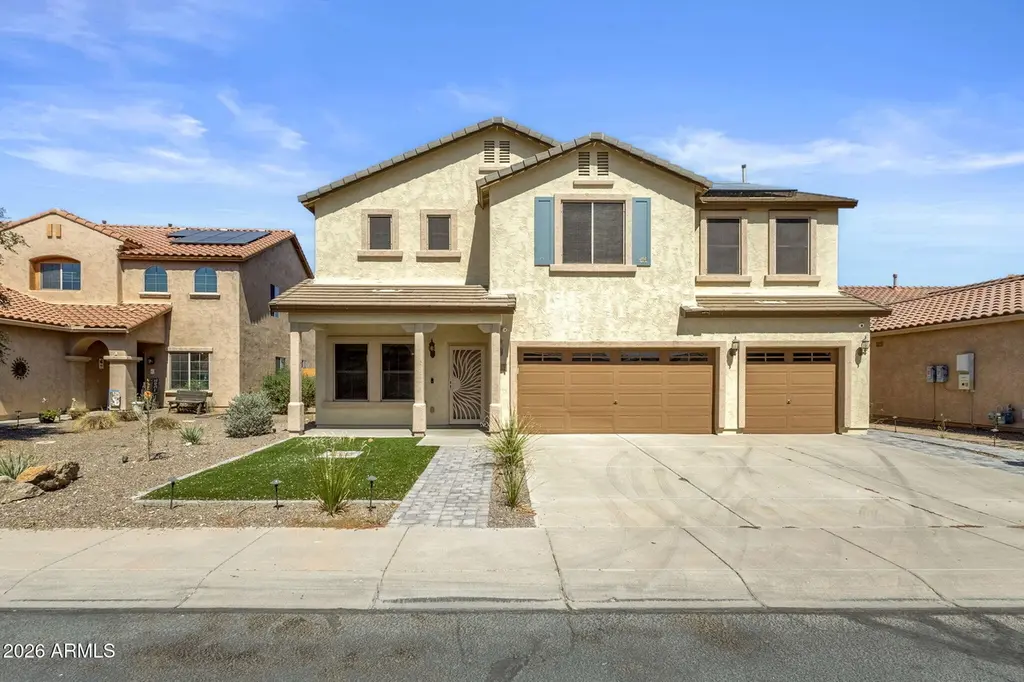
20787 N 259th Dr · Buckeye, AZ
Flood risk 1/10 · Minimal
- FEMA flood zone
- X (shaded)
- Chance of flooding over 30 yrs
- 0.0%
- Est. flood insurance / yr
- $507 – $1,088
Fire risk 5/10 · Moderate
- Est. fire insurance / yr
- $610 – $1,132
Heat risk 9/10 · Severe
- Hot days now (above 111°F)
- 7 days/yr
- Hot days in 30 yrs
- 18 days/yr
Wind risk 1/10 · Minimal
- Chance of severe wind over 30 yrs
- —
Air-quality risk 2/10 · Minimal
- Unhealthy air days now
- 0 days/yr
- Unhealthy air days in 30 yrs
- 1 days/yr
Risk factors via First Street. Map © Google.
Why this score? — see what drove the D+ grade
The composite is a weighted blend of 9 inputs, each scored 0–100. Each bar is that input's sub-score; the figure is the points it added to the 100-point composite (weight × sub-score).
- ARV discount +15.0/15.0
- Cash flow +12.5/30.0
- DSCR +3.7/10.0
- Rent growth +3.4/5.0
- Livability +3.4/5.0
- 1% rule +3.0/10.0
- Schools +2.9/10.0
- Condition / age +2.5/5.0
- Appreciation +0.0/10.0
$399,937
🖨 Deal sheet (PDF) 📄 Offer letter ✓ Due diligence
Listing remarks
Backing to open desert with view fencing and low-maintenance artificial turf, this spacious 5 bedroom plus loft home offers flexible living in the Festival Foothills community of Buckeye. Located near golf, parks, pools, tennis courts, playgrounds, and greenbelt trails, this home combines indoor comfort with access to year round outdoor recreation. Inside, the open concept floor plan features expansive living and dining areas with upgraded wood look tile flooring, neutral finishes, recessed lighting, and abundant natural light. The kitchen overlooks the main living space and includes white cabinetry, stainless steel appliances, center island seating, ample counter space, and a modern tile b
Key facts
- Recessed lighting
- White cabinetry
- 6,960 sq ft lot
Tags
Property features AI
Finance
- Other: Lot features for low-water desert landscaping
- Financial info: Current financing is non-assumable
- HOA & community: HOA with a monthly fee of $125; HOA covers grounds maintenance
Exterior
- Parking: Covered parking for 3 vehicles; 3-car garage with garage door opener
- Utilities: City water; Public sewer
- Home design: Single-family home; Fee simple ownership
- Construction: Stucco and painted wood-frame construction; Tile roof
- Exterior features: Desert front and back landscaping; Synthetic grass in backyard; Automatic irrigation timers front and back; Block and wrought-iron fencing; Asphalt road access; Community pool, spa (heated), tennis courts, playground, and biking/walking paths; Golf community
Interior
- Kitchen: Built-in microwave; Refrigerator; Dishwasher; Garbage disposal; Walk-in pantry; Kitchen island; Eat-in kitchen
- Bedrooms: Up to 6 bedrooms (possible)
- Flooring: Carpet; Tile
- Bathrooms: 3 full bathrooms
- Heating & cooling: Central air conditioning; Ceiling fans; Heating
- Interior features: High-speed internet; Granite countertops; Double vanity in primary bath; Upstairs living space; Eat-in kitchen; Kitchen island; Primary bath with separate shower and tub
- Laundry & utility: Laundry inside; Washer/dryer hookup (no appliances included)
Neighborhood map
What this means for you Summary
Snapshot
- This is a 5-bed/4.0-bath single-family listed at $400k.
Deal economics
- At list price, monthly cash flow is $-57 ($-689/yr) — negative.
- To cash-flow at today's rent, offer at most $390k (2.5% below list).
- To meet the 1% rule (rent ≥ 1% of price), the offer needs to be $322k (19.5% below list).
- Recommended offer: $322k (19.5% below list) — sets the bar for 1% rule.
- Cap rate 6.1% vs local median 3.1% in Buckeye — top-decile yield for the area; either an underpriced asset or a hidden risk that comps aren't pricing in. Stress-test before assuming the spread holds.
Location & tenants
- Location reads 68/100 on livability (#53 in AZ) — a middle-class / working-renter tenant base. Strengths: employment A+, housing A+, crime A; Watch: amenities F, commute F, health & safety F.
- Wickenburg Unified District (4236) (rural): math 33% / reading 35% proficiency, ranked #92 of 249 in AZ (top 37%) — families likely to look elsewhere, expect single-tenant / working-renter base with shorter leases.
- Zoned schools: Festival Foothills Elementary School (math 47% / reading 47%, grade D-, #308 of 1,109 statewide, top 29%, 314 students, 31% FRL); Wickenburg High School (math 27% / reading 32%, grade F, #120 of 381 statewide, top 34%, 460 students, 40% FRL).
- Market conditions: Rents rising (+3.4%/yr); 939 active listings in the ZIP; 3 comparable units currently listed for rent nearby; rentals leasing fast (median 6d on market — plan ~1-2 weeks tenant-placement turnaround); high-income renter base; 36,011 units permitted in Maricopa County in 2024 (12,801 in 5+ unit buildings).
- This rent runs 34% of the median local income ($114k/yr) — at the standard rent-burdened threshold; future hikes will face affordability resistance.
Forward outlook
- Local home prices are declining (-3.0%/yr); year-one equity from $3k of loan paydown is wiped out by about $12k of value loss. Plan a longer hold.
- Maricopa County population projected at +38% by 2050 — long-run rental-demand tailwind backs the buy-and-hold thesis.
Negotiation context
- It's been on market 20 days — a 2% lower offer ($394k) is reasonable based on typical stale-listing flexibility.
- 8 sale attempts since 8y ago with the ask held roughly flat each time — persistent listings suggest the price (not the market) is what's stuck; bring a comps-based counter.
- Current owner paid $257k; list at $400k implies a 56% gain — meaningful room to come down on a strong offer.
Risks & watch-outs
- Climate carrying-cost: moderate wildfire risk; extreme-heat days projected 7→18/yr by 2055 (HVAC capex compounding) — expect insurance premiums to compound above CPI over the hold.
Questions for the listing agent
- What do current leases actually rent for vs. the listed asking? Can we see a recent rent roll and the last 12 months of T-12 income?
- What does the HOA fee cover, when was the last increase, and are there any pending special assessments or reserve-fund shortfalls?
- Is there a deadline driving the sale (1031 exchange, divorce, estate, relocation)? That informs how much negotiation room exists.
- Schools are D-rated, which usually means shorter tenancies and higher turnover. Who's the typical renter profile here, and what's been the actual vacancy rate?
- The area grade is low — what's the realistic commute time and amenity access for the typical tenant pool here? Any planned neighborhood developments (good or bad) we should know about?
- What's the average days-on-market for RENTAL listings here right now (not sales)? A rising rental-DOM trend means longer vacancies and softer asking-rent achievability than the comps imply.
- What's the recent tenant-quality profile in this submarket — average credit score on applications, eviction rate, late-payment / NSF rate, and stable-employment percentage? A property-management company in the area should have these aggregated.
- How much new for-sale + rental construction is in the pipeline within 1–3 miles? Heavy new supply typically softens prices + rents 12–24 months out; constrained supply supports both.
Investment metrics
- 1% rule
- 0.80% ✗
- Cap rate
- 6.12%
- Cash-on-cash
- -0.62%
- DSCR
- 0.97
- GRM
- 10.4
CMA / ARV
- ARV (on-the-fly)
- $497,068
- Comps found
- 12
Show comp detail 12 sales within ~0.75 mi
| Address | Dist | Beds/Ba | Sqft | Sold | Price | $/sf | Match |
|---|---|---|---|---|---|---|---|
| 26011 W Tonopah Dr | 0.28mi | 4/2.5 (-1) | 3,146 (0%) | 3mo | $499,000 | $159 | 73 |
| 20351 N 259th Ave | 0.27mi | 4/3.0 (-1) | 3,046 (-3%) | 2mo | $510,000 | $167 | 71 |
| 26078 W Potter Dr | 0.21mi | 5/3.5 | 3,548 (+13%) | 8mo | $494,000 | $139 | 60 |
| 26029 W Quail Ave | 0.32mi | 4/3.5 (-1) | 3,496 (+11%) | 9mo | $547,000 | $156 | 52 |
| 20768 N 260th Ln | 0.19mi | 5/3.5 | 3,548 (+13%) | 21mo | $500,000 | $141 | 50 |
| 25919 W Lone Cactus Dr | 0.35mi | 4/3.5 (-1) | 2,821 (-10%) | 16mo | $442,000 | $157 | 46 |
| 26032 W Quail Ave | 0.34mi | 4/3.5 (-1) | 2,688 (-15%) | 11mo | $487,500 | $181 | 44 |
| 19985 N 260th Gln | 0.56mi | 4/3.5 (-1) | 2,790 (-11%) | 7mo | $499,900 | $179 | 42 |
| 25954 W Sequoia Dr | 0.69mi | 5/4.0 | 2,872 (-9%) | 15mo | $455,000 | $158 | 41 |
| 21800 N 260th Ln | 0.61mi | 4/3.5 (-1) | 3,496 (+11%) | 16mo | $545,000 | $156 | 33 |
| 20245 N 259th Ave | 0.33mi | 4/2.5 (-1) | 2,689 (-14%) | 22mo | $470,000 | $175 | 30 |
| 25982 W Sequoia Dr | 0.70mi | 5/2.5 | 2,703 (-14%) | 19mo | $410,000 | $152 | 22 |
Match score weights: distance 35% · size 25% · config 20% · recency 20%. Top-matched comps best support the ARV.
Projected returns pro-forma
-3.0% appreciation · 3.41% rent growth · sell at horizon
- IRR
- -16.9%
- Equity multiple
- 0.40×
- Total profit
- $-67,183
- Equity at exit
- $59,632
- IRR
- -8.1%
- Equity multiple
- 0.48×
- Total profit
- $-57,906
- Equity at exit
- $34,579
Cash invested: $111,982 (down + closing). Projections, not guarantees.
Landlord ↔ Tenant lean methodology
- Overall (STATE)
- 87 Strongly Landlord-Friendly
- State Arizona
- 87 Strongly Landlord-Friendly · R+3
- County
- — inherits STATE
- City
- — inherits STATE
ZIP-level market 85396
- Home prices YoY
- -18.8%
- Rents YoY
- 3.4%
- Active inventory
- 939
- Price-to-rent
- 10.4×
Monthly cashflow live
- Estimated rent
- $3,219 medium interval (Pro) →
- Mortgage (P&I)
- −$2,097
- Tax from tax record
- −$211 /mo · $2,535/yr
- Insurance
- −$167
- HOA
- −$125
- Vacancy / Maint / Mgmt
- −$676
- Net cashflow
- $-57
Break-even live
Sensitivity live
| Price | -10% $169 | -5% $56 | +0% $-57 | +5% $-171 | +10% $-284 |
|---|---|---|---|---|---|
| Rent | -10% $-312 | -5% $-185 | +0% $-57 | +5% $70 | +10% $197 |
| Rate | -1.0pp $144 | -0.5pp $44 | base $-57 | +0.5pp $-161 | +1.0pp $-266 |
UW: 25.0% down · 7.5% · 30yr · 1.5% tax · 5.0% vac · 8.0% maint · 8.0% mgmt
Financing live
Cash to close
- Down payment
- $99,984
- Closing costs
- $11,998
- Reserves months
- —
- Total cash needed
- —
Loan-product check · same deal, 3 products live
Conventional
25% down · 7.5% · 30yr
- Down + closing
- —
- Monthly P&I
- —
- Monthly cashflow
- —
- DSCR
- —
- Eligible?
- —
Personal DTI + credit; lowest rate.
DSCR
20% down · 8.5% · 30yr
- Down + closing
- —
- Monthly P&I
- —
- Monthly cashflow
- —
- DSCR
- —
- Eligible?
- —
No personal income docs; deal must DSCR.
Hard money
10% down · 12.0% · 12mo
- Down + closing
- —
- Monthly P&I
- —
- Monthly cashflow
- —
- DSCR
- —
- Eligible?
- —
Short-term bridge; refi at stabilization.
Rent comps 3 comps
| Address | Beds | Baths | Sqft | Rent | $/sqft | DOM | Units | Dist |
|---|---|---|---|---|---|---|---|---|
| 26001 W Tonopah Dr Buckeye, AZ | 5.0 | 3.5 | 3548 | $3,525 | $0.99 | 2d | 1 | 0.27mi |
| 25925 W Tonto Ln Buckeye, AZ | 4.0 | 2.0 | 2131 | $1,999 | $0.94 | 6d | 1 | 0.66mi |
| 25925 W Tonto Ln Buckeye, AZ | 4.0 | 2.0 | 2131 | $2,200 | $1.03 | 44d | 1 | 0.66mi |
HOA detail
- Monthly dues
- $125 · $1,500/yr
- Likely covers
- landscapingpool
Listing history 42 events
-
2026-06-17status $399,937 Pending 20 DOM
-
2026-06-17days on market $399,937 Active 20 DOM
-
2026-06-16days on market $399,937 Active 19 DOM
-
2026-06-15days on market $399,937 Active 18 DOM
-
2026-06-13days on market $399,937 Active 16 DOM
-
2026-06-13days on market $399,937 Active 15 DOM
-
2026-06-09days on market $399,937 Active 12 DOM
-
2026-06-08days on market $399,937 Active 11 DOM
-
2026-06-07days on market $399,937 Active 10 DOM
-
2026-06-04days on market $399,937 Active 7 DOM
-
2026-06-03days on market $399,937 Active 6 DOM
-
2026-06-02days on market $399,937 Active 5 DOM
-
2026-06-01days on market $399,937 Active 4 DOM
-
2026-05-31days on market $399,937 Active 3 DOM
-
2026-05-28$399,937 Active
-
2024-10-29historical
-
2024-07-07$485,000 Active
-
2024-04-02historical
-
2024-01-26price $499,000
-
2024-01-17$509,000 Active
-
2024-01-17historical
-
2024-01-05price $499,900
-
2024-01-02status Active
-
2023-12-31historical
-
2023-12-22price $523,333
-
2023-12-08price $524,900
-
2023-11-30$530,000 Active
-
2022-08-31historical
-
2022-08-12price $500,000
-
2022-08-03price $510,000
-
2022-07-25price $515,000
-
2022-07-17price $499,900
-
2022-07-13$515,000 Active
-
2021-11-22historical
-
2021-06-09$450,000 Active
-
2019-03-22soldstatus $257,000 Closed
-
2019-03-22soldstatus $257,000
-
2019-02-16status Pending
-
2019-02-08price $257,500
-
2019-01-23price $259,000
-
2018-12-27$265,000 Active
-
2018-12-05soldstatus $218,500
ⓘ Source: listings_history table (triggers on properties + properties_extension) + one-shot
backfill from property_details.listing_events for pre-trigger history.
Tax reassessment forecast AZ · Resets to sale price
- Current annual tax
- $2,535 · $211/mo
- Projected year-2 tax
- $2,640 · $220/mo
- Expected delta
- +$105/yr (+$9/mo · 4.1%)
ⓘ Screening estimate from a state-policy table — verify with the county assessor before closing.
Climate risk First Street
- Flood 1/10 Low FEMA zone X (shaded) · 0% chance over 30 yrs
- Wildfire 5/10 Major
- Heat 9/10 Extreme 7 d/yr ≥111°F today · 18 d/yr by 30 yrs out
- Wind 1/10 Low
- Air quality 2/10 Low 0 unhealthy d/yr today · 1 by 30 yrs out
Nearby sold comps map
Loading sold comps map…
Walkable amenities ~0.75 mi
Loading nearby amenities…
Taxation est. · year 1
- Rental income
- $38,624
- − Mortgage interest
- −$22,403
- − Property taxes
- −$2,535
- − Insurance
- −$2,000
- − Repairs & maintenance
- −$3,090
- − Management
- −$3,090
- − HOA
- −$1,500
- − Depreciation
- −$11,635
- Taxable loss
- −$7,627
- Est. tax savings @ 24.0%
- +$1,831
- After-tax cash flow
- $1,142/yr
For passive investors: Depreciation is non-cash, so a rental often shows a tax loss while cash-flowing — sheltering income. Rental losses are passive: they offset passive income freely, and up to $25,000/yr can offset ordinary (W-2) income if you actively participate and your MAGI is under $100k (phasing out to $0 by $150k); unused losses carry forward. On sale, claimed depreciation is recaptured at up to 25%, and gains may owe capital-gains tax (a 1031 exchange can defer both). Figures are a year-1 estimate at your 24.0% rate — not tax advice; consult a CPA.
Schools (NCES district)
- District
- Wickenburg Unified District (4236)
- NCES district ID
- 0409190
- Math proficiency
- 33% ▼ -10.00%
- Reading proficiency
- 35% ▼ -7.00%
- Median HH income
- $47,369
- Composite
- 29.27/100
- National rank
- #6560
- State rank
- #92 of 249 in AZ
Livability — Buckeye
- Score
- 68/100
- State rank
- #53
- US rank
- #9428
Category grades
Schools grade is shown separately in the Schools card above.
Census & demographics
- Census place
- Buckeye, AZ
- County
- Maricopa County · 4,537,380 people
- City population
- 117,540
- Metro
- Phoenix-Mesa-Chandler, AZ
- Population (ZIP)
- 42,181
- Household income
- $114,056
- Rent vs Own
- Severe rent burden
- 156.0
Population outlook (Maricopa County) Hauer SSP2
- Today (2025)
- 4,979,203 people
- By 2030
- 5,378,229 · +8.0%
- By 2040
- 6,156,598 · +23.6%
- By 2050
- 6,872,376 · +38.0%
- By 2075
- 8,401,270 · +68.7%
- By 2100
- 9,247,439 · +85.7%
Race, ethnicity, and origin ACS 2023
- Neighborhood character
- Diverse neighborhood (Simpson 0.56)
- Race & ethnicity
- White 59% Hispanic / Latino 31% Two or more races 18% Black 4% Asian 2% Native American 1%
- Hispanic origin (detail)
- Mexican 25%
- Common ancestry
- Slovak 4% Portuguese 2% Italian 2%
- Foreign-born
- 8% · Canada, Vietnam
- Languages at home
- 85% English-only · Spanish 12% German/W. Germanic 1% Other Indo-European 1%
Political lean MEDSL · Maricopa
- 2024 margin
- Toss-up / Even · D 47.7% · R 51.2% · Other 1.1%
- 2008→2024 swing
- +7.1pp toward D · 2008: -10.6pp · 2024: -3.5pp
- All cycles
- 2024: R+3.5 2020: D+2.2 2016: R+3.5 2012: R+12.0 2008: R+10.6
Not yet ingested
- Civics
- —
Market trends
- HPI YoY
- ▼ -56.97%
- Current HPI
- 246.4705
- Rent YoY
- ▲ 3.41%
- Metro
- Phoenix-Mesa-Chandler, AZ
- State GDP YoY
- ▲ 4.54%
- F500 in state
- 20
Industry mix (Fortune 500 HQ in AZ)
| Industry | F500 HQs | Revenue |
|---|---|---|
| Technology | 2 | $13B |
|
||
| Mining / Metals | 1 | $23B |
|
||
| Environmental Services | 1 | $16B |
|
||
| Metals / Steel | 1 | $14B |
|
||
| Technology Distribution | 1 | $9B |
|
||
| Homebuilding | 1 | $8B |
|
||
Price history
+83.0% since first listed28 events — show timeline
- 2026-05-28 Listed $399,937 ARMLS
- 2024-10-29 Listing Removed — ARMLS
- 2024-07-07 Listed $485,000 ARMLS
- 2024-04-02 Listing Removed — ARMLS
- 2024-01-26 Price Changed $499,000 ARMLS
- 2024-01-17 Listing Removed — ARMLS
- 2024-01-17 Listed $509,000 ARMLS
- 2024-01-05 Price Changed $499,900 ARMLS
- 2024-01-02 Relisted — ARMLS
- 2023-12-31 Listing Removed — ARMLS
- 2023-12-22 Price Changed $523,333 ARMLS
- 2023-12-08 Price Changed $524,900 ARMLS
- 2023-11-30 Listed $530,000 ARMLS
- 2022-08-31 Listing Removed — ARMLS
- 2022-08-12 Price Changed $500,000 ARMLS
- 2022-08-03 Price Changed $510,000 ARMLS
- 2022-07-25 Price Changed $515,000 ARMLS
- 2022-07-17 Price Changed $499,900 ARMLS
- 2022-07-13 Listed $515,000 ARMLS
- 2021-11-22 Listing Removed — ARMLS
- 2021-06-09 Listed $450,000 ARMLS
- 2019-03-22 Sold (Public Records) $257,000 Public Records
- 2019-03-22 Sold (MLS) $257,000 ARMLS
- 2019-02-16 Pending — ARMLS
- 2019-02-08 Price Changed $257,500 ARMLS
- 2019-01-23 Price Changed $259,000 ARMLS
- 2018-12-27 Listed $265,000 ARMLS
- 2018-12-05 Sold (Public Records) $218,500 Public Records
Property tax history
+9.6%/yrLatest (2025): $2,535 · -1.2% YoY. Source: county tax records.
Cash-flow waterfall
monthlySold comps — $/sqft
last 12 mo · ≤1 miLoading sold comps…