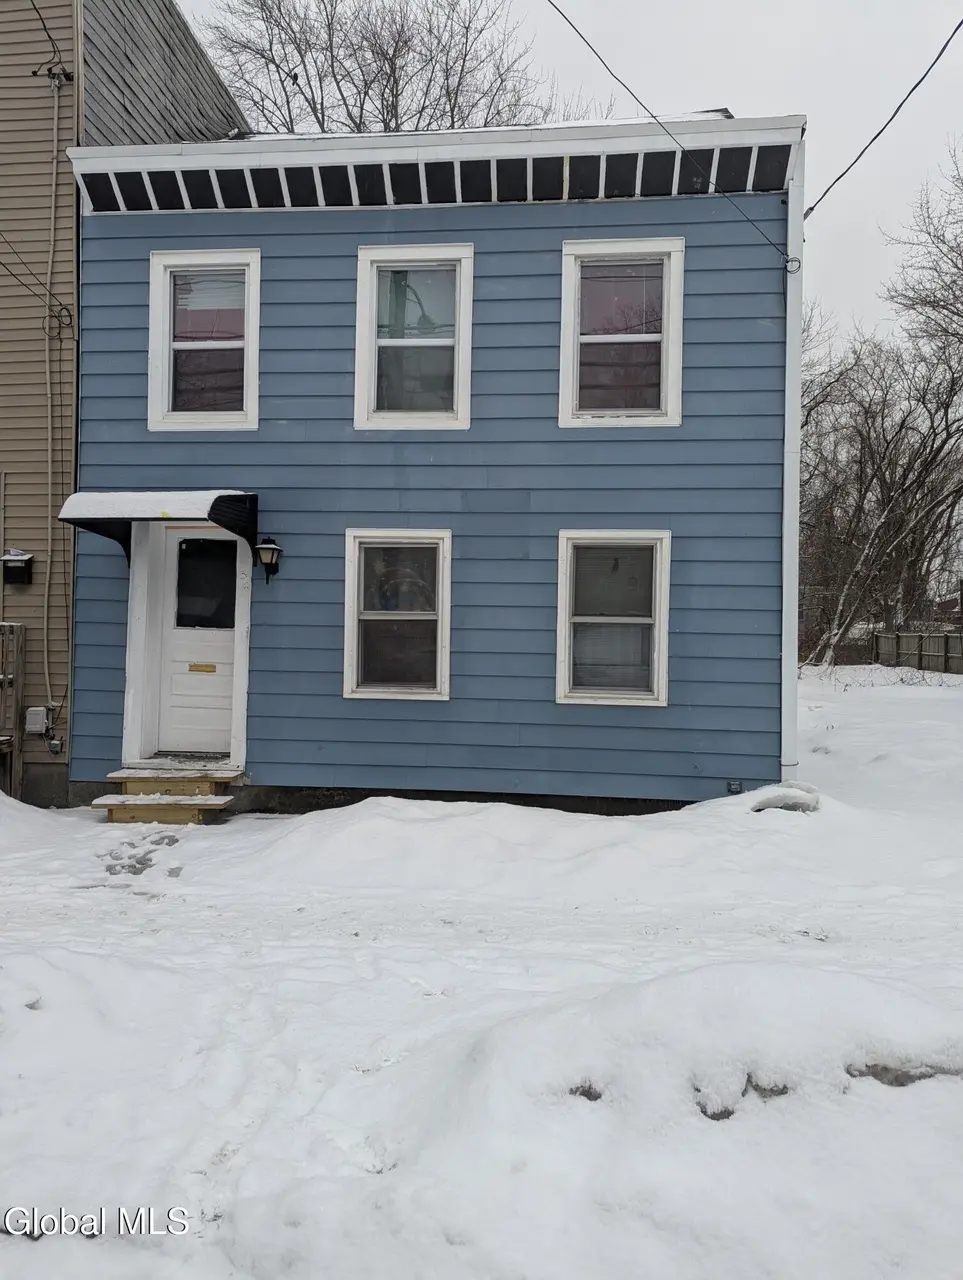
54 Ontario St · Albany, NY
Flood risk 1/10 · Minimal
- FEMA flood zone
- X (unshaded)
- Chance of flooding over 30 yrs
- 0.0%
- Est. flood insurance / yr
- $473 – $860
Fire risk 1/10 · Minimal
- Est. fire insurance / yr
- $691 – $1,283
Heat risk 4/10 · Minor
- Hot days now (above 97°F)
- 7 days/yr
- Hot days in 30 yrs
- 16 days/yr
Wind risk 3/10 · Minor
- Chance of severe wind over 30 yrs
- 6.0%
Air-quality risk 1/10 · Minimal
- Unhealthy air days now
- 0 days/yr
- Unhealthy air days in 30 yrs
- 0 days/yr
Risk factors via First Street. Map © Google.
Why this score? — see what drove the B grade
The composite is a weighted blend of 9 inputs, each scored 0–100. Each bar is that input's sub-score; the figure is the points it added to the 100-point composite (weight × sub-score).
- Cash flow +30.0/30.0
- DSCR +10.0/10.0
- 1% rule +9.2/10.0
- ARV discount +7.7/15.0
- Livability +4.0/5.0
- Rent growth +3.8/5.0
- Schools +3.2/10.0
- Condition / age +2.5/5.0
- Appreciation +0.0/10.0
$135,000
🖨 Deal sheet (PDF) 📄 Offer letter ✓ Due diligence
Listing remarks MLS
Great opportunity to own this 3-bedroom, 1-bath home listed at $135,000. Whether you're a first-time buyer looking to stop renting or an investor seeking to expand your portfolio, this property offers strong potential and value. The home features a functional layout, a full basement for additional storage or future possibilities, and important recent updates including a new heating system and new hot water tank, providing peace of mind for the next owner. With solid fundamentals and room to add your own touches, this property is a great option for affordable homeownership or a rental investment. Don't miss the chance to secure a property at an attractive price point with long-term potential.
Key facts
- New hot water tank
- Full basement
- New heating system
Tags
Neighborhood map
What this means for you Summary
Snapshot
- This is a 3-bed/1.0-bath townhouse listed at $135k.
Deal economics
- At list price, monthly cash flow is $700 ($8k/yr) — positive.
- The deal already cash-flows at list — no discount required.
- Meets the 1% rule at list price ($2k rent vs $135k).
- Recommended offer: $123k (9.0% below list) — sets the bar for market timing.
- Cap rate 12.5% vs local median 5.7% in Albany — top-decile yield for the area; either an underpriced asset or a hidden risk that comps aren't pricing in. Stress-test before assuming the spread holds.
Location & tenants
- Location reads 79/100 on livability (#129 in NY, #2,083 nationally) — a middle-class / working-renter tenant base. Strengths: amenities A+, commute A+, housing A+; Watch: employment C-, crime F.
- Albany City School District (urban): math 37% / reading 40% proficiency, ranked #543 of 590 in NY (top 92%) — families likely to look elsewhere, expect single-tenant / working-renter base with shorter leases; 66% free/reduced lunch — lower-income household profile, screen leases tightly.
- Market conditions: Rents rising fast (+5.4%/yr); 89 active listings in the ZIP; 40 comparable units currently listed for rent nearby; rentals at typical pace (median 25d on market — plan ~3-4 weeks tenant-placement turnaround); lower-income renter base — watch delinquency; 675 units permitted in Albany County in 2024 (451 in 5+ unit buildings).
- At $1,920/mo this rent would consume 55% of the median local household income ($42k/yr) (locally 2035% of renters already pay >50% of income on rent) — very limited rent-growth headroom before tenants either downsize or default.
Forward outlook
- Local home prices are declining (-3.0%/yr); year-one equity from $933 of loan paydown is wiped out by about $4k of value loss. Plan a longer hold.
- Albany County population projected at +9% by 2050 — modest demand growth; plan on rents tracking national, not racing it.
- At projected returns (-3.0% appreciation + 5.4% rent growth), your $38k cash investment doubles in ~5 years — after that, you're playing with house money.
Negotiation context
- It's been on market 107 days — a 9% lower offer ($123k) is reasonable based on typical stale-listing flexibility.
- 3 sale attempts since 7y ago with the ask held roughly flat each time — persistent listings suggest the price (not the market) is what's stuck; bring a comps-based counter.
- Current owner paid $30k; list at $135k implies a 350% gain — meaningful room to come down on a strong offer.
Risks & watch-outs
- Watch-outs: built in 1890 — expect roof / HVAC / electrical / plumbing capex.
Questions for the listing agent
- It's been on market 107 days. Have you received any prior offers? Is the seller open to a 9% concession, seller financing, or rate buy-down credit?
- Built in 1890 — when were the roof, HVAC, electrical panel, plumbing, and water heater last replaced?
- Why hasn't it sold? Are there any deal-killer items the seller is aware of (foundation, flood, title, zoning, code violations)?
- Is there a deadline driving the sale (1031 exchange, divorce, estate, relocation)? That informs how much negotiation room exists.
- Crime grade is F in this area — have there been break-ins, vandalism, or insurance claims at this property in the last 3 years? What carrier currently insures it and at what premium?
- What's the average days-on-market for RENTAL listings here right now (not sales)? A rising rental-DOM trend means longer vacancies and softer asking-rent achievability than the comps imply.
- What's the recent tenant-quality profile in this submarket — average credit score on applications, eviction rate, late-payment / NSF rate, and stable-employment percentage? A property-management company in the area should have these aggregated.
- How much new for-sale + rental construction is in the pipeline within 1–3 miles? Heavy new supply typically softens prices + rents 12–24 months out; constrained supply supports both.
Investment metrics
- 1% rule
- 1.42% ✓
- Cap rate
- 12.51%
- Cash-on-cash
- 22.22%
- DSCR
- 1.99
- GRM
- 5.9
CMA / ARV
- ARV (median comp)
- $135,684
- List price
- $135,000
- Delta
- -0.50%
- Verdict
- FAIR
- Comps
- 20 within 1.0 mi
Projected returns pro-forma
-3.0% appreciation · 5.37% rent growth · sell at horizon
- IRR
- 17.4%
- Equity multiple
- 1.72×
- Total profit
- $27,350
- Equity at exit
- $20,129
- IRR
- 27.4%
- Equity multiple
- 3.68×
- Total profit
- $101,240
- Equity at exit
- $11,672
Cash invested: $37,800 (down + closing). Projections, not guarantees.
Landlord ↔ Tenant lean methodology
- Overall (STATE)
- 15 Strongly Tenant-Friendly
- State New York
- 15 Strongly Tenant-Friendly · D+10
- County
- — inherits STATE
- City
- — inherits STATE
ZIP-level market 12206
- Home prices YoY
- -9.9%
- Rents YoY
- 5.4%
- Active inventory
- 89
- Price-to-rent
- 5.9×
Monthly cashflow live
- Estimated rent
- $1,920 high interval (Pro) →
- Mortgage (P&I)
- −$708
- Tax from tax record
- −$53 /mo · $633/yr
- Insurance
- −$56
- HOA
- −$0
- Vacancy / Maint / Mgmt
- −$403
- Net cashflow
- $700
Break-even live
Sensitivity live
| Price | -10% $776 | -5% $738 | +0% $700 | +5% $662 | +10% $624 |
|---|---|---|---|---|---|
| Rent | -10% $548 | -5% $624 | +0% $700 | +5% $776 | +10% $852 |
| Rate | -1.0pp $768 | -0.5pp $734 | base $700 | +0.5pp $665 | +1.0pp $629 |
UW: 25.0% down · 7.5% · 30yr · 1.5% tax · 5.0% vac · 8.0% maint · 8.0% mgmt
Financing live
Cash to close
- Down payment
- $33,750
- Closing costs
- $4,050
- Reserves months
- —
- Total cash needed
- —
Loan-product check · same deal, 3 products live
Conventional
25% down · 7.5% · 30yr
- Down + closing
- —
- Monthly P&I
- —
- Monthly cashflow
- —
- DSCR
- —
- Eligible?
- —
Personal DTI + credit; lowest rate.
DSCR
20% down · 8.5% · 30yr
- Down + closing
- —
- Monthly P&I
- —
- Monthly cashflow
- —
- DSCR
- —
- Eligible?
- —
No personal income docs; deal must DSCR.
Hard money
10% down · 12.0% · 12mo
- Down + closing
- —
- Monthly P&I
- —
- Monthly cashflow
- —
- DSCR
- —
- Eligible?
- —
Short-term bridge; refi at stabilization.
Rent comps 40 comps
| Address | Beds | Baths | Sqft | Rent | $/sqft | DOM | Units | Dist |
|---|---|---|---|---|---|---|---|---|
| 530 3rd St Apt 2 Albany, NY | 2.0 | 1.0 | 900 | $1,400 | $1.56 | 45d | 1 | 0.08mi |
| 260 Bradford St Unit 205 Albany, NY | 3.0 | 2.0 | 912 | $1,700 | $1.86 | 25d | 1 | 0.31mi |
| 526 Central Ave Albany, NY | 1.0–2.0 | 1.0 | 957 | $1,435 | $1.50 | 45d | 1 | 0.37mi |
| 569 Washington Ave Unit 1st Floor Albany, NY | 4.0 | 1.0 | 1275 | $2,000 | $1.57 | 45d | 1 | 0.43mi |
| 188 Spring St Unit 2 Albany, NY | 2.0 | 1.0 | 1200 | $1,475 | $1.23 | 45d | 1 | 0.50mi |
| 460 Washington Ave Albany, NY | 2.0 | 1.0 | 950 | $1,650 | $1.74 | 25d | 1 | 0.54mi |
| 223 Western Ave #1 Albany, NY | 3.0 | 1.0 | 1100 | $1,750 | $1.59 | 25d | 1 | 0.61mi |
| 147 Western Ave Albany, NY | 3.0 | 1.0 | 1428 | $1,800 | $1.26 | 16d | 1 | 0.62mi |
| 273 Western Ave Unit 2 Albany, NY | 3.0 | 1.0 | 1000 | $1,800 | $1.80 | 25d | 1 | 0.62mi |
| 273 Western Ave Unit 3 Albany, NY | 3.0 | 1.0 | 1100 | $1,850 | $1.68 | 25d | 1 | 0.62mi |
| 180 Western Ave Unit 1st Floor Albany, NY | 2.0 | 1.0 | 900 | $1,550 | $1.72 | 45d | 1 | 0.64mi |
| 178 Western Ave Unit 3 Albany, NY | 3.0 | 1.0 | 1500 | $1,725 | $1.15 | 16d | 1 | 0.64mi |
| 180 Western Ave Unit 2nd Floor Albany, NY | 2.0 | 1.0 | 1000 | $1,575 | $1.57 | 45d | 1 | 0.64mi |
| 58 Elberon Pl Apt 2 Albany, NY | 4.0 | 1.0 | 1250 | $2,200 | $1.76 | 45d | 1 | 0.68mi |
| 489 Hamilton St Unit 1 Albany, NY | 3.0 | 1.0 | 1100 | $1,800 | $1.64 | 16d | 1 | 0.74mi |
| 517 Hamilton St Albany, NY | 4.0 | 1.0 | 1020 | $2,000 | $1.96 | 25d | 1 | 0.75mi |
| 437 Hamilton St Unit 2 Albany, NY | 4.0 | 1.0 | 1200 | $2,300 | $1.92 | 16d | 1 | 0.76mi |
| 433 Hamilton St Unit 1 Albany, NY | 4.0 | 1.0 | 1200 | $2,300 | $1.92 | 16d | 1 | 0.77mi |
| 11 King Ave Unit 2 Albany, NY | 3.0 | 1.0 | 1100 | $1,600 | $1.45 | 16d | 1 | 0.78mi |
| 336 Clinton Ave Albany, NY | 2.0 | 1.0 | 900 | $1,700 | $1.89 | 45d | 1 | 0.79mi |
| 830 Madison Ave Albany, NY | 3.0 | 1.0 | 1180 | $1,700 | $1.44 | 25d | 1 | 0.84mi |
| 282 Livingston Ave Albany, NY | 3.0 | 1.5 | 1464 | $2,400 | $1.64 | 25d | 1 | 0.84mi |
| 240 Washington Ave Albany, NY | 2.0 | 2.0 | 1560 | $2,450 | $1.57 | 45d | 1 | 0.95mi |
| 110 Lark St Unit STREET-1 Albany, NY | 2.0 | 1.0 | 975 | $1,150 | $1.18 | 23d | 1 | 0.95mi |
| 110 Lark St Unit STREET-1 Albany, NY | 2.0 | 1.0 | 975 | $1,150 | $1.18 | 16d | 1 | 0.95mi |
| 673 Myrtle Ave Albany, NY | 4.0 | 1.0 | 1076 | $2,400 | $2.23 | 23d | 1 | 0.96mi |
| 254 Sheridan Ave Unit 2 Albany, NY | 3.0 | 1.0 | 900 | $1,300 | $1.44 | 25d | 1 | 0.98mi |
| 602 Morris St Albany, NY | 3.0 | 1.0 | 1270 | $1,850 | $1.46 | 16d | 1 | 0.98mi |
| 898 Lancaster St Unit 2 Albany, NY | 2.0 | 1.0 | 1200 | $1,700 | $1.42 | 25d | 1 | 1.03mi |
| 199 Lark St Albany, NY | 3.0 | 1.0 | 1000 | $1,800 | $1.80 | 45d | 1 | 1.03mi |
| 614 Park Ave Albany, NY | 3.0 | 1.0 | 1118 | $2,500 | $2.24 | 45d | 1 | 1.04mi |
| 352 State St Albany, NY | 2.0 | 2.0 | 1143 | $2,500 | $2.19 | 25d | 1 | 1.05mi |
| 32 Richmond St Unit 2 Albany, NY | 3.0 | 3.0 | 1248 | $2,500 | $2.00 | 16d | 1 | 1.07mi |
| 363 Ontario St Albany, NY | 1.0–2.0 | 1.0–2.5 | 1610 | $3,485 | $2.16 | 16d | 1 | 1.07mi |
| 135 Winthrop Ave Albany, NY | 3.0 | 2.0 | 1788 | $3,500 | $1.96 | 45d | 1 | 1.10mi |
| 520 Madison Ave Unit 1 Albany, NY | 3.0 | 1.0 | 1080 | $1,700 | $1.57 | 45d | 1 | 1.10mi |
| 227 Jay St Albany, NY | 2.0 | 2.0 | 1710 | $2,150 | $1.26 | 45d | 1 | 1.14mi |
| 88 Willett St Albany, NY | 3.0 | 1.0 | 825 | $2,080 | $2.52 | 16d | 10 | 1.15mi |
| 546 Mercer St Unit 1 Albany, NY | 3.0 | 1.0 | 1400 | $1,800 | $1.29 | 25d | 1 | 1.17mi |
| 32 Peyster St Unit 2nd Albany, NY | 3.0 | 2.0 | 1500 | $2,300 | $1.53 | 45d | 1 | 1.21mi |
Listing history 21 events
-
2026-06-21days on market $135,000 Active 107 DOM
-
2026-06-18days on market $135,000 Active 104 DOM
-
2026-06-17days on market $135,000 Active 103 DOM
-
2026-06-16days on market $135,000 Active 102 DOM
-
2026-06-15days on market $135,000 Active 101 DOM
-
2026-06-14days on market $135,000 Active 99 DOM
-
2026-06-10days on market $135,000 Active 96 DOM
-
2026-06-08days on market $135,000 Active 94 DOM
-
2026-06-07days on market $135,000 Active 93 DOM
-
2026-06-03days on market $135,000 Active 89 DOM
-
2026-06-02days on market $135,000 Active 88 DOM
-
2026-06-01days on market $135,000 Active 87 DOM
-
2026-05-31days on market $135,000 Active 86 DOM
-
2026-05-31days on market $135,000 Active 85 DOM
-
2026-03-06$135,000 Active 709-char remark
Show marketing remark (709 chars)
Great opportunity to own this 3-bedroom, 1-bath home listed at $135,000. Whether you're a first-time buyer looking to stop renting or an investor seeking to expand your portfolio, this property offers strong potential and value. The home features a functional layout, a full basement for additional storage or future possibilities, and important recent updates including a new heating system and new hot water tank, providing peace of mind for the next owner. With solid fundamentals and room to add your own touches, this property is a great option for affordable homeownership or a rental investment. Don't miss the chance to secure a property at an attractive price point with long-term potential.
-
2023-10-27soldstatus $30,000 Closed 184-char remark
Show marketing remark (184 chars)
Attention Investors !! Looking to start or add to your business portfolio this portfolio consists of 75 units this is a single family property CASH ONLY . This is a must see Sold as is
-
2023-09-13status Pending 184-char remark
Show marketing remark (184 chars)
Attention Investors !! Looking to start or add to your business portfolio this portfolio consists of 75 units this is a single family property CASH ONLY . This is a must see Sold as is
-
2023-08-28$30,000 Active 184-char remark
Show marketing remark (184 chars)
Attention Investors !! Looking to start or add to your business portfolio this portfolio consists of 75 units this is a single family property CASH ONLY . This is a must see Sold as is
-
2019-12-06historical
-
2019-11-12$29,000 New
-
2004-01-20soldstatus $13,000
ⓘ Source: listings_history table (triggers on properties + properties_extension) + one-shot
backfill from property_details.listing_events for pre-trigger history.
Tax reassessment forecast NY · Partial reset (capped growth)
- Current annual tax
- $633 · $53/mo
- Projected year-2 tax
- $1,457 · $121/mo
- Expected delta
- +$824/yr (+$69/mo · 130.2%)
ⓘ Screening estimate from a state-policy table — verify with the county assessor before closing.
Climate risk First Street
- Flood 1/10 Low FEMA zone X (unshaded) · 0% chance over 30 yrs
- Wildfire 1/10 Low
- Heat 4/10 Moderate 7 d/yr ≥97°F today · 16 d/yr by 30 yrs out
- Wind 3/10 Moderate 6% chance of damaging wind over 30 yrs
- Air quality 1/10 Low 0 unhealthy d/yr today · 0 by 30 yrs out
Nearby sold comps map
Loading sold comps map…
Walkable amenities ~0.75 mi
Loading nearby amenities…
Taxation est. · year 1
- Rental income
- $23,042
- − Mortgage interest
- −$7,562
- − Property taxes
- −$633
- − Insurance
- −$675
- − Repairs & maintenance
- −$1,843
- − Management
- −$1,843
- − Depreciation
- −$3,927
- Taxable income
- $6,558
- Est. tax owed @ 24.0%
- −$1,574
- After-tax cash flow
- $6,826/yr
For passive investors: Depreciation is non-cash, so a rental often shows a tax loss while cash-flowing — sheltering income. Rental losses are passive: they offset passive income freely, and up to $25,000/yr can offset ordinary (W-2) income if you actively participate and your MAGI is under $100k (phasing out to $0 by $150k); unused losses carry forward. On sale, claimed depreciation is recaptured at up to 25%, and gains may owe capital-gains tax (a 1031 exchange can defer both). Figures are a year-1 estimate at your 24.0% rate — not tax advice; consult a CPA.
Schools (NCES district)
- District
- Albany City School District
- NCES district ID
- 3602460
- Math proficiency
- 37% ▲ 6.00%
- Reading proficiency
- 40% ▲ 7.00%
- Median HH income
- $40,568
- Composite
- 32.34/100
- National rank
- #5744
- State rank
- #543 of 590 in NY
Livability — Albany
- Score
- 79/100
- State rank
- #129
- US rank
- #2083
Category grades
Schools grade is shown separately in the Schools card above.
Census & demographics
- Census place
- Albany, NY
- County
- Albany County · 196,626 people
- City population
- 116,921
- Metro
- Albany-Schenectady-Troy, NY
- Population (ZIP)
- 14,572
- Household income
- $41,548
- Rent vs Own
- Severe rent burden
- 2035.0
Population outlook (Albany County) Hauer SSP2
- Today (2025)
- 320,794 people
- By 2030
- 327,401 · +2.1%
- By 2040
- 338,218 · +5.4%
- By 2050
- 348,467 · +8.6%
- By 2075
- 381,693 · +19.0%
- By 2100
- 393,809 · +22.8%
Race, ethnicity, and origin ACS 2023
- Neighborhood character
- Highly diverse neighborhood (Simpson 0.75)
- Race & ethnicity
- Black 38% White 27% Hispanic / Latino 15% Two or more races 12% Asian 10%
- Hispanic origin (detail)
- Puerto Rican 10% Dominican 1%
- Common ancestry
- Italian 2% Lithuanian 2% Romanian 1%
- Foreign-born
- 22% · Canada, China
- Languages at home
- 75% English-only · Spanish 10% Other Indo-European 5% Chinese 3%
Political lean MEDSL · Albany
- 2024 margin
- Strong D (+25.8) · D 62.9% · R 37.1%
- 2008→2024 swing
- -3.6pp toward R · 2008: 29.4pp · 2024: 25.8pp
- All cycles
- 2024: D+25.8 2020: D+31.4 2016: D+24.3 2012: D+31.0 2008: D+29.4
Not yet ingested
- Civics
- —
Market trends
- HPI YoY
- ▼ -30.24%
- Current HPI
- 275.8109
- Rent YoY
- ▲ 5.37%
- Metro
- Albany-Schenectady-Troy, NY
- State GDP YoY
- ▲ 2.60%
- F500 in state
- 92
Industry mix (Fortune 500 HQ in NY)
| Industry | F500 HQs | Revenue |
|---|---|---|
| Financial Services | 10 | $950B |
|
||
| Consumer Goods | 9 | $162B |
|
||
| Insurance | 4 | $225B |
|
||
| Telecommunications | 2 | $144B |
|
||
| Pharmaceuticals | 2 | $112B |
|
||
| Media / Entertainment | 2 | $69B |
|
||
Price history
+938.5% since first listed7 events — show timeline
- 2026-03-06 Listed $135,000 Global MLS
- 2023-10-27 Sold (MLS) $30,000 Global MLS
- 2023-09-13 Pending — Global MLS
- 2023-08-28 Listed $30,000 Global MLS
- 2019-12-06 Listing Removed — Global MLS
- 2019-11-12 Listed $29,000 Global MLS
- 2004-01-20 Sold (Public Records) $13,000 Public Records
Property tax history
-1.1%/yrLatest (2025): $633 · -0.8% YoY. Source: county tax records.
Cash-flow waterfall
monthlySold comps — $/sqft
last 12 mo · ≤1 miLoading sold comps…