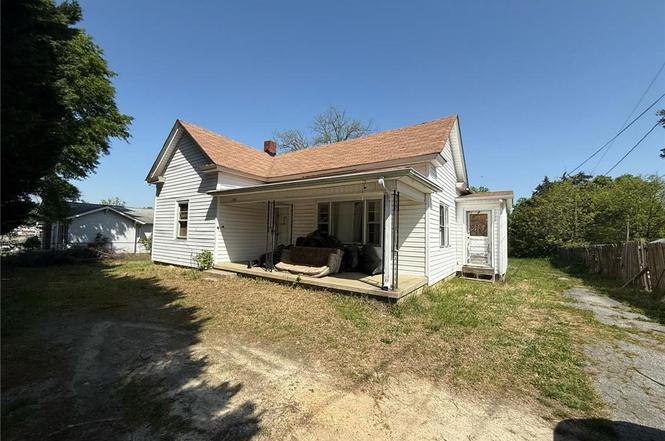
2912 W English Rd · High Point, NC
Flood risk 1/10 · Minimal
- FEMA flood zone
- X (unshaded)
- Chance of flooding over 30 yrs
- 0.0%
- Est. flood insurance / yr
- $507 – $1,088
Fire risk 1/10 · Minimal
- Est. fire insurance / yr
- $906 – $1,684
Heat risk 5/10 · Moderate
- Hot days now (above 103°F)
- 7 days/yr
- Hot days in 30 yrs
- 17 days/yr
Wind risk 4/10 · Minor
- Chance of severe wind over 30 yrs
- 13.0%
Air-quality risk 2/10 · Minimal
- Unhealthy air days now
- 1 days/yr
- Unhealthy air days in 30 yrs
- 1 days/yr
Risk factors via First Street. Map © Google.
Why this score? — see what drove the B grade
The composite is a weighted blend of 9 inputs, each scored 0–100. Each bar is that input's sub-score; the figure is the points it added to the 100-point composite (weight × sub-score).
- Cash flow +30.0/30.0
- 1% rule +10.0/10.0
- DSCR +10.0/10.0
- ARV discount +7.5/15.0
- Livability +3.9/5.0
- Schools +3.6/10.0
- Rent growth +2.7/5.0
- Condition / age +2.5/5.0
- Appreciation +0.0/10.0
$77,500
🖨 Deal sheet (PDF) 📄 Offer letter ✓ Due diligence
Listing remarks MLS
Great opportunity to own this 3 bedroom 1 bathroom single family home. This property built in 1906 features approximately 1,491 square feet of living space. Bring your ideas and design and see how you can transform this place into just what you’ve been looking for.
Key facts
- Includes a shed
- 0.37 acre lot
- Built 1906
Tags
Neighborhood map
What this means for you Summary
Snapshot
- This is a 3-bed/1.0-bath single-family listed at $78k.
Deal economics
- At list price, monthly cash flow is $505 ($6k/yr) — positive.
- The deal already cash-flows at list — no discount required.
- Meets the 1% rule at list price ($1k rent vs $78k).
- Cap rate 14.1% vs local median 4.0% in High Point — top-decile yield for the area; either an underpriced asset or a hidden risk that comps aren't pricing in. Stress-test before assuming the spread holds.
Location & tenants
- Location reads 77/100 on livability (#31 in NC, #3,084 nationally) — a middle-class / working-renter tenant base. Strengths: commute A+, cost of living A+, housing A+; Watch: amenities D, employment D, crime F.
- Guilford County Schools (urban): math 39% / reading 45% proficiency, ranked #99 of 178 in NC (top 56%) — families likely to look elsewhere, expect single-tenant / working-renter base with shorter leases.
- Zoned schools: Guilford Elementary (math 32% / reading 28%, grade F, #965 of 1,410 statewide, top 69%, 611 students, 100% FRL); Western Guilford Middle (math 23% / reading 38%, grade F, #331 of 475 statewide, top 70%, 732 students, 100% FRL); High Point Central High (math 48% / reading 42%, grade D-, #350 of 535 statewide, top 66%, 1,081 students, 100% FRL) — zoned schools average 100% FRL vs 52% district-wide (47 pts higher); higher-poverty schools than district average — tighter screening recommended.
- Market conditions: Rents flat; 124 active listings in the ZIP; 3 comparable units currently listed for rent nearby; rentals at typical pace (median 26d on market — plan ~3-4 weeks tenant-placement turnaround); 3,843 units permitted in Guilford County in 2024 (2,397 in 5+ unit buildings).
Forward outlook
- Local home prices are declining (-3.0%/yr); year-one equity from $536 of loan paydown is wiped out by about $2k of value loss. Plan a longer hold.
- Guilford County population projected at +26% by 2050 — long-run rental-demand tailwind backs the buy-and-hold thesis.
- At projected returns (-3.0% appreciation + 0.9% rent growth), your $22k cash investment doubles in ~5 years — after that, you're playing with house money.
Negotiation context
- Only 7 days on market — expect competitive offers; lowballing is unlikely to land.
- 2 sale attempts since 8y ago with the ask held roughly flat each time — persistent listings suggest the price (not the market) is what's stuck; bring a comps-based counter.
- Current owner paid $42k; list at $78k implies a 87% gain — meaningful room to come down on a strong offer.
Risks & watch-outs
- Watch-outs: built in 1906 — expect roof / HVAC / electrical / plumbing capex.
- Climate carrying-cost: extreme-heat days projected 7→17/yr by 2055 (HVAC capex compounding) — expect insurance premiums to compound above CPI over the hold.
Questions for the listing agent
- Built in 1906 — when were the roof, HVAC, electrical panel, plumbing, and water heater last replaced?
- Is there a deadline driving the sale (1031 exchange, divorce, estate, relocation)? That informs how much negotiation room exists.
- Schools are D-rated, which usually means shorter tenancies and higher turnover. Who's the typical renter profile here, and what's been the actual vacancy rate?
- Crime grade is F in this area — have there been break-ins, vandalism, or insurance claims at this property in the last 3 years? What carrier currently insures it and at what premium?
- What's the average days-on-market for RENTAL listings here right now (not sales)? A rising rental-DOM trend means longer vacancies and softer asking-rent achievability than the comps imply.
- What's the recent tenant-quality profile in this submarket — average credit score on applications, eviction rate, late-payment / NSF rate, and stable-employment percentage? A property-management company in the area should have these aggregated.
- How much new for-sale + rental construction is in the pipeline within 1–3 miles? Heavy new supply typically softens prices + rents 12–24 months out; constrained supply supports both.
Investment metrics
- 1% rule
- 1.71% ✓
- Cap rate
- 14.11%
- Cash-on-cash
- 27.93%
- DSCR
- 2.24
- GRM
- 4.9
CMA / ARV
- ARV (on-the-fly)
- $229,614
- Comps found
- 5
Show comp detail 5 sales within ~0.75 mi
| Address | Dist | Beds/Ba | Sqft | Sold | Price | $/sf | Match |
|---|---|---|---|---|---|---|---|
| 103 Princeton Ave | 0.10mi | 2/2.0 (-1) | 1,462 (-2%) | 1mo | $70,000 | $48 | 82 |
| 2611 Carsten Ave | 0.21mi | 3/2.5 | 1,382 (-7%) | 7mo | $212,500 | $154 | 66 |
| 212 Cecil St | 0.43mi | 2/1.0 (-1) | 1,427 (-4%) | 11mo | $240,000 | $168 | 59 |
| 1407 Burton Rd | 0.64mi | 2/1.5 (-1) | 1,400 (-6%) | 18mo | $226,000 | $161 | 39 |
| 1137 Hawick Dr | 0.71mi | 3/2.0 | 1,691 (+13%) | 24mo | $230,000 | $136 | 21 |
Match score weights: distance 35% · size 25% · config 20% · recency 20%. Top-matched comps best support the ARV.
Projected returns pro-forma
-3.0% appreciation · 0.9% rent growth · sell at horizon
- IRR
- 19.7%
- Equity multiple
- 1.78×
- Total profit
- $16,886
- Equity at exit
- $11,556
- IRR
- 26.5%
- Equity multiple
- 3.09×
- Total profit
- $45,422
- Equity at exit
- $6,701
Cash invested: $21,700 (down + closing). Projections, not guarantees.
Landlord ↔ Tenant lean methodology
- Overall (STATE)
- 85 Strongly Landlord-Friendly
- State North Carolina
- 85 Strongly Landlord-Friendly · R+3
- County
- — inherits STATE
- City
- — inherits STATE
ZIP-level market 27262
- Rents YoY
- 0.9%
- Active inventory
- 124
- Price-to-rent
- 4.9×
Monthly cashflow live
- Estimated rent
- $1,326 medium interval (Pro) →
- Mortgage (P&I)
- −$406
- Tax from tax record
- −$104 /mo · $1,248/yr
- Insurance
- −$32
- HOA
- −$0
- Lot rent
- −$0
- Vacancy / Maint / Mgmt
- −$279
- Net cashflow
- $505
Break-even live
Sensitivity live
| Price | -10% $549 | -5% $527 | +0% $505 | +5% $483 | +10% $461 |
|---|---|---|---|---|---|
| Rent | -10% $400 | -5% $453 | +0% $505 | +5% $557 | +10% $610 |
| Rate | -1.0pp $544 | -0.5pp $525 | base $505 | +0.5pp $485 | +1.0pp $465 |
UW: 25.0% down · 7.5% · 30yr · 1.5% tax · 5.0% vac · 8.0% maint · 8.0% mgmt
Financing live
Cash to close
- Down payment
- $19,375
- Closing costs
- $2,325
- Reserves months
- —
- Total cash needed
- —
Loan-product check · same deal, 3 products live
Conventional
25% down · 7.5% · 30yr
- Down + closing
- —
- Monthly P&I
- —
- Monthly cashflow
- —
- DSCR
- —
- Eligible?
- —
Personal DTI + credit; lowest rate.
DSCR
20% down · 8.5% · 30yr
- Down + closing
- —
- Monthly P&I
- —
- Monthly cashflow
- —
- DSCR
- —
- Eligible?
- —
No personal income docs; deal must DSCR.
Hard money
10% down · 12.0% · 12mo
- Down + closing
- —
- Monthly P&I
- —
- Monthly cashflow
- —
- DSCR
- —
- Eligible?
- —
Short-term bridge; refi at stabilization.
Rent comps 3 comps
| Address | Beds | Baths | Sqft | Rent | $/sqft | DOM | Units | Dist |
|---|---|---|---|---|---|---|---|---|
| 201 Dorothy St High Point, NC | 2.0 | 1.5 | 884 | $999 | $1.13 | 26d | 1 | 0.19mi |
| 1001 Burton Ave High Point, NC | 3.0 | 1.0 | 1109 | $1,400 | $1.26 | 24d | 1 | 0.55mi |
| 2004 Edgewood Dr High Point, NC | 3.0 | 1.0 | 962 | $1,350 | $1.40 | 26d | 1 | 1.05mi |
Listing history 15 events
-
2025-05-21status Pending
-
2025-05-14$77,500 Active
-
2018-07-12soldstatus $41,500 Sold 274-char remark
Show marketing remark (274 chars)
Great opportunity to own this 3 bedroom 1 bathroom single family home. This property built in 1906 features approximately 1,491 square feet of living space. Bring your ideas and design and see how you can transform this place into just what you’ve been looking for.
-
2018-07-10soldstatus $41,500
-
2018-06-23status Pending 274-char remark
Show marketing remark (274 chars)
Great opportunity to own this 3 bedroom 1 bathroom single family home. This property built in 1906 features approximately 1,491 square feet of living space. Bring your ideas and design and see how you can transform this place into just what you’ve been looking for.
-
2018-05-30price $49,100 274-char remark
Show marketing remark (274 chars)
Great opportunity to own this 3 bedroom 1 bathroom single family home. This property built in 1906 features approximately 1,491 square feet of living space. Bring your ideas and design and see how you can transform this place into just what you’ve been looking for.
-
2018-05-18price $50,700 274-char remark
Show marketing remark (274 chars)
Great opportunity to own this 3 bedroom 1 bathroom single family home. This property built in 1906 features approximately 1,491 square feet of living space. Bring your ideas and design and see how you can transform this place into just what you’ve been looking for.
-
2018-04-30price $52,000 274-char remark
Show marketing remark (274 chars)
Great opportunity to own this 3 bedroom 1 bathroom single family home. This property built in 1906 features approximately 1,491 square feet of living space. Bring your ideas and design and see how you can transform this place into just what you’ve been looking for.
-
2018-04-12price $53,200 274-char remark
Show marketing remark (274 chars)
Great opportunity to own this 3 bedroom 1 bathroom single family home. This property built in 1906 features approximately 1,491 square feet of living space. Bring your ideas and design and see how you can transform this place into just what you’ve been looking for.
-
2018-03-26price $54,100 274-char remark
Show marketing remark (274 chars)
Great opportunity to own this 3 bedroom 1 bathroom single family home. This property built in 1906 features approximately 1,491 square feet of living space. Bring your ideas and design and see how you can transform this place into just what you’ve been looking for.
-
2018-03-14price $56,600 274-char remark
Show marketing remark (274 chars)
Great opportunity to own this 3 bedroom 1 bathroom single family home. This property built in 1906 features approximately 1,491 square feet of living space. Bring your ideas and design and see how you can transform this place into just what you’ve been looking for.
-
2018-02-13$58,000 Active 274-char remark
Show marketing remark (274 chars)
Great opportunity to own this 3 bedroom 1 bathroom single family home. This property built in 1906 features approximately 1,491 square feet of living space. Bring your ideas and design and see how you can transform this place into just what you’ve been looking for.
-
2017-12-05soldstatus $80,631
-
1999-08-02soldstatus $74,000
-
1999-08-02soldstatus $74,000
ⓘ Source: listings_history table (triggers on properties + properties_extension) + one-shot
backfill from property_details.listing_events for pre-trigger history.
Tax reassessment forecast NC · Resets to sale price
- Current annual tax
- $1,248 · $104/mo
- Projected year-2 tax
- $1,248 · $104/mo
- Expected delta
- $0/yr ($0/mo · -0.0%)
ⓘ Screening estimate from a state-policy table — verify with the county assessor before closing.
Climate risk First Street
- Flood 1/10 Low FEMA zone X (unshaded) · 0% chance over 30 yrs
- Wildfire 1/10 Low
- Heat 5/10 Major 7 d/yr ≥103°F today · 17 d/yr by 30 yrs out
- Wind 4/10 Moderate 13% chance of damaging wind over 30 yrs
- Air quality 2/10 Low 1 unhealthy d/yr today · 1 by 30 yrs out
Nearby sold comps map
Loading sold comps map…
Walkable amenities ~0.75 mi
Loading nearby amenities…
Taxation est. · year 1
- Rental income
- $15,915
- − Mortgage interest
- −$4,341
- − Property taxes
- −$1,248
- − Insurance
- −$388
- − Repairs & maintenance
- −$1,273
- − Management
- −$1,273
- − Depreciation
- −$2,255
- Taxable income
- $5,137
- Est. tax owed @ 24.0%
- −$1,233
- After-tax cash flow
- $4,827/yr
For passive investors: Depreciation is non-cash, so a rental often shows a tax loss while cash-flowing — sheltering income. Rental losses are passive: they offset passive income freely, and up to $25,000/yr can offset ordinary (W-2) income if you actively participate and your MAGI is under $100k (phasing out to $0 by $150k); unused losses carry forward. On sale, claimed depreciation is recaptured at up to 25%, and gains may owe capital-gains tax (a 1031 exchange can defer both). Figures are a year-1 estimate at your 24.0% rate — not tax advice; consult a CPA.
Schools (NCES district)
- District
- Guilford County Schools
- NCES district ID
- 3701920
- Math proficiency
- 39% ▲ 1.00%
- Reading proficiency
- 45% ▲ 1.00%
- Median HH income
- $46,315
- Composite
- 35.78/100
- National rank
- #4842
- State rank
- #99 of 178 in NC
Livability — High Point
- Score
- 77/100
- State rank
- #31
- US rank
- #3084
Category grades
Schools grade is shown separately in the Schools card above.
Census & demographics
- Census place
- High Point, NC
- County
- Guilford County · 487,190 people
- City population
- 102,450
- Metro
- Greensboro-High Point, NC
- Population (ZIP)
- 28,353
- Household income
- $65,006
- Rent vs Own
- Severe rent burden
- 1046.0
Population outlook (Guilford County) Hauer SSP2
- Today (2025)
- 584,596 people
- By 2030
- 616,851 · +5.5%
- By 2040
- 678,451 · +16.1%
- By 2050
- 734,788 · +25.7%
- By 2075
- 862,985 · +47.6%
- By 2100
- 948,704 · +62.3%
Race, ethnicity, and origin ACS 2023
- Neighborhood character
- Diverse neighborhood (Simpson 0.65)
- Race & ethnicity
- White 50% Black 30% Hispanic / Latino 12% Two or more races 7% Asian 4%
- Hispanic origin (detail)
- Mexican 8% Puerto Rican 1%
- Common ancestry
- Slovak 4% Italian 2% Lithuanian 1%
- Foreign-born
- 14% · Canada
- Languages at home
- 80% English-only · Spanish 10% Other Indo-European 5% Other Asian/Pacific 1%
Political lean MEDSL · Guilford
- 2024 margin
- Strong D (+21.8) · D 60.2% · R 38.4% · Other 1.4%
- 2008→2024 swing
- +3.5pp toward D · 2008: 18.4pp · 2024: 21.8pp
- All cycles
- 2024: D+21.8 2020: D+23.1 2016: D+20.0 2012: D+16.5 2008: D+18.4
Not yet ingested
- Civics
- —
Market trends
- HPI YoY
- ▼ -279.14%
- Current HPI
- 205.6152
- Rent YoY
- ▲ 0.90%
- Metro
- Greensboro-High Point, NC
- State GDP YoY
- ▲ 3.28%
- F500 in state
- 26
Industry mix (Fortune 500 HQ in NC)
| Industry | F500 HQs | Revenue |
|---|---|---|
| Financial Services | 2 | $213B |
|
||
| Retail | 2 | $95B |
|
||
| Industrial Conglomerate | 1 | $38B |
|
||
| Metals / Steel | 1 | $35B |
|
||
| Utilities | 1 | $30B |
|
||
| Industrial Machinery | 1 | $19B |
|
||
Price history
+4.7% since first listed15 events — show timeline
- 2025-05-21 Pending — Triad MLS
- 2025-05-14 Listed $77,500 Triad MLS
- 2018-07-12 Sold (MLS) $41,500 Triad MLS
- 2018-07-10 Sold (Public Records) $41,500 Public Records
- 2018-06-23 Pending — Triad MLS
- 2018-05-30 Price Changed $49,100 Triad MLS
- 2018-05-18 Price Changed $50,700 Triad MLS
- 2018-04-30 Price Changed $52,000 Triad MLS
- 2018-04-12 Price Changed $53,200 Triad MLS
- 2018-03-26 Price Changed $54,100 Triad MLS
- 2018-03-14 Price Changed $56,600 Triad MLS
- 2018-02-13 Listed $58,000 Triad MLS
- 2017-12-05 Sold (Public Records) $80,631 Public Records
- 1999-08-02 Sold (Public Records) $74,000 Public Records
- 1999-08-02 Sold (Public Records) $74,000 Public Records
Property tax history
+0.7%/yrLatest (2025): $1,248 · +113.1% YoY. Source: county tax records.
Cash-flow waterfall
monthlySold comps — $/sqft
last 12 mo · ≤1 miLoading sold comps…