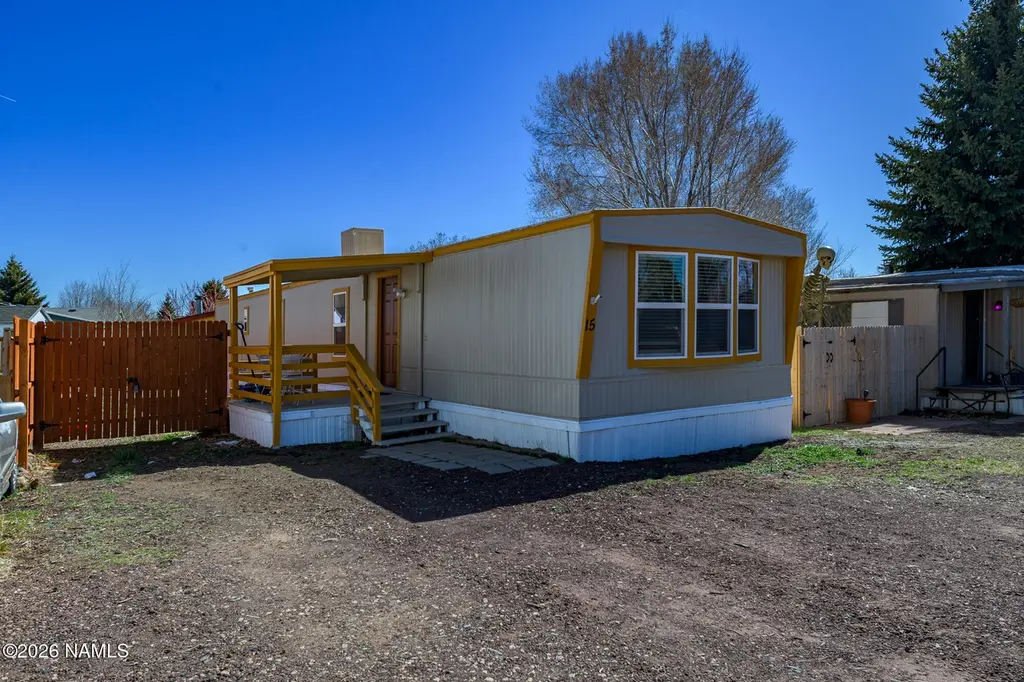
5250 Us-89 #15 · Flagstaff, AZ
Flood risk 1/10 · Minimal
- FEMA flood zone
- X (unshaded)
- Chance of flooding over 30 yrs
- 0.0%
- Est. flood insurance / yr
- $507 – $1,088
Fire risk 8/10 · Major
- Est. fire insurance / yr
- $610 – $1,132
Heat risk 2/10 · Minimal
- Hot days now (above 88°F)
- 6 days/yr
- Hot days in 30 yrs
- 15 days/yr
Wind risk 1/10 · Minimal
- Chance of severe wind over 30 yrs
- —
Air-quality risk 1/10 · Minimal
- Unhealthy air days now
- 0 days/yr
- Unhealthy air days in 30 yrs
- 0 days/yr
Risk factors via First Street. Map © Google.
Why this score? — see what drove the B- grade
The composite is a weighted blend of 9 inputs, each scored 0–100. Each bar is that input's sub-score; the figure is the points it added to the 100-point composite (weight × sub-score).
- Cash flow +30.0/30.0
- 1% rule +10.0/10.0
- DSCR +10.0/10.0
- ARV discount +7.5/15.0
- Condition / age +4.0/5.0
- Livability +3.1/5.0
- Rent growth +2.9/5.0
- Schools +2.1/10.0
- Appreciation +0.0/10.0
$95,000
🖨 Deal sheet (PDF) 📄 Offer letter ✓ Due diligence
Listing remarks MLS
Fully updated and ready for its next owner, this inviting manufactured home has been refreshed throughout. The interior features a newly remodeled kitchen with updated cabinetry, sink, stove, and refrigerator, creating a bright and functional space. New vinyl flooring and carpet run throughout the home, complemented by fresh interior and exterior paint. The bathroom has also been improved with a new vanity and toilet. Outside, a newly installed fence provides added privacy and a clean, finished look. This home offers a comfortable, move in ready space with modern touches throughout. Near Flagstaff shopping centers, restaurants, and other local amenities, this property offers a practical option for those looking for a low maintenance place to call home.
Key facts
- Updated cabinetry
- New vinyl flooring
- Built 1982
Tags
Neighborhood map
What this means for you Summary
Snapshot
- This is a 2-bed/1.0-bath manufactured listed at $95k. Condition is rated good.
Deal economics
- At list price, monthly cash flow is $1k ($13k/yr) — positive.
- The deal already cash-flows at list — no discount required.
- Meets the 1% rule at list price ($2k rent vs $95k).
- Recommended offer: $86k (9.0% below list) — sets the bar for market timing.
- Cap rate 20.4% vs local median 2.1% in Flagstaff — top-decile yield for the area; either an underpriced asset or a hidden risk that comps aren't pricing in. Stress-test before assuming the spread holds.
Location & tenants
- Location reads 61/100 on livability (#167 in AZ) — a middle-class / working-renter tenant base. Strengths: housing B; Watch: employment C-, crime D-, amenities F.
- Flagstaff Unified District (4192) (urban): math 18% / reading 29% proficiency, ranked #158 of 249 in AZ (top 64%) — low school quality limits family demand, transient renter base, plan for 1-2y turnover.
- Zoned schools: Weitzel'S Puente De Hozho Bilingual Magnet School (math 27% / reading 37%, grade F, #505 of 1,109 statewide, top 47%, 438 students, 42% FRL); Sinagua Middle School (math 12% / reading 22%, grade F, #147 of 218 statewide, top 69%, 1,016 students, 40% FRL); Coconino High School (math 12% / reading 17%, grade F, #267 of 381 statewide, top 72%, 1,528 students, 33% FRL) — zoned schools at 38% FRL track the district average.
- Market conditions: Rents rising (+1.6%/yr); 311 active listings in the ZIP; 7 comparable units currently listed for rent nearby; rentals lingering (median 45d on market — plan ~5-8 weeks vacancy on turnover, expect pricing pressure); 100% of comp listings sitting > 30 days — soft ceiling on asking rent; solid renter incomes; 698 units permitted in Coconino County in 2024 (354 in 5+ unit buildings).
- This rent runs 33% of the median local income ($81k/yr) — at the standard rent-burdened threshold; future hikes will face affordability resistance.
Forward outlook
- Local home prices are declining (-3.0%/yr); year-one equity from $657 of loan paydown is wiped out by about $3k of value loss. Plan a longer hold.
- Coconino County population projected at +20% by 2050 — long-run rental-demand tailwind backs the buy-and-hold thesis.
- At projected returns (-3.0% appreciation + 1.6% rent growth), your $27k cash investment doubles in ~3 years — after that, you're playing with house money.
Negotiation context
- It's been on market 98 days — a 9% lower offer ($86k) is reasonable based on typical stale-listing flexibility.
- 2 sale attempts; this cycle's ask has dropped $20k (17%) from the opening price — seller is motivated, your offer sets the floor, not the list.
Risks & watch-outs
- Climate carrying-cost: severe wildfire risk — expect insurance premiums to compound above CPI over the hold.
Questions for the listing agent
- It's been on market 98 days. Have you received any prior offers? Is the seller open to a 9% concession, seller financing, or rate buy-down credit?
- Why hasn't it sold? Are there any deal-killer items the seller is aware of (foundation, flood, title, zoning, code violations)?
- Is there a deadline driving the sale (1031 exchange, divorce, estate, relocation)? That informs how much negotiation room exists.
- Crime grade is D in this area — have there been break-ins, vandalism, or insurance claims at this property in the last 3 years? What carrier currently insures it and at what premium?
- What's the average days-on-market for RENTAL listings here right now (not sales)? A rising rental-DOM trend means longer vacancies and softer asking-rent achievability than the comps imply.
- What's the recent tenant-quality profile in this submarket — average credit score on applications, eviction rate, late-payment / NSF rate, and stable-employment percentage? A property-management company in the area should have these aggregated.
- How much new for-sale + rental construction is in the pipeline within 1–3 miles? Heavy new supply typically softens prices + rents 12–24 months out; constrained supply supports both.
Investment metrics
- 1% rule
- 2.36% ✓
- Cap rate
- 20.39%
- Cash-on-cash
- 50.35%
- DSCR
- 3.24
- GRM
- 3.5
CMA / ARV
- ARV (median comp)
- $256,000
- List price
- $95,000
- Delta
- -62.89%
- Verdict
- UNDERPRICED
- Comps
- 8 within 1.0 mi
Show comp detail 5 sales within ~0.75 mi
| Address | Dist | Beds/Ba | Sqft | Sold | Price | $/sf | Match |
|---|---|---|---|---|---|---|---|
| 4940 E Dean Ave | 0.26mi | 2/1.0 | 912 (-1%) | 13mo | $135,000 | $148 | 75 |
| 5600 N Dakota #17 St #17 | 0.23mi | 3/2.0 (+1) | 960 (+4%) | 2mo | $106,500 | $111 | 72 |
| 4834 E Merriam Dr | 0.06mi | 3/2.0 (+1) | 972 (+5%) | 17mo | $373,000 | $384 | 65 |
| 4975 E Dean Ave | 0.27mi | 3/2.0 (+1) | 1,040 (+13%) | 11mo | $120,000 | $115 | 48 |
| 6061 N Snowflake Dr | 0.61mi | 3/2.0 (+1) | 1,061 (+15%) | 4mo | $262,000 | $247 | 35 |
Match score weights: distance 35% · size 25% · config 20% · recency 20%. Top-matched comps best support the ARV.
Projected returns pro-forma
-3.0% appreciation · 1.59% rent growth · sell at horizon
- IRR
- 46.5%
- Equity multiple
- 2.98×
- Total profit
- $52,590
- Equity at exit
- $14,165
- IRR
- 51.6%
- Equity multiple
- 5.70×
- Total profit
- $124,949
- Equity at exit
- $8,214
Cash invested: $26,600 (down + closing). Projections, not guarantees.
Landlord ↔ Tenant lean methodology
- Overall (STATE)
- 87 Strongly Landlord-Friendly
- State Arizona
- 87 Strongly Landlord-Friendly · R+3
- County
- — inherits STATE
- City
- — inherits STATE
ZIP-level market 86004
- Rents YoY
- 1.6%
- Active inventory
- 311
- Price-to-rent
- 3.5×
Monthly cashflow live
- Estimated rent
- $2,244 high interval (Pro) →
- Mortgage (P&I)
- −$498
- Tax est. 1.5%
- −$119 /mo · $1,425/yr
- Insurance
- −$40
- HOA
- −$0
- Vacancy / Maint / Mgmt
- −$471
- Net cashflow
- $1,116
Break-even live
Sensitivity live
| Price | -10% $1,182 | -5% $1,149 | +0% $1,116 | +5% $1,083 | +10% $1,051 |
|---|---|---|---|---|---|
| Rent | -10% $939 | -5% $1,028 | +0% $1,116 | +5% $1,205 | +10% $1,293 |
| Rate | -1.0pp $1,164 | -0.5pp $1,140 | base $1,116 | +0.5pp $1,092 | +1.0pp $1,067 |
UW: 25.0% down · 7.5% · 30yr · 1.5% tax · 5.0% vac · 8.0% maint · 8.0% mgmt
Financing live
Cash to close
- Down payment
- $23,750
- Closing costs
- $2,850
- Reserves months
- —
- Total cash needed
- —
Loan-product check · same deal, 3 products live
Conventional
25% down · 7.5% · 30yr
- Down + closing
- —
- Monthly P&I
- —
- Monthly cashflow
- —
- DSCR
- —
- Eligible?
- —
Personal DTI + credit; lowest rate.
DSCR
20% down · 8.5% · 30yr
- Down + closing
- —
- Monthly P&I
- —
- Monthly cashflow
- —
- DSCR
- —
- Eligible?
- —
No personal income docs; deal must DSCR.
Hard money
10% down · 12.0% · 12mo
- Down + closing
- —
- Monthly P&I
- —
- Monthly cashflow
- —
- DSCR
- —
- Eligible?
- —
Short-term bridge; refi at stabilization.
Rent comps 7 comps
| Address | Beds | Baths | Sqft | Rent | $/sqft | DOM | Units | Dist |
|---|---|---|---|---|---|---|---|---|
| 5000 N Mall Way Flagstaff, AZ | 1.0–2.0 | 1.0–2.0 | 880 | $2,299 | $2.61 | 45d | 7 | 0.18mi |
| 5404 E Cortland Blvd Flagstaff, AZ | 1.0–2.0 | 1.0–2.0 | 763 | $2,240 | $2.94 | 45d | 1 | 0.91mi |
| 5250 E Cortland Blvd Flagstaff, AZ | 1.0–2.0 | 1.0–2.0 | 731 | $2,160 | $2.95 | 45d | 1 | 1.01mi |
| 5303 E Cortland Blvd Flagstaff, AZ | 1.0–2.0 | 1.0–2.0 | 763 | $2,520 | $3.30 | 45d | 1 | 1.05mi |
| 5205 E Cortland Blvd Flagstaff, AZ | 1.0–2.0 | 1.0–1.5 | 712 | $2,162 | $3.03 | 45d | 16 | 1.19mi |
| 4343 E Soliere Ave Flagstaff, AZ | 1.0–3.0 | 1.0–2.0 | 1000 | $2,362 | $2.36 | 45d | 12 | 1.21mi |
| 4255 E Soliere Ave Flagstaff, AZ | 1.0–3.0 | 1.0–2.0 | 967 | $2,258 | $2.33 | 45d | 24 | 1.49mi |
Listing history 21 events
-
2026-06-19days on market $95,000 Active 98 DOM
-
2026-06-18days on market $95,000 Active 97 DOM
-
2026-06-17days on market $95,000 Active 96 DOM
-
2026-06-16days on market $95,000 Active 95 DOM
-
2026-06-15days on market $95,000 Active 94 DOM
-
2026-06-14days on market $95,000 Active 92 DOM
-
2026-06-13days on market $95,000 Active 91 DOM
-
2026-06-10days on market $95,000 Active 89 DOM
-
2026-06-09days on market $95,000 Active 88 DOM
-
2026-06-08days on market $95,000 Active 87 DOM
-
2026-06-07pricedays on market $95,000 Active 86 DOM
-
2026-06-05days on market $110,000 Active 83 DOM
-
2026-06-03days on market $110,000 Active 82 DOM
-
2026-06-02days on market $110,000 Active 81 DOM
-
2026-06-01days on market $110,000 Active 80 DOM
-
2026-05-31days on market $110,000 Active 79 DOM
-
2026-05-30days on market $110,000 Active 78 DOM
-
2026-04-07price $110,000 762-char remark
Show marketing remark (762 chars)
Fully updated and ready for its next owner, this inviting manufactured home has been refreshed throughout. The interior features a newly remodeled kitchen with updated cabinetry, sink, stove, and refrigerator, creating a bright and functional space. New vinyl flooring and carpet run throughout the home, complemented by fresh interior and exterior paint. The bathroom has also been improved with a new vanity and toilet. Outside, a newly installed fence provides added privacy and a clean, finished look. This home offers a comfortable, move in ready space with modern touches throughout. Near Flagstaff shopping centers, restaurants, and other local amenities, this property offers a practical option for those looking for a low maintenance place to call home.
-
2026-03-02$115,000 Active 762-char remark
Show marketing remark (762 chars)
Fully updated and ready for its next owner, this inviting manufactured home has been refreshed throughout. The interior features a newly remodeled kitchen with updated cabinetry, sink, stove, and refrigerator, creating a bright and functional space. New vinyl flooring and carpet run throughout the home, complemented by fresh interior and exterior paint. The bathroom has also been improved with a new vanity and toilet. Outside, a newly installed fence provides added privacy and a clean, finished look. This home offers a comfortable, move in ready space with modern touches throughout. Near Flagstaff shopping centers, restaurants, and other local amenities, this property offers a practical option for those looking for a low maintenance place to call home.
-
2026-02-04historical
-
2025-11-03$130,000 Active
ⓘ Source: listings_history table (triggers on properties + properties_extension) + one-shot
backfill from property_details.listing_events for pre-trigger history.
Climate risk First Street
- Flood 1/10 Low FEMA zone X (unshaded) · 0% chance over 30 yrs
- Wildfire 8/10 Severe
- Heat 2/10 Low 6 d/yr ≥88°F today · 15 d/yr by 30 yrs out
- Wind 1/10 Low
- Air quality 1/10 Low 0 unhealthy d/yr today · 0 by 30 yrs out
Nearby sold comps map
Loading sold comps map…
Walkable amenities ~0.75 mi
Loading nearby amenities…
Taxation est. · year 1
- Rental income
- $26,927
- − Mortgage interest
- −$5,321
- − Property taxes
- −$1,425
- − Insurance
- −$475
- − Repairs & maintenance
- −$2,154
- − Management
- −$2,154
- − Depreciation
- −$2,764
- Taxable income
- $12,634
- Est. tax owed @ 24.0%
- −$3,032
- After-tax cash flow
- $10,362/yr
For passive investors: Depreciation is non-cash, so a rental often shows a tax loss while cash-flowing — sheltering income. Rental losses are passive: they offset passive income freely, and up to $25,000/yr can offset ordinary (W-2) income if you actively participate and your MAGI is under $100k (phasing out to $0 by $150k); unused losses carry forward. On sale, claimed depreciation is recaptured at up to 25%, and gains may owe capital-gains tax (a 1031 exchange can defer both). Figures are a year-1 estimate at your 24.0% rate — not tax advice; consult a CPA.
Condition & rehab AI · 12 photos
This fully updated and move-in ready manufactured home offers a comfortable living space with modern touches throughout. The property is in good condition with minimal maintenance required.
Value-add opportunities
- Both Painting exterior and interior walls — Fresh paint enhances curb appeal and interior aesthetics
- Both Landscaping and curb appeal improvements — New fence and landscaping improve curb appeal and add value
- Resale Kitchen appliances replacement — Modern appliances improve functionality and attract potential buyers
Renovation cost estimate screening
Value-add ROI direction
- Both Painting exterior and interior walls — Fresh paint enhances curb appeal and interior aesthetics ↑
- Both Landscaping and curb appeal improvements — New fence and landscaping improve curb appeal and add value ↑
- Resale Kitchen appliances replacement — Modern appliances improve functionality and attract potential buyers ↑
ⓘ Cost ranges are severity-bucket heuristics (US national rule-of-thumb). Get contractor quotes + a written scope before underwriting a rehab budget.
Schools (NCES district)
- District
- Flagstaff Unified District (4192)
- NCES district ID
- 0402860
- Math proficiency
- 18% ▼ -16.00%
- Reading proficiency
- 29% ▼ -10.00%
- Median HH income
- $53,510
- Composite
- 21.11/100
- National rank
- #8437
- State rank
- #158 of 249 in AZ
Livability — Flagstaff
- Score
- 61/100
- State rank
- #167
- US rank
- #18308
Category grades
Schools grade is shown separately in the Schools card above.
Census & demographics
- Census place
- Flagstaff, AZ
- County
- Coconino County · 91,667 people
- City population
- 91,667
- Metro
- Flagstaff, AZ
- Population (ZIP)
- 36,394
- Household income
- $81,172
- Rent vs Own
- Severe rent burden
- 1475.0
Population outlook (Coconino County) Hauer SSP2
- Today (2025)
- 150,645 people
- By 2030
- 156,857 · +4.1%
- By 2040
- 168,714 · +12.0%
- By 2050
- 181,082 · +20.2%
- By 2075
- 218,399 · +45.0%
- By 2100
- 238,853 · +58.6%
Race, ethnicity, and origin ACS 2023
- Neighborhood character
- Diverse neighborhood (Simpson 0.61)
- Race & ethnicity
- White 59% Hispanic / Latino 21% Two or more races 13% Native American 12% Asian 1% Black 1%
- Hispanic origin (detail)
- Mexican 15%
- Common ancestry
- Italian 4% Romanian 3% Slovak 2%
- Foreign-born
- 7% · Canada
- Languages at home
- 80% English-only · Spanish 12% German/W. Germanic 1% Other Asian/Pacific 1%
Political lean MEDSL · Coconino
- 2024 margin
- D (+19.9) · D 59.2% · R 39.4% · Other 1.4%
- 2008→2024 swing
- +2.9pp toward D · 2008: 17.0pp · 2024: 19.9pp
- All cycles
- 2024: D+19.9 2020: D+24.1 2016: D+19.4 2012: D+14.9 2008: D+17.0
Not yet ingested
- Civics
- —
Market trends
- HPI YoY
- ▼ -454.67%
- Current HPI
- 411.8577
- Rent YoY
- ▲ 1.59%
- Metro
- Flagstaff, AZ
- State GDP YoY
- ▲ 4.54%
- F500 in state
- 20
Industry mix (Fortune 500 HQ in AZ)
| Industry | F500 HQs | Revenue |
|---|---|---|
| Technology | 2 | $13B |
|
||
| Mining / Metals | 1 | $23B |
|
||
| Environmental Services | 1 | $16B |
|
||
| Metals / Steel | 1 | $14B |
|
||
| Technology Distribution | 1 | $9B |
|
||
| Homebuilding | 1 | $8B |
|
||
Price history
-15.4% since first listed4 events — show timeline
- 2026-04-07 Price Changed $110,000 NAZMLS
- 2026-03-02 Listed $115,000 NAZMLS
- 2026-02-04 Listing Removed — NAZMLS
- 2025-11-03 Listed $130,000 NAZMLS
Cash-flow waterfall
monthlySold comps — $/sqft
last 12 mo · ≤1 miLoading sold comps…