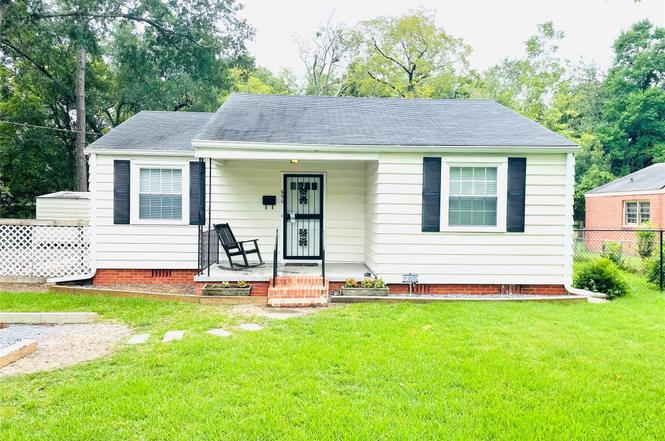
850 Augusta Ave · Montgomery, AL
Flood risk 1/10 · Minimal
- FEMA flood zone
- X (unshaded)
- Chance of flooding over 30 yrs
- 0.0%
- Est. flood insurance / yr
- $507 – $1,088
Fire risk 1/10 · Minimal
- Est. fire insurance / yr
- $916 – $1,700
Heat risk 7/10 · Major
- Hot days now (above 108°F)
- 7 days/yr
- Hot days in 30 yrs
- 20 days/yr
Wind risk 8/10 · Major
- Chance of severe wind over 30 yrs
- 80.0%
Air-quality risk 2/10 · Minimal
- Unhealthy air days now
- 1 days/yr
- Unhealthy air days in 30 yrs
- 1 days/yr
Risk factors via First Street. Map © Google.
Why this score? — see what drove the C grade
The composite is a weighted blend of 9 inputs, each scored 0–100. Each bar is that input's sub-score; the figure is the points it added to the 100-point composite (weight × sub-score).
- Cash flow +25.1/30.0
- DSCR +8.2/10.0
- ARV discount +7.5/15.0
- 1% rule +5.7/10.0
- Livability +3.2/5.0
- Rent growth +2.5/5.0
- Condition / age +2.5/5.0
- Schools +1.7/10.0
- Appreciation +0.0/10.0
$95,000
🖨 Deal sheet 📄 Offer letter ✓ Due diligence
Listing remarks MLS
Snap this up before it's gone! Adorable updated cottage in Cloverdale South is precious inside and out. Living room opens to dining area and large open kitchen. Two spacious bedrooms share a beautifully updated bath. Home sits on a large lot with a big fenced back yard perfect for pets. Detached building out back provides additional storage and would make a great workshop. New HVAC installed in 2020. Updated pluming and electrical. Property has rented for $850/month and would make a great investment property or a perfect starter home for first-time homebuyer. Move-in ready!
Key facts
- Updated electrical
- Fenced back yard
- Detached building
Tags
Property features AI
Finance
- Financial info: Lease expires 2026-09-30
Exterior
- Parking: Driveway; Parking pad (2 pads)
- Utilities: Public water; Public sewer; Cable available; Natural gas available
- Home design: Single-story home; Metal siding; Has home warranty
- Construction: Metal siding construction; Built (year per public records)
- Exterior features: Partial fencing; Covered porch; Porch; Storage; Fence; Mature trees; City lot
Interior
- Kitchen: Dishwasher; Electric cooktop; Electric oven; Refrigerator
- Bedrooms: Bedroom on the first level
- Flooring: Wood flooring
- Bathrooms: 1 full bathroom
- Heating & cooling: Central heating (gas); Central electric cooling
- Interior features: High ceilings; Window treatments; Blinds
- Laundry & utility: Washer; Dryer; Gas water heater
Neighborhood map
What this means for you Summary
Snapshot
- This is a 2-bed/1.0-bath single-family listed at $95k.
Deal economics
- At list price, monthly cash flow is $210 ($3k/yr) — positive.
- The deal already cash-flows at list — no discount required.
- Meets the 1% rule at list price ($1k rent vs $95k).
- Cap rate 8.9% vs local median 6.0% in Montgomery — top-decile yield for the area; either an underpriced asset or a hidden risk that comps aren't pricing in. Stress-test before assuming the spread holds.
Location & tenants
- Location reads 65/100 on livability (#138 in AL) — a middle-class / working-renter tenant base. Strengths: cost of living A+, housing A+; Watch: schools C-, employment D, crime F.
- Montgomery County (urban): math 9% / reading 31% proficiency, ranked #106 of 129 in AL (top 82%) — low school quality limits family demand, transient renter base, plan for 1-2y turnover; 70% free/reduced lunch — lower-income household profile, screen leases tightly.
- Market conditions: 110 active listings in the ZIP; 40 comparable units currently listed for rent nearby; rentals at typical pace (median 21d on market — plan ~3-4 weeks tenant-placement turnaround); 42% of comp listings sitting > 30 days — soft ceiling on asking rent; 460 units permitted in Montgomery County in 2024 (37 in 5+ unit buildings).
Forward outlook
- Local home prices are declining (-3.0%/yr); year-one equity from $657 of loan paydown is wiped out by about $3k of value loss. Plan a longer hold.
- Montgomery County population projected to shrink 8% by 2050 — rents likely to lag national; underwrite the cash flow, not the appreciation.
Negotiation context
- Only 7 days on market — expect competitive offers; lowballing is unlikely to land.
- 4 sale attempts since 24y ago with the ask held roughly flat each time — persistent listings suggest the price (not the market) is what's stuck; bring a comps-based counter.
Risks & watch-outs
- Watch-outs: built in 1950 — expect roof / HVAC / electrical / plumbing capex.
- Climate carrying-cost: severe wind risk, 80% chance of damaging wind over 30y; extreme-heat days projected 7→20/yr by 2055 (HVAC capex compounding) — expect insurance premiums to compound above CPI over the hold.
Questions for the listing agent
- Built in 1950 — when were the roof, HVAC, electrical panel, plumbing, and water heater last replaced?
- Is there a deadline driving the sale (1031 exchange, divorce, estate, relocation)? That informs how much negotiation room exists.
- Crime grade is F in this area — have there been break-ins, vandalism, or insurance claims at this property in the last 3 years? What carrier currently insures it and at what premium?
- What's the average days-on-market for RENTAL listings here right now (not sales)? A rising rental-DOM trend means longer vacancies and softer asking-rent achievability than the comps imply.
- What's the recent tenant-quality profile in this submarket — average credit score on applications, eviction rate, late-payment / NSF rate, and stable-employment percentage? A property-management company in the area should have these aggregated.
- How much new for-sale + rental construction is in the pipeline within 1–3 miles? Heavy new supply typically softens prices + rents 12–24 months out; constrained supply supports both.
Investment metrics
- 1% rule
- 1.07% ✓
- Cap rate
- 8.94%
- Cash-on-cash
- 9.46%
- DSCR
- 1.42
- GRM
- 7.8
CMA / ARV
- ARV (on-the-fly)
- $60,060
- Comps found
- 4
Show comp detail 4 sales within ~0.75 mi
| Address | Dist | Beds/Ba | Sqft | Sold | Price | $/sf | Match |
|---|---|---|---|---|---|---|---|
| 844 E Edgemont Ave | 0.18mi | 2/1.0 | 1,053 (+5%) | 11mo | $125,000 | $119 | 74 |
| 3448 Gilmer Ct | 0.55mi | 2/1.0 | 974 (-3%) | 7mo | $50,000 | $51 | 64 |
| 1311 Avalon Ln | 0.62mi | 3/1.0 (+1) | 1,049 (+5%) | 10mo | $62,500 | $60 | 50 |
| 3770 Maclamar Rd | 0.74mi | 3/1.0 (+1) | 1,129 (+13%) | 22mo | $53,000 | $47 | 20 |
Match score weights: distance 35% · size 25% · config 20% · recency 20%. Top-matched comps best support the ARV.
Projected returns pro-forma
-3.0% appreciation · 3.0% rent growth · sell at horizon
- IRR
- -2.1%
- Equity multiple
- 0.92×
- Total profit
- $-2,060
- Equity at exit
- $14,165
- IRR
- 7.6%
- Equity multiple
- 1.58×
- Total profit
- $15,315
- Equity at exit
- $8,214
Cash invested: $26,600 (down + closing). Projections, not guarantees.
Landlord ↔ Tenant lean methodology
- Overall (STATE)
- 90 Strongly Landlord-Friendly
- State Alabama
- 90 Strongly Landlord-Friendly · R+15
- County
- — inherits STATE
- City
- — inherits STATE
ZIP-level market 36111
- Home prices YoY
- -6.9%
- Active inventory
- 110
- Price-to-rent
- 7.8×
Monthly cashflow live
- Estimated rent
- $1,019 high interval (Pro) →
- Mortgage (P&I)
- −$498
- Tax from tax record
- −$58 /mo · $692/yr
- Insurance
- −$40
- HOA
- −$0
- Vacancy / Maint / Mgmt
- −$214
- Net cashflow
- $210
Break-even live
UW: 25.0% down · 7.5% · 30yr · 1.5% tax · 5.0% vac · 8.0% maint · 8.0% mgmt
Financing live
Cash to close
- Down payment
- $23,750
- Closing costs
- $2,850
- Reserves months
- —
- Total cash needed
- —
Loan-product check · same deal, 3 products live
Conventional
25% down · 7.5% · 30yr
- Down + closing
- —
- Monthly P&I
- —
- Monthly cashflow
- —
- DSCR
- —
- Eligible?
- —
Personal DTI + credit; lowest rate.
DSCR
20% down · 8.5% · 30yr
- Down + closing
- —
- Monthly P&I
- —
- Monthly cashflow
- —
- DSCR
- —
- Eligible?
- —
No personal income docs; deal must DSCR.
Hard money
10% down · 12.0% · 12mo
- Down + closing
- —
- Monthly P&I
- —
- Monthly cashflow
- —
- DSCR
- —
- Eligible?
- —
Short-term bridge; refi at stabilization.
Rent comps 40 comps
| Address | Beds | Baths | Sqft | Rent | $/sqft | DOM | Units | Dist |
|---|---|---|---|---|---|---|---|---|
| 951 E Edgemont Ave Montgomery, AL | 2.0 | 1.0 | 841 | $750 | $0.89 | 43d | 1 | 0.22mi |
| 945 E Edgemont Ave Unit 951 Montgomery, AL | 2.0 | 1.0 | 841 | $750 | $0.89 | 43d | 1 | 0.22mi |
| 3369 Montezuma Rd Montgomery, AL | 3.0 | 1.0 | 1281 | $1,150 | $0.90 | 43d | 1 | 0.24mi |
| 3356 Audubon Rd Montgomery, AL | 2.0 | 1.5 | 1340 | $950 | $0.71 | 43d | 1 | 0.26mi |
| 1020 Pershing St Unit D Montgomery, AL | 1.0 | 1.0 | 750 | $600 | $0.80 | 21d | 1 | 0.32mi |
| 3357 Lexington Rd Montgomery, AL | 2.0 | 1.0 | 1200 | $1,175 | $0.98 | 13d | 1 | 0.38mi |
| 3515 Norman Bridge Rd Unit B Montgomery, AL | 1.0 | 1.0 | 700 | $875 | $1.25 | 43d | 1 | 0.39mi |
| 3515 Norman Bridge Rd Unit A Montgomery, AL | 2.0 | 1.0 | 1150 | $1,150 | $1.00 | 43d | 1 | 0.39mi |
| 3735 Bridlewood Dr Montgomery, AL | 3.0 | 1.0 | 1386 | $895 | $0.65 | 43d | 1 | 0.48mi |
| 3649 Princeton Rd Montgomery, AL | 3.0 | 1.0 | 1266 | $1,200 | $0.95 | 21d | 1 | 0.54mi |
| 3608 Wilmington Rd Montgomery, AL | 3.0 | 1.0 | 1160 | $950 | $0.82 | 43d | 1 | 0.58mi |
| 603 Hubbard Ave Unit A Montgomery, AL | 1.0 | 1.0 | 954 | $950 | $1.00 | 21d | 1 | 0.60mi |
| 3338 S Hull St Montgomery, AL | 2.0 | 2.0 | 1311 | $1,150 | $0.88 | 21d | 1 | 0.63mi |
| 3737 Wesley Dr Montgomery, AL | 3.0 | 2.0 | 1050 | $1,280 | $1.22 | 43d | 1 | 0.63mi |
| 3701 Wesley Dr Unit 3737 Montgomery, AL | 3.0 | 2.0 | 1050 | $1,280 | $1.22 | 43d | 1 | 0.66mi |
| 3701 Wesley Dr Unit 3733 Montgomery, AL | 3.0 | 1.0 | 1000 | $1,280 | $1.28 | 43d | 1 | 0.66mi |
| 3701 Wesley Dr Unit 3723 Montgomery, AL | 3.0 | 1.0 | 1000 | $1,200 | $1.20 | 21d | 1 | 0.66mi |
| 3709 Wesley Dr Montgomery, AL | 3.0 | 1.0 | 1000 | $1,200 | $1.20 | 21d | 1 | 0.67mi |
| 906 E Fairview Ave Unit 902 Montgomery, AL | 2.0 | 1.0 | 1100 | $995 | $0.90 | 21d | 1 | 0.67mi |
| 3723 Wesley Dr Montgomery, AL | 3.0 | 1.0 | 1000 | $1,200 | $1.20 | 21d | 1 | 0.70mi |
| 3733 Wesley Dr Montgomery, AL | 3.0 | 1.0 | 1000 | $1,200 | $1.20 | 21d | 1 | 0.72mi |
| 3735 Wesley Dr Montgomery, AL | 3.0 | 1.0 | 1000 | $1,200 | $1.20 | 21d | 1 | 0.72mi |
| 3394 Southmont Dr Unit 2 Montgomery, AL | 2.0 | 1.0 | 810 | $1,475 | $1.82 | 43d | 1 | 0.75mi |
| 3394 Southmont Dr Unit 3 Montgomery, AL | 2.0 | 1.0 | 810 | $1,050 | $1.30 | 43d | 1 | 0.75mi |
| 3770 Maclamar Rd Montgomery, AL | 3.0 | 1.0 | 1129 | $950 | $0.84 | 21d | 1 | 0.75mi |
| 3751 Wesley Dr Apt A Montgomery, AL | 2.0 | 1.0 | 1034 | $550 | $0.53 | 43d | 1 | 0.77mi |
| 2727 Boultier St Montgomery, AL | 1.0–3.0 | 1.0–2.0 | 1070 | $1,508 | $1.41 | 13d | 3 | 0.79mi |
| 548 Winston Dr Montgomery, AL | 2.0 | 2.5 | 1396 | $1,000 | $0.72 | 43d | 1 | 0.94mi |
| 105 Arlington Rd Unit B Montgomery, AL | 2.0 | 1.0 | 1100 | $925 | $0.84 | 43d | 1 | 0.99mi |
| 1114 Druid Hills Dr Montgomery, AL | 3.0 | 1.0 | 1192 | $1,250 | $1.05 | 21d | 1 | 0.99mi |
| 429 Felder Ave Montgomery, AL | 1.0 | 1.0 | 1000 | $1,075 | $1.07 | 13d | 1 | 1.12mi |
| 2166 College St Montgomery, AL | 1.0 | 1.0 | 700 | $775 | $1.11 | 13d | 1 | 1.14mi |
| 1493 Watson St Montgomery, AL | 1.0 | 1.0 | 1066 | $900 | $0.84 | 21d | 1 | 1.19mi |
| 1487 Watson St Montgomery, AL | 1.0 | 1.0 | 1066 | $875 | $0.82 | 21d | 1 | 1.19mi |
| 1491 Watson St Montgomery, AL | 1.0 | 1.0 | 1066 | $900 | $0.84 | 21d | 1 | 1.19mi |
| 1343 Felder Ave Montgomery, AL | 2.0 | 1.0 | 1000 | $1,095 | $1.09 | 13d | 1 | 1.21mi |
| 1347 Felder Ave Montgomery, AL | 2.0 | 1.0 | 1000 | $1,095 | $1.09 | 13d | 1 | 1.22mi |
| 329 Cloverdale Rd Montgomery, AL | 1.0 | 1.0 | 850 | $725 | $0.85 | 43d | 1 | 1.25mi |
| 432 Clanton Ave Montgomery, AL | 2.0 | 1.0 | 800 | $995 | $1.24 | 13d | 1 | 1.28mi |
| 253 John Morris Ave Montgomery, AL | 3.0 | 1.0 | 912 | $950 | $1.04 | 21d | 1 | 1.29mi |
Listing history 7 events
-
2026-06-18days on market $95,000 Active 7 DOM
-
2026-06-17days on market $95,000 Active 6 DOM
-
2026-06-16days on market $95,000 Active 5 DOM
-
2026-06-15days on market $95,000 Active 4 DOM
-
2026-06-14days on market $95,000 Active 2 DOM
-
2026-06-13remarks 612-char remark
-
2026-06-13$95,000 Active 1 DOM
ⓘ Source: listings_history table (triggers on properties + properties_extension) + one-shot
backfill from property_details.listing_events for pre-trigger history.
Tax reassessment forecast AL · Resets to sale price
- Current annual tax
- $692 · $58/mo
- Projected year-2 tax
- $692 · $58/mo
- Expected delta
- $0/yr ($0/mo · 0.0%)
ⓘ Screening estimate from a state-policy table — verify with the county assessor before closing.
Climate risk First Street
- Flood 1/10 Low FEMA zone X (unshaded) · 0% chance over 30 yrs
- Wildfire 1/10 Low
- Heat 7/10 Severe 7 d/yr ≥108°F today · 20 d/yr by 30 yrs out
- Wind 8/10 Severe 80% chance of damaging wind over 30 yrs
- Air quality 2/10 Low 1 unhealthy d/yr today · 1 by 30 yrs out
Nearby sold comps map
Loading sold comps map…
Walkable amenities ~0.75 mi
Loading nearby amenities…
Taxation est. · year 1
- Rental income
- $12,230
- − Mortgage interest
- −$5,321
- − Property taxes
- −$692
- − Insurance
- −$475
- − Repairs & maintenance
- −$978
- − Management
- −$978
- − Depreciation
- −$2,764
- Taxable income
- $1,021
- Est. tax owed @ 24.0%
- −$245
- After-tax cash flow
- $2,271/yr
For passive investors: Depreciation is non-cash, so a rental often shows a tax loss while cash-flowing — sheltering income. Rental losses are passive: they offset passive income freely, and up to $25,000/yr can offset ordinary (W-2) income if you actively participate and your MAGI is under $100k (phasing out to $0 by $150k); unused losses carry forward. On sale, claimed depreciation is recaptured at up to 25%, and gains may owe capital-gains tax (a 1031 exchange can defer both). Figures are a year-1 estimate at your 24.0% rate — not tax advice; consult a CPA.
Schools (NCES district)
- District
- Montgomery County
- NCES district ID
- 0102430
- Math proficiency
- 9% ▼ -21.00%
- Reading proficiency
- 31% ▼ -1.00%
- Median HH income
- $43,902
- Composite
- 17.24/100
- National rank
- #9093
- State rank
- #106 of 129 in AL
Livability — Montgomery
- Score
- 65/100
- State rank
- #138
- US rank
- #13416
Category grades
Schools grade is shown separately in the Schools card above.
Census & demographics
- Census place
- Montgomery, AL
- City population
- 175,913
- Population (ZIP)
- 12,196
Population outlook (Montgomery County) Hauer SSP2
- Today (2025)
- 224,008 people
- By 2030
- 221,460 · -1.1%
- By 2040
- 214,179 · -4.4%
- By 2050
- 204,912 · -8.5%
- By 2075
- 177,821 · -20.6%
- By 2100
- 145,134 · -35.2%
Race, ethnicity, and origin ACS 2023
- Neighborhood character
- Majority Black (60%)
- Race & ethnicity
- Black 60% White 34% Asian 3% Hispanic / Latino 2% Two or more races 2%
- Common ancestry
- Slovak 2% Serbian 2% Italian 1%
- Foreign-born
- 3% · China, Canada
- Languages at home
- 95% English-only · Other Indo-European 2% Spanish 1% Chinese 1%
Political lean MEDSL · Montgomery
- 2024 margin
- Solid D (+30.7) · D 64.8% · R 34.1% · Other 1.1%
- 2008→2024 swing
- +11.5pp toward D · 2008: 19.2pp · 2024: 30.7pp
- All cycles
- 2024: D+30.7 2020: D+31.5 2016: D+26.2 2012: D+24.3 2008: D+19.2
Not yet ingested
- Civics
- —
Market trends
- HPI YoY
- ▼ -11.63%
- Current HPI
- 156.4412
- Rent YoY
- —
- Metro
- —
- State GDP YoY
- ▲ 2.94%
- F500 in state
- 4
Industry mix (Fortune 500 HQ in AL)
| Industry | F500 HQs | Revenue |
|---|---|---|
| Financial Services | 1 | $8B |
|
||
| Healthcare | 1 | $5B |
|
||
Price history
+138.1% since first listed6 events — show timeline
- 2026-06-11 Listed $95,000 MAAR
- 2022-07-28 Sold (MLS) $87,500 MAAR
- 2022-06-24 Listed $87,500 MAAR
- 2004-02-16 Listed $54,900 MAAR
- 2002-07-01 Sold (MLS) $27,500 MAAR
- 2002-02-06 Listed $39,900 MAAR
Property tax history
+9.2%/yrLatest (2025): $692 · +1.9% YoY. Source: county tax records.
Cash-flow waterfall
monthlySold comps — $/sqft
last 12 mo · ≤1 miLoading sold comps…