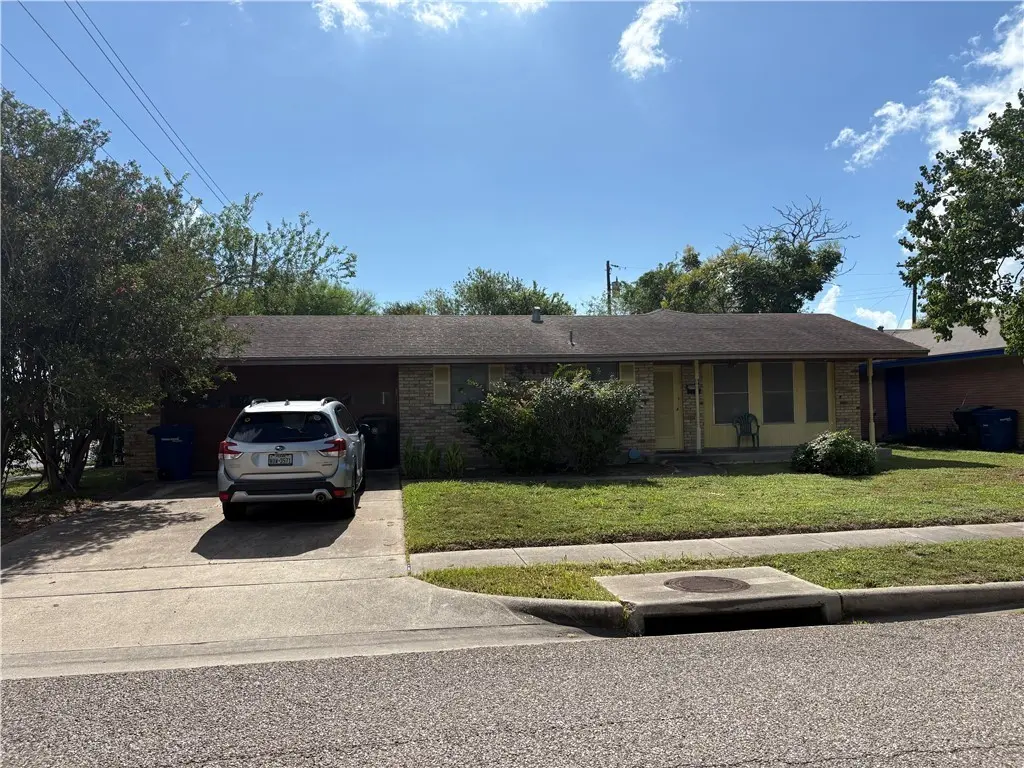
4902 Branscomb Dr · Corpus Christi, TX
Flood risk 7/10 · Major
- FEMA flood zone
- X (unshaded)
- Chance of flooding over 30 yrs
- 0.99%
- Est. flood insurance / yr
- $507 – $1,088
Fire risk 1/10 · Minimal
- Est. fire insurance / yr
- $1,222 – $2,270
Heat risk 10/10 · Severe
- Hot days now (above 107°F)
- 7 days/yr
- Hot days in 30 yrs
- 28 days/yr
Wind risk 9/10 · Severe
- Chance of severe wind over 30 yrs
- 99.0%
Air-quality risk 1/10 · Minimal
- Unhealthy air days now
- 0 days/yr
- Unhealthy air days in 30 yrs
- 0 days/yr
Risk factors via First Street. Map © Google.
Why this score? — see what drove the C- grade
The composite is a weighted blend of 9 inputs, each scored 0–100. Each bar is that input's sub-score; the figure is the points it added to the 100-point composite (weight × sub-score).
- Cash flow +16.0/30.0
- ARV discount +15.0/15.0
- 1% rule +5.0/10.0
- DSCR +4.9/10.0
- Rent growth +4.5/5.0
- Livability +3.9/5.0
- Schools +2.8/10.0
- Condition / age +2.5/5.0
- Appreciation +0.0/10.0
$158,000
🖨 Deal sheet (PDF) 📄 Offer letter ✓ Due diligence
Listing remarks
Corner lot location, three bedroom home with 2 living area's. New interior paint and flooring. New dishwasher. Recent AC repairs. Priced to Sell as is.
Key facts
- New flooring
- Recent ac repairs
- New dishwasher
Tags
Property features AI
Exterior
- Parking: Attached garage; 2 covered garage spaces
- Utilities: Public water; Public sewer; Sewer available; Water available
- Home design: Single-story; Brick construction; Slab foundation; Shingle roof
- Construction: Built with brick; Shingle roof; Slab foundation; 1 story
- Exterior features: Open patio; Patio; Chain link and wood fencing; Corner lot
Interior
- Kitchen: Electric cooktop; Electric oven; Electric range
- Flooring: Ceramic tile; Laminate
- Bathrooms: 2 full bathrooms
- Heating & cooling: Central heating (electric); Central air conditioning
- Interior features: Cable TV
- Laundry & utility: Washer hookup; Dryer hookup
Neighborhood map
What this means for you Summary
Snapshot
- This is a 3-bed/2.0-bath single-family listed at $158k.
Deal economics
- At list price, monthly cash flow is $11 ($134/yr) — positive.
- The deal already cash-flows at list — no discount required.
- Meets the 1% rule at list price ($2k rent vs $158k).
- Cap rate 6.9% vs local median 3.6% in Corpus Christi — top-decile yield for the area; either an underpriced asset or a hidden risk that comps aren't pricing in. Stress-test before assuming the spread holds.
Location & tenants
- Location reads 78/100 on livability (#66 in TX, #2,404 nationally) — a middle-class / working-renter tenant base. Strengths: commute A+, cost of living A+, housing A+; Watch: crime F.
- Corpus Christi ISD (urban): math 31% / reading 35% proficiency, ranked #562 of 826 in TX (top 68%) — families likely to look elsewhere, expect single-tenant / working-renter base with shorter leases; 63% free/reduced lunch — lower-income household profile, screen leases tightly.
- Zoned schools: Windsor Park G/T (math 85% / reading 90%, grade A+, #6 of 4,322 statewide, top 0%, 609 students, 29% FRL); Adkins Middle (math 40% / reading 39%, grade F, #660 of 1,662 statewide, top 41%, 956 students, 48% FRL); Ray H S (math 49% / reading 47%, grade D, #571 of 1,632 statewide, top 36%, 1,640 students, 69% FRL).
- Zoned-school proficiency averages 58% at this address vs 33% district-wide (+25 pts) — the actual schools serving this property are materially stronger than the Corpus Christi ISD average implies; a family-tenant draw the district grade alone would hide.
- Market conditions: Rents rising fast (+7.9%/yr); 147 active listings in the ZIP; 40 comparable units currently listed for rent nearby; rentals at typical pace (median 24d on market — plan ~3-4 weeks tenant-placement turnaround); 42% of comp listings sitting > 30 days — soft ceiling on asking rent; 1,397 units permitted in Nueces County in 2024 (47 in 5+ unit buildings).
- This rent runs 33% of the median local income ($58k/yr) — at the standard rent-burdened threshold; future hikes will face affordability resistance.
Forward outlook
- Local home prices are declining (-3.0%/yr); year-one equity from $1k of loan paydown is wiped out by about $5k of value loss. Plan a longer hold.
- Nueces County population projected at +36% by 2050 — long-run rental-demand tailwind backs the buy-and-hold thesis.
Negotiation context
- Only 4 days on market — expect competitive offers; lowballing is unlikely to land.
- 3 sale attempts with the ask held roughly flat each time — persistent listings suggest the price (not the market) is what's stuck; bring a comps-based counter.
Risks & watch-outs
- Watch-outs: flood insurance adds $66/mo.
- Climate carrying-cost: major flood risk; severe wind risk, 99% chance of damaging wind over 30y; extreme-heat days projected 7→28/yr by 2055 (HVAC capex compounding) — expect insurance premiums to compound above CPI over the hold.
Questions for the listing agent
- Built in 1963 — when were the roof, HVAC, electrical panel, plumbing, and water heater last replaced?
- What's the actual annual flood-insurance premium (NFIP or private), and is the property in a SFHA with mandatory coverage?
- Is there a deadline driving the sale (1031 exchange, divorce, estate, relocation)? That informs how much negotiation room exists.
- Crime grade is F in this area — have there been break-ins, vandalism, or insurance claims at this property in the last 3 years? What carrier currently insures it and at what premium?
- What's the average days-on-market for RENTAL listings here right now (not sales)? A rising rental-DOM trend means longer vacancies and softer asking-rent achievability than the comps imply.
- What's the recent tenant-quality profile in this submarket — average credit score on applications, eviction rate, late-payment / NSF rate, and stable-employment percentage? A property-management company in the area should have these aggregated.
- How much new for-sale + rental construction is in the pipeline within 1–3 miles? Heavy new supply typically softens prices + rents 12–24 months out; constrained supply supports both.
Investment metrics
- 1% rule
- 1.00% ✓
- Cap rate
- 6.88%
- Cash-on-cash
- 2.10%
- DSCR
- 1.09
- GRM
- 8.3
CMA / ARV
- ARV (median comp)
- $189,551
- List price
- $158,000
- Delta
- -16.12%
- Verdict
- UNDERPRICED
- Comps
- 20 within 1.0 mi
Show comp detail 12 sales within ~0.75 mi
| Address | Dist | Beds/Ba | Sqft | Sold | Price | $/sf | Match |
|---|---|---|---|---|---|---|---|
| 4814 French Dr | 0.34mi | 3/2.0 | 1,261 (-2%) | 4mo | $90,000 | $71 | 78 |
| 4805 Prinston Dr | 0.36mi | 3/1.0 | 1,294 (+1%) | 2mo | $109,000 | $84 | 76 |
| 4826 French Dr | 0.33mi | 3/3.0 | 1,313 (+2%) | 6mo | $108,000 | $82 | 71 |
| 4605 Abner Dr | 0.48mi | 3/2.0 | 1,329 (+4%) | 2mo | $80,000 | $60 | 70 |
| 4405 Totton Dr | 0.38mi | 3/1.5 | 1,207 (-6%) | 4mo | $225,000 | $186 | 67 |
| 4813 Waltham Dr | 0.31mi | 4/2.0 (+1) | 1,364 (+6%) | 4mo | $225,900 | $166 | 66 |
| 4829 Alice St | 0.53mi | 3/2.0 | 1,384 (+8%) | 6mo | $174,900 | $126 | 57 |
| 4805 Alice St | 0.53mi | 3/2.0 | 1,130 (-12%) | 2mo | $185,000 | $164 | 54 |
| 4729 Prinston Dr | 0.37mi | 4/1.0 (+1) | 1,168 (-9%) | 6mo | $199,900 | $171 | 54 |
| 4241 Jacquelyn Dr | 0.66mi | 3/2.0 | 1,456 (+14%) | 1mo | $234,900 | $161 | 46 |
| 918 Ashland Dr | 0.75mi | 3/2.0 | 1,463 (+14%) | 1mo | $75,000 | $51 | 40 |
| 4410 Marie St | 0.75mi | 2/2.0 (-1) | 1,457 (+14%) | 7mo | $253,900 | $174 | 31 |
Match score weights: distance 35% · size 25% · config 20% · recency 20%. Top-matched comps best support the ARV.
Projected returns pro-forma
-3.0% appreciation · 7.91% rent growth · sell at horizon
- IRR
- -9.7%
- Equity multiple
- 0.63×
- Total profit
- $-16,555
- Equity at exit
- $23,558
- IRR
- 5.9%
- Equity multiple
- 1.55×
- Total profit
- $24,318
- Equity at exit
- $13,661
Cash invested: $44,240 (down + closing). Projections, not guarantees.
Landlord ↔ Tenant lean methodology
- Overall (STATE)
- 87 Strongly Landlord-Friendly
- State Texas
- 87 Strongly Landlord-Friendly · R+5
- County
- — inherits STATE
- City
- — inherits STATE
ZIP-level market 78411
- Rents YoY
- 7.9%
- Active inventory
- 147
- Price-to-rent
- 8.3×
Monthly cashflow live
- Estimated rent
- $1,586 high interval (Pro) →
- Mortgage (P&I)
- −$829
- Tax from tax record
- −$281 /mo · $3,368/yr
- Insurance
- −$66
- Flood insurance flood zone
- −$66 /mo · $798/yr
- HOA
- −$0
- Lot rent
- −$0
- Vacancy / Maint / Mgmt
- −$333
- Net cashflow
- $11
Break-even live
Sensitivity live
| Price | -10% $101 | -5% $56 | +0% $11 | +5% $-34 | +10% $-78 |
|---|---|---|---|---|---|
| Rent | -10% $-114 | -5% $-51 | +0% $11 | +5% $74 | +10% $136 |
| Rate | -1.0pp $91 | -0.5pp $51 | base $11 | +0.5pp $-30 | +1.0pp $-71 |
UW: 25.0% down · 7.5% · 30yr · 1.5% tax · 5.0% vac · 8.0% maint · 8.0% mgmt
Financing live
Cash to close
- Down payment
- $39,500
- Closing costs
- $4,740
- Reserves months
- —
- Total cash needed
- —
Loan-product check · same deal, 3 products live
Conventional
25% down · 7.5% · 30yr
- Down + closing
- —
- Monthly P&I
- —
- Monthly cashflow
- —
- DSCR
- —
- Eligible?
- —
Personal DTI + credit; lowest rate.
DSCR
20% down · 8.5% · 30yr
- Down + closing
- —
- Monthly P&I
- —
- Monthly cashflow
- —
- DSCR
- —
- Eligible?
- —
No personal income docs; deal must DSCR.
Hard money
10% down · 12.0% · 12mo
- Down + closing
- —
- Monthly P&I
- —
- Monthly cashflow
- —
- DSCR
- —
- Eligible?
- —
Short-term bridge; refi at stabilization.
Rent comps 40 comps
| Address | Beds | Baths | Sqft | Rent | $/sqft | DOM | Units | Dist |
|---|---|---|---|---|---|---|---|---|
| 4817 Lavaca Dr Unit 1 Corpus Christi, TX | 2.0 | 1.0 | 1746 | $1,195 | $0.68 | 23d | 1 | 0.27mi |
| 4813 Lavaca Dr Unit 2 Corpus Christi, TX | 2.0 | 1.0 | 1746 | $1,095 | $0.63 | 46d | 1 | 0.28mi |
| 4813 Lavaca Dr Unit 1 Corpus Christi, TX | 2.0 | 1.0 | 1746 | $1,195 | $0.68 | 23d | 1 | 0.28mi |
| 4805 Lavaca Dr Unit 1 Corpus Christi, TX | 2.0 | 1.0 | 1030 | $1,300 | $1.26 | 23d | 1 | 0.29mi |
| 4830 French Dr Corpus Christi, TX | 3.0 | 2.0 | 1299 | $1,700 | $1.31 | 16d | 1 | 0.34mi |
| 4801 Lansdown Dr Corpus Christi, TX | 3.0 | 2.0 | 1242 | $1,525 | $1.23 | 16d | 1 | 0.40mi |
| 5002 Bevly Dr Unit A Corpus Christi, TX | 3.0 | 2.0 | 1400 | $1,499 | $1.07 | 23d | 1 | 0.51mi |
| 4502 Corona Dr Corpus Christi, TX | 1.0–2.0 | 1.0–2.0 | 855 | $1,000 | $1.17 | 16d | 1 | 0.55mi |
| 4717 Edith St Unit 1268436P Corpus Christi, TX | 4.0 | 2.0 | 1496 | $4,708 | $3.15 | 46d | 1 | 0.60mi |
| 802 Barry St Corpus Christi, TX | 2.0 | 1.5 | 1102 | $1,529 | $1.39 | 46d | 1 | 0.70mi |
| 722 Collingswood Dr Corpus Christi, TX | 3.0 | 1.5 | 1318 | $1,595 | $1.21 | 16d | 1 | 0.81mi |
| 749 Ashland Dr Corpus Christi, TX | 3.0 | 1.0 | 1179 | $1,550 | $1.31 | 46d | 1 | 0.83mi |
| 4110 Grossman Dr Unit B Corpus Christi, TX | 3.0 | 2.0 | 1228 | $1,500 | $1.22 | 46d | 1 | 0.85mi |
| 4002 McArdle Rd Corpus Christi, TX | 3.0 | 1.0 | 1018 | $1,095 | $1.08 | 16d | 1 | 0.86mi |
| 4402 Sutton Ln Corpus Christi, TX | 4.0 | 2.0 | 1850 | $2,100 | $1.14 | 16d | 1 | 0.87mi |
| 1137 Bradshaw Dr Corpus Christi, TX | 3.0 | 2.0 | 1424 | $1,900 | $1.33 | 16d | 1 | 0.99mi |
| 1033 Bradshaw Dr Corpus Christi, TX | 3.0 | 2.0 | 1194 | $1,750 | $1.47 | 46d | 1 | 1.01mi |
| 4634 Weir Dr Corpus Christi, TX | 3.0 | 2.0 | 1540 | $1,800 | $1.17 | 46d | 1 | 1.02mi |
| 3936 Brushwood Ln Corpus Christi, TX | 2.0 | 1.0 | 900 | $925 | $1.03 | 46d | 1 | 1.02mi |
| 929 Dolphin Pl Corpus Christi, TX | 3.0 | 2.0 | 1508 | $2,095 | $1.39 | 23d | 1 | 1.08mi |
| 4006 Panama Dr Corpus Christi, TX | 3.0 | 2.0 | 1816 | $1,949 | $1.07 | 23d | 1 | 1.09mi |
| 5802 Everhart Rd Corpus Christi, TX | 1.0–3.0 | 1.0–2.0 | 926 | $1,570 | $1.69 | 16d | 16 | 1.11mi |
| 4013 Kingston Dr Corpus Christi, TX | 3.0 | 2.0 | 1451 | $2,500 | $1.72 | 46d | 1 | 1.13mi |
| 4422 S Alameda St Corpus Christi, TX | 1.0–3.0 | 1.0–2.0 | 820 | $1,000 | $1.22 | 16d | 1 | 1.13mi |
| 3738 Marion St Corpus Christi, TX | 3.0 | 1.0 | 1100 | $1,295 | $1.18 | 46d | 1 | 1.15mi |
| 4201 Junior Ter Corpus Christi, TX | 3.0 | 1.0 | 1016 | $1,600 | $1.57 | 46d | 1 | 1.20mi |
| 4845 Concord St Corpus Christi, TX | 4.0 | 2.0 | 1437 | $1,750 | $1.22 | 16d | 1 | 1.20mi |
| 946 Lum Ave Corpus Christi, TX | 3.0 | 1.0 | 1045 | $1,300 | $1.24 | 46d | 1 | 1.23mi |
| 4022 Montego Dr Corpus Christi, TX | 2.0 | 1.0 | 1070 | $850 | $0.79 | 46d | 1 | 1.23mi |
| 4717 S Shea Pkwy Corpus Christi, TX | 3.0 | 2.0 | 1284 | $1,695 | $1.32 | 46d | 1 | 1.28mi |
| 4018 Holly Rd Unit 08 Corpus Christi, TX | 2.0 | 1.0 | 1070 | $895 | $0.84 | 46d | 1 | 1.28mi |
| 4014 Holly Rd Unit 02 Corpus Christi, TX | 2.0 | 1.0 | 1070 | $895 | $0.84 | 46d | 1 | 1.29mi |
| 4942 Anthony St Corpus Christi, TX | 3.0 | 1.0 | 1014 | $1,595 | $1.57 | 16d | 1 | 1.30mi |
| 3942 Holly Rd Corpus Christi, TX | 1.0–2.0 | 1.0–2.0 | 870 | $1,112 | $1.28 | 16d | 11 | 1.34mi |
| 4040 Schanen Blvd Corpus Christi, TX | 1.0–2.0 | 1.0–2.0 | 772 | $774 | $1.00 | 46d | 15 | 1.38mi |
| 4406 Donegal Dr Corpus Christi, TX | 3.0 | 2.0 | 1338 | $1,800 | $1.35 | 16d | 1 | 1.39mi |
| 5750 Curtis Clark Dr Corpus Christi, TX | 2.0 | 1.0–2.0 | 756 | $1,560 | $2.06 | 16d | 20 | 1.41mi |
| 4822 Mokry Dr Corpus Christi, TX | 2.0 | 1.0 | 903 | $1,200 | $1.33 | 23d | 1 | 1.41mi |
| 4438 Donegal Dr Corpus Christi, TX | 3.0 | 2.0 | 1628 | $1,900 | $1.17 | 16d | 1 | 1.42mi |
| 625 Catalina Pl Corpus Christi, TX | 3.0 | 2.0 | 1750 | $2,100 | $1.20 | 16d | 1 | 1.43mi |
Listing history 13 events
-
2026-06-18days on market $158,000 Active 4 DOM
-
2026-06-17days on market $158,000 Active 3 DOM
-
2026-06-16days on market $158,000 Active 2 DOM
-
2026-06-15pricedays on market $158,000 Active 1 DOM
-
2026-05-31days on market $159,000 Active 114 DOM
-
2026-05-30days on market $159,000 Active 113 DOM
-
2026-05-06price $159,000 151-char remark
-
2026-03-10price $174,900 151-char remark
-
2026-02-06$179,900 Active 151-char remark
-
2026-02-01historical
-
2025-11-25price $184,900
-
2025-09-24$189,900 Active
-
2021-09-01soldstatus
ⓘ Source: listings_history table (triggers on properties + properties_extension) + one-shot
backfill from property_details.listing_events for pre-trigger history.
Tax reassessment forecast TX · Resets to sale price
- Current annual tax
- $3,368 · $281/mo
- Projected year-2 tax
- $3,368 · $281/mo
- Expected delta
- $0/yr ($0/mo · 0.0%)
ⓘ Screening estimate from a state-policy table — verify with the county assessor before closing.
Climate risk First Street
- Flood 7/10 Severe FEMA zone X (unshaded) · 99% chance over 30 yrs
- Wildfire 1/10 Low
- Heat 10/10 Extreme 7 d/yr ≥107°F today · 28 d/yr by 30 yrs out
- Wind 9/10 Extreme 99% chance of damaging wind over 30 yrs
- Air quality 1/10 Low 0 unhealthy d/yr today · 0 by 30 yrs out
Nearby sold comps map
Loading sold comps map…
Walkable amenities ~0.75 mi
Loading nearby amenities…
Taxation est. · year 1
- Rental income
- $19,028
- − Mortgage interest
- −$8,850
- − Property taxes
- −$3,368
- − Insurance
- −$1,588
- − Repairs & maintenance
- −$1,522
- − Management
- −$1,522
- − Depreciation
- −$4,596
- Taxable loss
- −$2,419
- Est. tax savings @ 24.0%
- +$581
- After-tax cash flow
- $714/yr
For passive investors: Depreciation is non-cash, so a rental often shows a tax loss while cash-flowing — sheltering income. Rental losses are passive: they offset passive income freely, and up to $25,000/yr can offset ordinary (W-2) income if you actively participate and your MAGI is under $100k (phasing out to $0 by $150k); unused losses carry forward. On sale, claimed depreciation is recaptured at up to 25%, and gains may owe capital-gains tax (a 1031 exchange can defer both). Figures are a year-1 estimate at your 24.0% rate — not tax advice; consult a CPA.
Schools (NCES district)
- District
- Corpus Christi ISD
- NCES district ID
- 4815270
- Math proficiency
- 31% ▼ -18.00%
- Reading proficiency
- 35% ▼ -7.00%
- Median HH income
- $45,672
- Composite
- 28.27/100
- National rank
- #6793
- State rank
- #562 of 826 in TX
Livability — Corpus Christi
- Score
- 78/100
- State rank
- #66
- US rank
- #2404
Category grades
Schools grade is shown separately in the Schools card above.
Census & demographics
- Census place
- Corpus Christi, TX
- County
- Nueces County · 296,836 people
- City population
- 296,836
- Metro
- Corpus Christi, TX
- Population (ZIP)
- 23,682
- Household income
- $57,742
- Rent vs Own
- Severe rent burden
- 1284.0
Population outlook (Nueces County) Hauer SSP2
- Today (2025)
- 418,037 people
- By 2030
- 447,123 · +7.0%
- By 2040
- 505,911 · +21.0%
- By 2050
- 567,522 · +35.8%
- By 2075
- 729,686 · +74.6%
- By 2100
- 847,087 · +102.6%
Race, ethnicity, and origin ACS 2023
- Neighborhood character
- Majority Hispanic (58%)
- Race & ethnicity
- Hispanic / Latino 58% White 35% Two or more races 29% Black 3% Asian 2%
- Hispanic origin (detail)
- Mexican 51%
- Common ancestry
- Slovak 2% Italian 1% Serbian 1%
- Foreign-born
- 6% · Canada
- Languages at home
- 75% English-only · Spanish 23% Tagalog/Filipino 1% Other Indo-European 1%
Political lean MEDSL · Nueces
- 2024 margin
- R (+11.5) · D 43.8% · R 55.3%
- 2008→2024 swing
- -7.1pp toward R · 2008: -4.4pp · 2024: -11.5pp
- All cycles
- 2024: R+11.5 2020: R+2.9 2016: R+1.5 2012: R+3.2 2008: R+4.4
Not yet ingested
- Civics
- —
Market trends
- HPI YoY
- ▼ -265.71%
- Current HPI
- 191.7201
- Rent YoY
- ▲ 7.91%
- Metro
- Corpus Christi, TX
- State GDP YoY
- ▲ 3.95%
- F500 in state
- 110
Industry mix (Fortune 500 HQ in TX)
| Industry | F500 HQs | Revenue |
|---|---|---|
| Energy | 16 | $1,198B |
|
||
| Technology | 5 | $198B |
|
||
| Engineering / Construction | 4 | $72B |
|
||
| Energy Services | 3 | $60B |
|
||
| Utilities | 3 | $41B |
|
||
| Healthcare | 2 | $330B |
|
||
Price history
-16.8% since first listed9 events — show timeline
- 2026-06-12 Listed $158,000 CBMLS
- 2026-06-01 Delisted — CBMLS
- 2026-05-06 Price Changed $159,000 CBMLS
- 2026-03-10 Price Changed $174,900 CBMLS
- 2026-02-06 Listed $179,900 CBMLS
- 2026-02-01 Delisted — CBMLS
- 2025-11-25 Price Changed $184,900 CBMLS
- 2025-09-24 Listed $189,900 CBMLS
- 2021-09-01 Sold (Public Records) — Public Records
Property tax history
+3.6%/yrLatest (2025): $3,368 · +1.5% YoY. Source: county tax records.
Cash-flow waterfall
monthlySold comps — $/sqft
last 12 mo · ≤1 miLoading sold comps…