476 Masthead Rd · Mabank, TX
Flood risk 1/10 · Minimal
- FEMA flood zone
- X (unshaded)
- Chance of flooding over 30 yrs
- 0.0%
- Est. flood insurance / yr
- $507 – $1,088
Fire risk 3/10 · Minor
- Est. fire insurance / yr
- $1,222 – $2,270
Heat risk 7/10 · Major
- Hot days now (above 110°F)
- 7 days/yr
- Hot days in 30 yrs
- 25 days/yr
Wind risk 6/10 · Moderate
- Chance of severe wind over 30 yrs
- 66.0%
Air-quality risk 2/10 · Minimal
- Unhealthy air days now
- 0 days/yr
- Unhealthy air days in 30 yrs
- 1 days/yr
Risk factors via First Street. Map © Google.
Why this score? — see what drove the B- grade
The composite is a weighted blend of 9 inputs, each scored 0–100. Each bar is that input's sub-score; the figure is the points it added to the 100-point composite (weight × sub-score).
- Cash flow +30.0/30.0
- DSCR +10.0/10.0
- 1% rule +8.8/10.0
- ARV discount +7.5/15.0
- Schools +3.8/10.0
- Livability +3.5/5.0
- Condition / age +2.5/5.0
- Rent growth +1.1/5.0
- Appreciation +0.0/10.0
$115,000
🖨 Deal sheet (PDF) 📄 Offer letter ✓ Due diligence
Listing remarks MLS
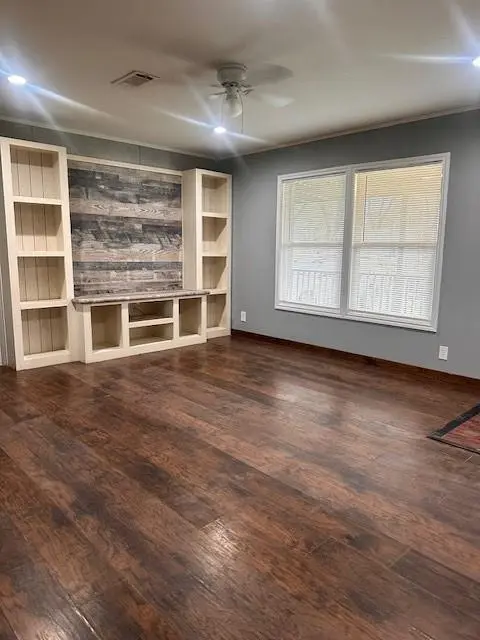
Welcome to Harbor Point! This nicely updated manufactured home has been fully remodeled and offers 3 bedrooms, 2 full baths, built-ins, ceiling fans, and a separate utility room. This all-electric home is conveniently located near the lake and features a wonderful front porch perfect for relaxing. Also has a carport.
Key facts
- 7,501 sq ft lot
- Parking
- Built 2019
Neighborhood map
What this means for you Summary
Snapshot
- This is a 3-bed/2.0-bath land listed at $115k.
Deal economics
- At list price, monthly cash flow is $587 ($7k/yr) — positive.
- The deal already cash-flows at list — no discount required.
- Meets the 1% rule at list price ($2k rent vs $115k).
- Recommended offer: $112k (3.0% below list) — sets the bar for market timing.
- Cap rate 12.4% vs local median 3.1% in Mabank — top-decile yield for the area; either an underpriced asset or a hidden risk that comps aren't pricing in. Stress-test before assuming the spread holds.
Location & tenants
- Location reads 69/100 on livability (#446 in TX) — a middle-class / working-renter tenant base. Strengths: cost of living A+, housing A+, crime B+; Watch: amenities F, commute F, employment D-.
- Mabank ISD (town): math 47% / reading 44% proficiency, ranked #273 of 826 in TX (top 33%) — families likely to look elsewhere, expect single-tenant / working-renter base with shorter leases.
- Zoned schools: Central El (math 48% / reading 42%, grade D-, #1,133 of 4,322 statewide, top 27%, 675 students, 64% FRL); Mabank Int (math 49% / reading 34%, grade F, #595 of 1,662 statewide, top 37%, 611 students, 66% FRL); Mabank H S (math 36% / reading 53%, grade F, #652 of 1,632 statewide, top 43%, 1,111 students, 57% FRL).
- Market conditions: Rents falling (-5.8%/yr); 705 active listings in the ZIP; 1 comparable units currently listed for rent nearby; 1,747 units permitted in Kaufman County in 2024 (180 in 5+ unit buildings).
- This rent runs 31% of the median local income ($61k/yr) — at the standard rent-burdened threshold; future hikes will face affordability resistance.
Forward outlook
- Local home prices are declining (-3.0%/yr); year-one equity from $795 of loan paydown is wiped out by about $3k of value loss. Plan a longer hold.
- Kaufman County population projected at +43% by 2050 — long-run rental-demand tailwind backs the buy-and-hold thesis.
- At projected returns (-3.0% appreciation + 0.0% rent growth), your $32k cash investment doubles in ~7 years — after that, you're playing with house money.
Negotiation context
- It's been on market 46 days — a 3% lower offer ($112k) is reasonable based on typical stale-listing flexibility.
Risks & watch-outs
- Climate carrying-cost: major wind risk, 66% chance of damaging wind over 30y; extreme-heat days projected 7→25/yr by 2055 (HVAC capex compounding) — expect insurance premiums to compound above CPI over the hold.
Questions for the listing agent
- It's been on market 46 days. Have you received any prior offers? Is the seller open to a 3% concession, seller financing, or rate buy-down credit?
- Is there a deadline driving the sale (1031 exchange, divorce, estate, relocation)? That informs how much negotiation room exists.
- What's the average days-on-market for RENTAL listings here right now (not sales)? A rising rental-DOM trend means longer vacancies and softer asking-rent achievability than the comps imply.
- What's the recent tenant-quality profile in this submarket — average credit score on applications, eviction rate, late-payment / NSF rate, and stable-employment percentage? A property-management company in the area should have these aggregated.
- How much new for-sale + rental construction is in the pipeline within 1–3 miles? Heavy new supply typically softens prices + rents 12–24 months out; constrained supply supports both.
Investment metrics
- 1% rule
- 1.38% ✓
- Cap rate
- 12.42%
- Cash-on-cash
- 21.87%
- DSCR
- 1.97
- GRM
- 6.0
CMA / ARV
- ARV (median comp)
- $115,000
- List price
- $115,000
- Delta
- —
- Verdict
- FAIR
- Comps
- 1 within 2.0 mi
Projected returns pro-forma
-3.0% appreciation · 0.0% rent growth · sell at horizon
- IRR
- 11.4%
- Equity multiple
- 1.44×
- Total profit
- $14,024
- Equity at exit
- $17,147
- IRR
- 18.1%
- Equity multiple
- 2.31×
- Total profit
- $42,104
- Equity at exit
- $9,943
Cash invested: $32,200 (down + closing). Projections, not guarantees.
Landlord ↔ Tenant lean methodology
- Overall (STATE)
- 87 Strongly Landlord-Friendly
- State Texas
- 87 Strongly Landlord-Friendly · R+5
- County
- — inherits STATE
- City
- — inherits STATE
ZIP-level market 75156
- Rents YoY
- -5.8%
- Active inventory
- 705
- Price-to-rent
- 6.0×
Monthly cashflow live
- Estimated rent
- $1,591 medium interval (Pro) →
- Mortgage (P&I)
- −$603
- Tax from tax record
- −$19 /mo · $230/yr
- Insurance
- −$48
- HOA
- −$0
- Vacancy / Maint / Mgmt
- −$334
- Net cashflow
- $587
Break-even live
Sensitivity live
| Price | -10% $652 | -5% $619 | +0% $587 | +5% $423 | +10% $383 |
|---|---|---|---|---|---|
| Rent | -10% $461 | -5% $524 | +0% $587 | +5% $650 | +10% $713 |
| Rate | -1.0pp $645 | -0.5pp $616 | base $587 | +0.5pp $557 | +1.0pp $527 |
UW: 25.0% down · 7.5% · 30yr · 1.5% tax · 5.0% vac · 8.0% maint · 8.0% mgmt
Financing live
Cash to close
- Down payment
- $28,750
- Closing costs
- $3,450
- Reserves months
- —
- Total cash needed
- —
Loan-product check · same deal, 3 products live
Conventional
25% down · 7.5% · 30yr
- Down + closing
- —
- Monthly P&I
- —
- Monthly cashflow
- —
- DSCR
- —
- Eligible?
- —
Personal DTI + credit; lowest rate.
DSCR
20% down · 8.5% · 30yr
- Down + closing
- —
- Monthly P&I
- —
- Monthly cashflow
- —
- DSCR
- —
- Eligible?
- —
No personal income docs; deal must DSCR.
Hard money
10% down · 12.0% · 12mo
- Down + closing
- —
- Monthly P&I
- —
- Monthly cashflow
- —
- DSCR
- —
- Eligible?
- —
Short-term bridge; refi at stabilization.
Rent comps 1 comps
| Address | Beds | Baths | Sqft | Rent | $/sqft | DOM | Units | Dist |
|---|---|---|---|---|---|---|---|---|
| 204 Wildflower Dr Gun Barrel City, TX | 3.0 | 2.0 | 1350 | $1,624 | $1.20 | 45d | 1 | 0.99mi |
Listing history 4 events
-
2026-05-05price $115,000 319-char remark
Show marketing remark (319 chars)
Welcome to Harbor Point! This nicely updated manufactured home has been fully remodeled and offers 3 bedrooms, 2 full baths, built-ins, ceiling fans, and a separate utility room. This all-electric home is conveniently located near the lake and features a wonderful front porch perfect for relaxing. Also has a carport.
-
2026-04-02$120,000 Active 319-char remark
Show marketing remark (319 chars)
Welcome to Harbor Point! This nicely updated manufactured home has been fully remodeled and offers 3 bedrooms, 2 full baths, built-ins, ceiling fans, and a separate utility room. This all-electric home is conveniently located near the lake and features a wonderful front porch perfect for relaxing. Also has a carport.
-
2024-05-22soldstatus
-
2024-05-22soldstatus
ⓘ Source: listings_history table (triggers on properties + properties_extension) + one-shot
backfill from property_details.listing_events for pre-trigger history.
Tax reassessment forecast TX · Resets to sale price
- Current annual tax
- $230 · $19/mo
- Projected year-2 tax
- $2,104 · $175/mo
- Expected delta
- +$1,874/yr (+$156/mo · 813.6%)
ⓘ Screening estimate from a state-policy table — verify with the county assessor before closing.
Climate risk First Street
- Flood 1/10 Low FEMA zone X (unshaded) · 0% chance over 30 yrs
- Wildfire 3/10 Moderate
- Heat 7/10 Severe 7 d/yr ≥110°F today · 25 d/yr by 30 yrs out
- Wind 6/10 Major 66% chance of damaging wind over 30 yrs
- Air quality 2/10 Low 0 unhealthy d/yr today · 1 by 30 yrs out
Nearby sold comps map
Loading sold comps map…
Walkable amenities ~0.75 mi
Loading nearby amenities…
Taxation est. · year 1
- Rental income
- $19,094
- − Mortgage interest
- −$6,442
- − Property taxes
- −$230
- − Insurance
- −$575
- − Repairs & maintenance
- −$1,527
- − Management
- −$1,527
- − Depreciation
- −$3,345
- Taxable income
- $5,446
- Est. tax owed @ 24.0%
- −$1,307
- After-tax cash flow
- $5,735/yr
For passive investors: Depreciation is non-cash, so a rental often shows a tax loss while cash-flowing — sheltering income. Rental losses are passive: they offset passive income freely, and up to $25,000/yr can offset ordinary (W-2) income if you actively participate and your MAGI is under $100k (phasing out to $0 by $150k); unused losses carry forward. On sale, claimed depreciation is recaptured at up to 25%, and gains may owe capital-gains tax (a 1031 exchange can defer both). Figures are a year-1 estimate at your 24.0% rate — not tax advice; consult a CPA.
Schools (NCES district)
- District
- Mabank ISD
- NCES district ID
- 4828680
- Math proficiency
- 47% ▼ -19.00%
- Reading proficiency
- 44% ▼ -11.00%
- Median HH income
- $40,321
- Composite
- 38.15/100
- National rank
- #4267
- State rank
- #273 of 826 in TX
Livability — Mabank
- Score
- 69/100
- State rank
- #446
- US rank
- #9068
Category grades
Schools grade is shown separately in the Schools card above.
Census & demographics
- County
- Henderson County · 34,977 people
- Metro
- Athens, TX
- Population (ZIP)
- 16,333
- Household income
- $60,867
- Rent vs Own
- Severe rent burden
- 400.0
Population outlook (Kaufman County) Hauer SSP2
- Today (2025)
- 138,716 people
- By 2030
- 150,815 · +8.7%
- By 2040
- 174,877 · +26.1%
- By 2050
- 198,020 · +42.8%
- By 2075
- 251,908 · +81.6%
- By 2100
- 285,325 · +105.7%
Race, ethnicity, and origin ACS 2023
- Neighborhood character
- Predominantly White (85%)
- Race & ethnicity
- White 85% Hispanic / Latino 7% Two or more races 7% Black 1%
- Hispanic origin (detail)
- Mexican 5%
- Common ancestry
- Slovak 3% Serbian 2% European 2%
- Foreign-born
- 4% · Canada, Jamaica
- Languages at home
- 94% English-only · Spanish 4% Other Indo-European 1%
Political lean MEDSL · Kaufman
- 2024 margin
- Strong R (+27.9) · D 35.6% · R 63.5%
- 2008→2024 swing
- +7.9pp toward D · 2008: -35.8pp · 2024: -27.9pp
- All cycles
- 2024: R+27.9 2020: R+33.9 2016: R+47.0 2012: R+44.4 2008: R+35.8
Not yet ingested
- Civics
- —
Market trends
- HPI YoY
- ▼ -216.77%
- Current HPI
- 199.8108
- Rent YoY
- ▼ -5.76%
- Metro
- Athens, TX
- State GDP YoY
- ▲ 3.95%
- F500 in state
- 110
Industry mix (Fortune 500 HQ in TX)
| Industry | F500 HQs | Revenue |
|---|---|---|
| Energy | 16 | $1,198B |
|
||
| Technology | 5 | $198B |
|
||
| Engineering / Construction | 4 | $72B |
|
||
| Energy Services | 3 | $60B |
|
||
| Utilities | 3 | $41B |
|
||
| Healthcare | 2 | $330B |
|
||
Price history
-4.2% since first listed4 events — show timeline
- 2026-05-05 Price Changed $115,000 NTREIS
- 2026-04-02 Listed $120,000 NTREIS
- 2024-05-22 Sold (Public Records) — Public Records
- 2024-05-22 Sold (Public Records) — Public Records
Property tax history
+4.9%/yrLatest (2025): $230 · -50.8% YoY. Source: county tax records.
Cash-flow waterfall
monthlySold comps — $/sqft
last 12 mo · ≤1 miLoading sold comps…