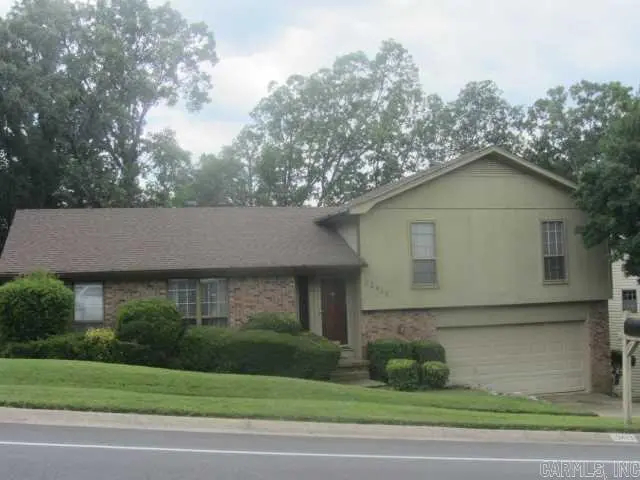
12413 Pleasant Forest Dr · Little Rock, AR
Flood risk 1/10 · Minimal
- FEMA flood zone
- X (unshaded)
- Chance of flooding over 30 yrs
- 0.0%
- Est. flood insurance / yr
- $507 – $1,088
Fire risk 1/10 · Minimal
- Est. fire insurance / yr
- $1,499 – $2,785
Heat risk 6/10 · Moderate
- Hot days now (above 110°F)
- 6 days/yr
- Hot days in 30 yrs
- 16 days/yr
Wind risk 4/10 · Minor
- Chance of severe wind over 30 yrs
- 10.0%
Air-quality risk 2/10 · Minimal
- Unhealthy air days now
- 0 days/yr
- Unhealthy air days in 30 yrs
- 1 days/yr
Risk factors via First Street. Map © Google.
Why this score? — see what drove the C grade
The composite is a weighted blend of 9 inputs, each scored 0–100. Each bar is that input's sub-score; the figure is the points it added to the 100-point composite (weight × sub-score).
- Cash flow +22.0/30.0
- ARV discount +15.0/15.0
- DSCR +7.0/10.0
- 1% rule +5.0/10.0
- Livability +3.7/5.0
- Rent growth +2.5/5.0
- Condition / age +2.5/5.0
- Schools +2.1/10.0
- Appreciation +0.0/10.0
$215,000
🖨 Deal sheet (PDF) 📄 Offer letter ✓ Due diligence
Listing remarks
This spacious home with HUGE fenced back yard is located just off Cantrall Road, west of i430 and is excellent for a first-time homeowner or a buyer looking for a great deal or an investor looking for their next big deal! This home is in great shape needing some touch up paint here and there and a couple of bad boards on the back deck replaced, that is pretty much it! Very well-maintained home! The sellers are elderly and do not have the means to make these repairs, so the home is being sold AS IS! Set your appointment to view this great West Little Rock home today and make your best offer, all offers will be considered! HURRY, this money saving deal will not last long! Agents see privat
Key facts
- Fenced back yard
- Well-maintained home
- Detached
Tags
Property features AI
Finance
- Financial info: Financing options include cash, FHA, conventional, and VA
Exterior
- Parking: Garage with auto door opener; Parking pads; 2-car capacity
- Utilities: Public sewer; Public water; Municipal electric (Entergy); Natural gas
- Home design: Brick and frame combo exterior
- Construction: Composition roof; Slab and crawlspace combination foundation
- Exterior features: Deck; Paved road access; Property inside city limits; Lot is level to sloped
Interior
- Kitchen: Free-standing stove; Microwave; Dishwasher; Garbage disposal
- Flooring: Tile flooring; Vinyl flooring
- Bathrooms: 2 full bathrooms
- Heating & cooling: Central heat (gas); Central cooling (electric)
- Interior features: Washer connection; Dryer connections (gas and electric); Gas water heater; Walk-in closet(s); Built-in cabinetry; Granite slab kitchen countertops; Wood-burning site-built fireplace; Paneling and sheetrock walls/ceilings
- Laundry & utility: Washer connection; Dryer connections (gas and electric)
Neighborhood map
What this means for you Summary
Snapshot
- This is a 3-bed/2.0-bath single-family listed at $215k.
Deal economics
- At list price, monthly cash flow is $341 ($4k/yr) — positive.
- The deal already cash-flows at list — no discount required.
- Meets the 1% rule at list price ($2k rent vs $215k).
- Recommended offer: $209k (3.0% below list) — sets the bar for market timing.
- Cap rate 8.2% vs local median 4.1% in Little Rock — top-decile yield for the area; either an underpriced asset or a hidden risk that comps aren't pricing in. Stress-test before assuming the spread holds.
Location & tenants
- Location reads 73/100 on livability (#22 in AR) — a middle-class / working-renter tenant base. Strengths: commute A+, cost of living A+, housing A+; Watch: crime F.
- Little Rock School District (urban): math 23% / reading 26% proficiency, ranked #183 of 238 in AR (top 77%) — low school quality limits family demand, transient renter base, plan for 1-2y turnover; 69% free/reduced lunch — lower-income household profile, screen leases tightly.
- Zoned schools: Don Roberts Elementary School (math 68% / reading 65%, grade B+, #19 of 454 statewide, top 4%, 1,004 students, 23% FRL) — zoned schools average 23% FRL vs 69% district-wide (46 pts lower); this property's tenant base skews higher-income than the district average.
- Zoned-school proficiency averages 66% at this address vs 24% district-wide (+42 pts) — the actual schools serving this property are materially stronger than the Little Rock School District average implies; a family-tenant draw the district grade alone would hide.
- Market conditions: 65 active listings in the ZIP; 8 comparable units currently listed for rent nearby; rentals at typical pace (median 25d on market — plan ~3-4 weeks tenant-placement turnaround); high-income renter base; 1,006 units permitted in Pulaski County in 2024 (0 in 5+ unit buildings).
Forward outlook
- Local home prices are declining (-3.0%/yr); year-one equity from $1k of loan paydown is wiped out by about $6k of value loss. Plan a longer hold.
- Pulaski County population projected at +6% by 2050 — modest demand growth; plan on rents tracking national, not racing it.
Negotiation context
- It's been on market 37 days — a 3% lower offer ($209k) is reasonable based on typical stale-listing flexibility.
Risks & watch-outs
- Climate carrying-cost: extreme-heat days projected 6→16/yr by 2055 (HVAC capex compounding) — expect insurance premiums to compound above CPI over the hold.
Questions for the listing agent
- It's been on market 37 days. Have you received any prior offers? Is the seller open to a 3% concession, seller financing, or rate buy-down credit?
- Built in 1975 — when were the roof, HVAC, electrical panel, plumbing, and water heater last replaced?
- Is there a deadline driving the sale (1031 exchange, divorce, estate, relocation)? That informs how much negotiation room exists.
- Crime grade is F in this area — have there been break-ins, vandalism, or insurance claims at this property in the last 3 years? What carrier currently insures it and at what premium?
- What's the average days-on-market for RENTAL listings here right now (not sales)? A rising rental-DOM trend means longer vacancies and softer asking-rent achievability than the comps imply.
- What's the recent tenant-quality profile in this submarket — average credit score on applications, eviction rate, late-payment / NSF rate, and stable-employment percentage? A property-management company in the area should have these aggregated.
- How much new for-sale + rental construction is in the pipeline within 1–3 miles? Heavy new supply typically softens prices + rents 12–24 months out; constrained supply supports both.
Investment metrics
- 1% rule
- 1.00% ✓
- Cap rate
- 8.20%
- Cash-on-cash
- 6.80%
- DSCR
- 1.30
- GRM
- 8.3
CMA / ARV
- ARV (on-the-fly)
- $304,790
- Comps found
- 12
Show comp detail 12 sales within ~0.75 mi
| Address | Dist | Beds/Ba | Sqft | Sold | Price | $/sf | Match |
|---|---|---|---|---|---|---|---|
| 12 Shawbridge | 0.34mi | 3/2.5 | 2,116 (+1%) | 2mo | $359,000 | $170 | 79 |
| 10 Cedar Branch Dr | 0.47mi | 3/2.5 | 2,098 (-0%) | 2mo | $335,000 | $160 | 74 |
| 18 Shawnee Forest Cv | 0.14mi | 3/2.5 | 2,310 (+10%) | 2mo | $295,000 | $128 | 74 |
| 11924 Pleasant Forest Dr | 0.29mi | 4/3.0 (+1) | 2,185 (+4%) | 1mo | $285,000 | $130 | 70 |
| 13115 Pleasant Forest Dr | 0.49mi | 3/2.5 | 2,156 (+3%) | 2mo | $280,000 | $130 | 70 |
| 4410 Sam Peck | 0.42mi | 3/2.0 | 1,950 (-7%) | 0mo | $290,000 | $149 | 68 |
| 2 Forest Maple Ct | 0.50mi | 3/2.5 | 2,190 (+4%) | 5mo | $280,000 | $128 | 63 |
| 13209 Pleasant Forest Dr | 0.54mi | 3/2.0 | 1,985 (-6%) | 3mo | $275,000 | $139 | 63 |
| 23 Inverness Cir | 0.41mi | 4/3.0 (+1) | 2,223 (+6%) | 4mo | $350,000 | $157 | 59 |
| 2 Forestwood Cv | 0.57mi | 3/2.5 | 2,275 (+8%) | 1mo | $330,000 | $145 | 57 |
| 13010 Pleasant Forest Dr | 0.41mi | 3/2.0 | 1,802 (-14%) | 2mo | $265,000 | $147 | 56 |
| 5 Christopher Cv | 0.61mi | 4/2.5 (+1) | 1,847 (-12%) | 2mo | $215,630 | $117 | 42 |
Match score weights: distance 35% · size 25% · config 20% · recency 20%. Top-matched comps best support the ARV.
Projected returns pro-forma
-3.0% appreciation · 3.0% rent growth · sell at horizon
- IRR
- -5.9%
- Equity multiple
- 0.78×
- Total profit
- $-13,167
- Equity at exit
- $32,057
- IRR
- 3.7%
- Equity multiple
- 1.27×
- Total profit
- $16,327
- Equity at exit
- $18,589
Cash invested: $60,200 (down + closing). Projections, not guarantees.
Landlord ↔ Tenant lean methodology
- Overall (STATE)
- 92 Strongly Landlord-Friendly
- State Arkansas
- 92 Strongly Landlord-Friendly · R+14
- County
- — inherits STATE
- City
- — inherits STATE
ZIP-level market 72212
- Active inventory
- 65
- Price-to-rent
- 8.3×
Monthly cashflow live
- Estimated rent
- $2,160 high interval (Pro) →
- Mortgage (P&I)
- −$1,127
- Tax from tax record
- −$149 /mo · $1,784/yr
- Insurance
- −$90
- HOA
- −$0
- Vacancy / Maint / Mgmt
- −$454
- Net cashflow
- $341
Break-even live
Sensitivity live
| Price | -10% $463 | -5% $402 | +0% $341 | +5% $280 | +10% $219 |
|---|---|---|---|---|---|
| Rent | -10% $170 | -5% $256 | +0% $341 | +5% $426 | +10% $512 |
| Rate | -1.0pp $449 | -0.5pp $396 | base $341 | +0.5pp $285 | +1.0pp $229 |
UW: 25.0% down · 7.5% · 30yr · 1.5% tax · 5.0% vac · 8.0% maint · 8.0% mgmt
Financing live
Cash to close
- Down payment
- $53,750
- Closing costs
- $6,450
- Reserves months
- —
- Total cash needed
- —
Loan-product check · same deal, 3 products live
Conventional
25% down · 7.5% · 30yr
- Down + closing
- —
- Monthly P&I
- —
- Monthly cashflow
- —
- DSCR
- —
- Eligible?
- —
Personal DTI + credit; lowest rate.
DSCR
20% down · 8.5% · 30yr
- Down + closing
- —
- Monthly P&I
- —
- Monthly cashflow
- —
- DSCR
- —
- Eligible?
- —
No personal income docs; deal must DSCR.
Hard money
10% down · 12.0% · 12mo
- Down + closing
- —
- Monthly P&I
- —
- Monthly cashflow
- —
- DSCR
- —
- Eligible?
- —
Short-term bridge; refi at stabilization.
Rent comps 8 comps
| Address | Beds | Baths | Sqft | Rent | $/sqft | DOM | Units | Dist |
|---|---|---|---|---|---|---|---|---|
| 3806 Cameo Dr Little Rock, AR | 3.0 | 2.0 | 1615 | $2,225 | $1.38 | 45d | 1 | 0.04mi |
| 13301 Pleasant Forest Dr Little Rock, AR | 3.0 | 2.0 | 1666 | $1,795 | $1.08 | 25d | 1 | 0.60mi |
| 11701 Southridge Dr Little Rock, AR | 3.0 | 2.0 | 1691 | $1,695 | $1.00 | 16d | 1 | 0.82mi |
| 8 Lisa Ct Little Rock, AR | 4.0 | 2.0 | 2072 | $1,995 | $0.96 | 25d | 1 | 1.24mi |
| 4800 Old Oak Dr Little Rock, AR | 3.0 | 2.5 | 1900 | $2,750 | $1.45 | 25d | 1 | 1.29mi |
| 10 Hampshire Cir Little Rock, AR | 3.0 | 2.0 | 1600 | $1,700 | $1.06 | 25d | 1 | 1.34mi |
| 32 Kingsbridge Way Little Rock, AR | 2.0 | 2.5 | 1430 | $2,000 | $1.40 | 45d | 1 | 1.37mi |
| 32 Kingsbridge Way Little Rock, AR | 2.0 | 2.5 | 1430 | $1,600 | $1.12 | 25d | 1 | 1.37mi |
Listing history 18 events
-
2026-06-21days on market $215,000 Active 37 DOM
-
2026-06-18days on market $215,000 Active 34 DOM
-
2026-06-17days on market $215,000 Active 33 DOM
-
2026-06-16days on market $215,000 Active 32 DOM
-
2026-06-15days on market $215,000 Active 31 DOM
-
2026-06-14days on market $215,000 Active 29 DOM
-
2026-06-13days on market $215,000 Active 28 DOM
-
2026-06-10days on market $215,000 Active 26 DOM
-
2026-06-09days on market $215,000 Active 25 DOM
-
2026-06-08days on market $215,000 Active 24 DOM
-
2026-06-07days on market $215,000 Active 23 DOM
-
2026-06-05days on market $215,000 Active 20 DOM
-
2026-06-03days on market $215,000 Active 19 DOM
-
2026-06-02days on market $215,000 Active 18 DOM
-
2026-06-01days on market $215,000 Active 17 DOM
-
2026-05-31days on market $215,000 Active 16 DOM
-
2026-05-31days on market $215,000 Active 15 DOM
-
2026-05-16$215,000 New Listing
ⓘ Source: listings_history table (triggers on properties + properties_extension) + one-shot
backfill from property_details.listing_events for pre-trigger history.
Tax reassessment forecast AR · Resets to sale price
- Current annual tax
- $1,784 · $149/mo
- Projected year-2 tax
- $1,784 · $149/mo
- Expected delta
- $0/yr ($0/mo · 0.0%)
ⓘ Screening estimate from a state-policy table — verify with the county assessor before closing.
Climate risk First Street
- Flood 1/10 Low FEMA zone X (unshaded) · 0% chance over 30 yrs
- Wildfire 1/10 Low
- Heat 6/10 Major 6 d/yr ≥110°F today · 16 d/yr by 30 yrs out
- Wind 4/10 Moderate 10% chance of damaging wind over 30 yrs
- Air quality 2/10 Low 0 unhealthy d/yr today · 1 by 30 yrs out
Nearby sold comps map
Loading sold comps map…
Walkable amenities ~0.75 mi
Loading nearby amenities…
Taxation est. · year 1
- Rental income
- $25,924
- − Mortgage interest
- −$12,043
- − Property taxes
- −$1,784
- − Insurance
- −$1,075
- − Repairs & maintenance
- −$2,074
- − Management
- −$2,074
- − Depreciation
- −$6,255
- Taxable income
- $619
- Est. tax owed @ 24.0%
- −$149
- After-tax cash flow
- $3,942/yr
For passive investors: Depreciation is non-cash, so a rental often shows a tax loss while cash-flowing — sheltering income. Rental losses are passive: they offset passive income freely, and up to $25,000/yr can offset ordinary (W-2) income if you actively participate and your MAGI is under $100k (phasing out to $0 by $150k); unused losses carry forward. On sale, claimed depreciation is recaptured at up to 25%, and gains may owe capital-gains tax (a 1031 exchange can defer both). Figures are a year-1 estimate at your 24.0% rate — not tax advice; consult a CPA.
Schools (NCES district)
- District
- Little Rock School District
- NCES district ID
- 0509000
- Math proficiency
- 23% ▼ -12.00%
- Reading proficiency
- 26% ▼ -8.00%
- Median HH income
- $43,346
- Composite
- 21.0/100
- National rank
- #8457
- State rank
- #183 of 238 in AR
Livability — Little Rock
- Score
- 73/100
- State rank
- #22
- US rank
- #5295
Category grades
Schools grade is shown separately in the Schools card above.
Census & demographics
- Census place
- Little Rock, AR
- County
- Pulaski County · 372,764 people
- City population
- 218,896
- Metro
- Little Rock-North Little Rock-Conway, AR
- Population (ZIP)
- 13,698
- Household income
- $114,140
- Rent vs Own
- Severe rent burden
- 101.0
Population outlook (Pulaski County) Hauer SSP2
- Today (2025)
- 415,378 people
- By 2030
- 423,720 · +2.0%
- By 2040
- 435,182 · +4.8%
- By 2050
- 440,904 · +6.1%
- By 2075
- 445,521 · +7.3%
- By 2100
- 419,173 · +0.9%
Race, ethnicity, and origin ACS 2023
- Neighborhood character
- Predominantly White (80%)
- Race & ethnicity
- White 80% Black 11% Two or more races 4% Hispanic / Latino 4% Asian 3%
- Common ancestry
- Portuguese 2% Italian 2% Lithuanian 2%
- Foreign-born
- 5% · Canada, China
- Languages at home
- 94% English-only · Spanish 3% Other Indo-European 1% Other Asian/Pacific 1%
Political lean MEDSL · Pulaski
- 2024 margin
- Strong D (+22.1) · D 59.8% · R 37.7% · Other 2.5%
- 2008→2024 swing
- +10.6pp toward D · 2008: 11.6pp · 2024: 22.1pp
- All cycles
- 2024: D+22.1 2020: D+22.5 2016: D+17.9 2012: D+11.4 2008: D+11.6
Not yet ingested
- Civics
- —
Market trends
- HPI YoY
- ▼ -154.02%
- Current HPI
- 204.889
- Rent YoY
- —
- Metro
- Little Rock-North Little Rock-Conway, AR
- State GDP YoY
- ▲ 3.80%
- F500 in state
- 10
Industry mix (Fortune 500 HQ in AR)
| Industry | F500 HQs | Revenue |
|---|---|---|
| Retail | 1 | $681B |
|
||
| Food / Agriculture | 1 | $53B |
|
||
| Retail / Energy | 1 | $22B |
|
||
| Transportation / Logistics | 1 | $12B |
|
||
| Energy | 1 | $4B |
|
||
Price history
1 event — show timeline
- 2026-05-16 Listed $215,000 CARMLS
Property tax history
-0.0%/yrLatest (2025): $1,784 · +0.0% YoY. Source: county tax records.
Cash-flow waterfall
monthlySold comps — $/sqft
last 12 mo · ≤1 miLoading sold comps…