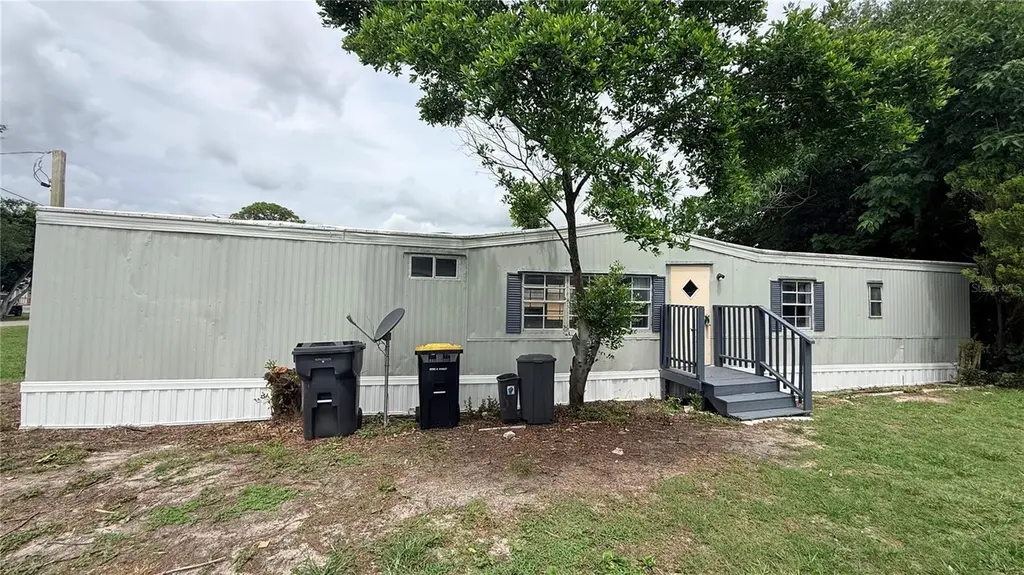
115 Whitfield St · Bradley Junction, FL
Flood risk 1/10 · Minimal
- FEMA flood zone
- X (unshaded)
- Chance of flooding over 30 yrs
- 0.0%
- Est. flood insurance / yr
- $507 – $1,088
Fire risk 6/10 · Moderate
- Est. fire insurance / yr
- $947 – $1,759
Heat risk 9/10 · Severe
- Hot days now (above 108°F)
- 7 days/yr
- Hot days in 30 yrs
- 25 days/yr
Wind risk 9/10 · Severe
- Chance of severe wind over 30 yrs
- 99.0%
Air-quality risk 2/10 · Minimal
- Unhealthy air days now
- 2 days/yr
- Unhealthy air days in 30 yrs
- 2 days/yr
Risk factors via First Street. Map © Google.
Why this score? — see what drove the C+ grade
The composite is a weighted blend of 9 inputs, each scored 0–100. Each bar is that input's sub-score; the figure is the points it added to the 100-point composite (weight × sub-score).
- Cash flow +27.2/30.0
- DSCR +9.5/10.0
- ARV discount +7.5/15.0
- 1% rule +6.7/10.0
- Schools +3.5/10.0
- Livability +3.1/5.0
- Rent growth +2.9/5.0
- Condition / age +2.5/5.0
- Appreciation +0.0/10.0
$129,500
🖨 Deal sheet (PDF) 📄 Offer letter ✓ Due diligence
Listing remarks
The cozy mobile home you've been waiting for has been beautifully updated and is ready for its new owner. Featuring refreshed bedrooms and bathroom, fresh exterior paint, and stylish new cabinetry, this home offers comfort, functionality, and modern appeal. Nestled in a peaceful and quiet neighborhood, it's the perfect place to enjoy a relaxed lifestyle while still being conveniently located near local amenities. Whether you're a first-time homebuyer, looking to downsize, or searching for a great rental investment opportunity, this property checks all the boxes. Don't let the square footage fool you, this home feels surprisingly spacious, bright, and welcoming. Schedule your showing today a
Key facts
- Updated
- Refreshed bedrooms
- New cabinetry
Tags
Property features AI
Exterior
- Utilities: Public water; Septic tank; Electricity connected; Cable available; High-speed internet available
- Home design: Single-wide mobile home; One story; East-facing
- Construction: Metal frame construction; Membrane roof; Crawlspace foundation; Built on a lot of about 0.19 acres
- Exterior features: Paved road access; Lot dimensions approximately 55 x 150
Interior
- Kitchen: Range; Refrigerator; Electric water heater
- Bedrooms: 2 bedrooms
- Flooring: Laminate; Vinyl
- Bathrooms: 1 full bathroom
- Heating & cooling: Ductless heating; Wall/window air conditioning units
- Interior features: Kitchen/family room combo
- Laundry & utility: Washer hookup; Electric dryer hookup
Neighborhood map
What this means for you Summary
Snapshot
- This is a 2-bed/1.0-bath manufactured listed at $130k.
Deal economics
- At list price, monthly cash flow is $371 ($4k/yr) — positive.
- The deal already cash-flows at list — no discount required.
- Meets the 1% rule at list price ($2k rent vs $130k).
Location & tenants
- Location reads 62/100 on livability (#756 in FL) — a middle-class / working-renter tenant base. Strengths: cost of living A+, housing A+, health & safety A+; Watch: crime D, amenities F, commute F.
- Polk (suburban): math 39% / reading 43% proficiency, ranked #62 of 73 in FL (top 85%) — families likely to look elsewhere, expect single-tenant / working-renter base with shorter leases.
- Zoned schools: James W. Sikes Elementary School (math 39% / reading 41%, grade F, #1,491 of 2,144 statewide, top 70%, 563 students, 37% FRL); Mulberry Middle School (math 35% / reading 39%, grade F, #399 of 571 statewide, top 71%, 1,200 students, 63% FRL); Mulberry Senior High School (math 21% / reading 36%, grade F, #458 of 667 statewide, top 69%, 1,315 students, 57% FRL).
- Market conditions: Rents rising (+1.6%/yr); 181 active listings in the ZIP; 10,384 units permitted in Polk County in 2024 (1,716 in 5+ unit buildings).
Forward outlook
- Local home prices are declining (-3.0%/yr); year-one equity from $895 of loan paydown is wiped out by about $4k of value loss. Plan a longer hold.
- Polk County population projected at +33% by 2050 — long-run rental-demand tailwind backs the buy-and-hold thesis.
Negotiation context
- Only 13 days on market — expect competitive offers; lowballing is unlikely to land.
- 4 sale attempts since 9y ago with the ask held roughly flat each time — persistent listings suggest the price (not the market) is what's stuck; bring a comps-based counter.
Risks & watch-outs
- Climate carrying-cost: severe wind risk, 99% chance of damaging wind over 30y; major wildfire risk; extreme-heat days projected 7→25/yr by 2055 (HVAC capex compounding) — expect insurance premiums to compound above CPI over the hold.
Questions for the listing agent
- Built in 1973 — when were the roof, HVAC, electrical panel, plumbing, and water heater last replaced?
- Is there a deadline driving the sale (1031 exchange, divorce, estate, relocation)? That informs how much negotiation room exists.
- Schools are F-rated, which usually means shorter tenancies and higher turnover. Who's the typical renter profile here, and what's been the actual vacancy rate?
- Crime grade is D in this area — have there been break-ins, vandalism, or insurance claims at this property in the last 3 years? What carrier currently insures it and at what premium?
- What's the average days-on-market for RENTAL listings here right now (not sales)? A rising rental-DOM trend means longer vacancies and softer asking-rent achievability than the comps imply.
- What's the recent tenant-quality profile in this submarket — average credit score on applications, eviction rate, late-payment / NSF rate, and stable-employment percentage? A property-management company in the area should have these aggregated.
- How much new for-sale + rental construction is in the pipeline within 1–3 miles? Heavy new supply typically softens prices + rents 12–24 months out; constrained supply supports both.
Investment metrics
- 1% rule
- 1.17% ✓
- Cap rate
- 9.73%
- Cash-on-cash
- 12.27%
- DSCR
- 1.55
- GRM
- 7.1
CMA / ARV
No comps found within radius.
Projected returns pro-forma
-3.0% appreciation · 1.59% rent growth · sell at horizon
- IRR
- 0.4%
- Equity multiple
- 1.01×
- Total profit
- $481
- Equity at exit
- $19,309
- IRR
- 8.6%
- Equity multiple
- 1.61×
- Total profit
- $22,281
- Equity at exit
- $11,197
Cash invested: $36,260 (down + closing). Projections, not guarantees.
Landlord ↔ Tenant lean methodology
- Overall (STATE)
- 87 Strongly Landlord-Friendly
- State Florida
- 87 Strongly Landlord-Friendly · R+3
- County
- — inherits STATE
- City
- — inherits STATE
ZIP-level market 33860
- Home prices YoY
- -22.4%
- Rents YoY
- 1.6%
- Active inventory
- 181
- Price-to-rent
- 7.1×
Monthly cashflow live
- Estimated rent
- $1,515 medium interval (Pro) →
- Mortgage (P&I)
- −$679
- Tax from tax record
- −$93 /mo · $1,117/yr
- Insurance
- −$54
- HOA
- −$0
- Vacancy / Maint / Mgmt
- −$318
- Net cashflow
- $371
Break-even live
Sensitivity live
| Price | -10% $444 | -5% $407 | +0% $371 | +5% $334 | +10% $297 |
|---|---|---|---|---|---|
| Rent | -10% $251 | -5% $311 | +0% $371 | +5% $430 | +10% $490 |
| Rate | -1.0pp $436 | -0.5pp $404 | base $371 | +0.5pp $337 | +1.0pp $303 |
UW: 25.0% down · 7.5% · 30yr · 1.5% tax · 5.0% vac · 8.0% maint · 8.0% mgmt
Financing live
Cash to close
- Down payment
- $32,375
- Closing costs
- $3,885
- Reserves months
- —
- Total cash needed
- —
Loan-product check · same deal, 3 products live
Conventional
25% down · 7.5% · 30yr
- Down + closing
- —
- Monthly P&I
- —
- Monthly cashflow
- —
- DSCR
- —
- Eligible?
- —
Personal DTI + credit; lowest rate.
DSCR
20% down · 8.5% · 30yr
- Down + closing
- —
- Monthly P&I
- —
- Monthly cashflow
- —
- DSCR
- —
- Eligible?
- —
No personal income docs; deal must DSCR.
Hard money
10% down · 12.0% · 12mo
- Down + closing
- —
- Monthly P&I
- —
- Monthly cashflow
- —
- DSCR
- —
- Eligible?
- —
Short-term bridge; refi at stabilization.
Listing history 9 events
-
2026-06-22days on market $129,500 Active 13 DOM
-
2026-06-18days on market $129,500 Active 10 DOM
-
2026-06-17days on market $129,500 Active 9 DOM
-
2026-06-16days on market $129,500 Active 8 DOM
-
2026-06-15days on market $129,500 Active 7 DOM
-
2026-06-13days on market $129,500 Active 5 DOM
-
2026-06-10days on market $129,500 Active 2 DOM
-
2026-06-08remarks 699-char remark
-
2026-06-08$129,500 Active 1 DOM
ⓘ Source: listings_history table (triggers on properties + properties_extension) + one-shot
backfill from property_details.listing_events for pre-trigger history.
Tax reassessment forecast FL · Resets to sale price
- Current annual tax
- $1,117 · $93/mo
- Projected year-2 tax
- $1,117 · $93/mo
- Expected delta
- $0/yr ($0/mo · 0.0%)
ⓘ Screening estimate from a state-policy table — verify with the county assessor before closing.
Climate risk First Street
- Flood 1/10 Low FEMA zone X (unshaded) · 0% chance over 30 yrs
- Wildfire 6/10 Major
- Heat 9/10 Extreme 7 d/yr ≥108°F today · 25 d/yr by 30 yrs out
- Wind 9/10 Extreme 99% chance of damaging wind over 30 yrs
- Air quality 2/10 Low 2 unhealthy d/yr today · 2 by 30 yrs out
Nearby sold comps map
Loading sold comps map…
Walkable amenities ~0.75 mi
Loading nearby amenities…
Taxation est. · year 1
- Rental income
- $18,178
- − Mortgage interest
- −$7,254
- − Property taxes
- −$1,117
- − Insurance
- −$648
- − Repairs & maintenance
- −$1,454
- − Management
- −$1,454
- − Depreciation
- −$3,767
- Taxable income
- $2,484
- Est. tax owed @ 24.0%
- −$596
- After-tax cash flow
- $3,851/yr
For passive investors: Depreciation is non-cash, so a rental often shows a tax loss while cash-flowing — sheltering income. Rental losses are passive: they offset passive income freely, and up to $25,000/yr can offset ordinary (W-2) income if you actively participate and your MAGI is under $100k (phasing out to $0 by $150k); unused losses carry forward. On sale, claimed depreciation is recaptured at up to 25%, and gains may owe capital-gains tax (a 1031 exchange can defer both). Figures are a year-1 estimate at your 24.0% rate — not tax advice; consult a CPA.
Schools (NCES district)
- District
- Polk
- NCES district ID
- 1201590
- Math proficiency
- 39% ▼ -11.00%
- Reading proficiency
- 43% ▼ -4.00%
- Median HH income
- $43,979
- Composite
- 34.74/100
- National rank
- #5132
- State rank
- #62 of 73 in FL
Livability — Bradley Junction
- Score
- 62/100
- State rank
- #756
- US rank
- #16624
Category grades
Schools grade is shown separately in the Schools card above.
Census & demographics
- County
- Polk County · 740,051 people
- City population
- 103
- Metro
- Lakeland-Winter Haven, FL
- Population (ZIP)
- 24,892
- Household income
- $65,710
- Rent vs Own
- Severe rent burden
- 583.0
Population outlook (Polk County) Hauer SSP2
- Today (2025)
- 752,975 people
- By 2030
- 804,621 · +6.9%
- By 2040
- 906,117 · +20.3%
- By 2050
- 1,000,476 · +32.9%
- By 2075
- 1,197,520 · +59.0%
- By 2100
- 1,271,518 · +68.9%
Race, ethnicity, and origin ACS 2023
- Neighborhood character
- Diverse neighborhood (Simpson 0.60)
- Race & ethnicity
- White 53% Hispanic / Latino 33% Two or more races 12% Black 10% Asian 1% Native American 1%
- Hispanic origin (detail)
- Mexican 19% Puerto Rican 7% Cuban 2%
- Common ancestry
- Lithuanian 2% Romanian 1% Slovak 1%
- Foreign-born
- 15% · Canada
- Languages at home
- 70% English-only · Spanish 28% Other Indo-European 1%
Political lean MEDSL · Polk
- 2024 margin
- Strong R (+20.7) · D 39.2% · R 59.9%
- 2008→2024 swing
- -14.6pp toward R · 2008: -6.1pp · 2024: -20.7pp
- All cycles
- 2024: R+20.7 2020: R+14.4 2016: R+14.1 2012: R+6.8 2008: R+6.1
Not yet ingested
- Civics
- —
Market trends
- HPI YoY
- ▼ -101.08%
- Current HPI
- 349.7266
- Rent YoY
- ▲ 1.59%
- Metro
- Lakeland-Winter Haven, FL
- State GDP YoY
- ▲ 3.28%
- F500 in state
- 36
Industry mix (Fortune 500 HQ in FL)
| Industry | F500 HQs | Revenue |
|---|---|---|
| Industrial Technology | 2 | $29B |
|
||
| Insurance | 2 | $17B |
|
||
| Retail | 1 | $60B |
|
||
| Technology Distribution | 1 | $58B |
|
||
| Homebuilding | 1 | $35B |
|
||
| Technology Manufacturing | 1 | $35B |
|
||
Price history
+547.5% since first listed13 events — show timeline
- 2026-06-08 Listed $129,500 Stellar MLS as Distributed by MLS Grid
- 2019-12-20 Listing Removed — Stellar MLS as Distributed by MLS Grid
- 2019-10-09 Price Changed $54,500 Stellar MLS as Distributed by MLS Grid
- 2019-09-13 Price Changed $54,900 Stellar MLS as Distributed by MLS Grid
- 2019-07-25 Price Changed $55,400 Stellar MLS as Distributed by MLS Grid
- 2019-07-04 Listed $55,500 Stellar MLS as Distributed by MLS Grid
- 2019-05-28 Listing Removed — Stellar MLS as Distributed by MLS Grid
- 2019-05-16 Price Changed $55,500 Stellar MLS as Distributed by MLS Grid
- 2019-04-15 Price Changed $55,700 Stellar MLS as Distributed by MLS Grid
- 2019-02-15 Price Changed $55,900 Stellar MLS as Distributed by MLS Grid
- 2018-12-14 Listed $58,000 Stellar MLS as Distributed by MLS Grid
- 2017-05-04 Listing Removed — MARMLS
- 2017-03-01 Listed $20,000 MARMLS
Property tax history
+15.2%/yrLatest (2025): $1,117 · +16.8% YoY. Source: county tax records.
Cash-flow waterfall
monthlySold comps — $/sqft
last 12 mo · ≤1 miLoading sold comps…