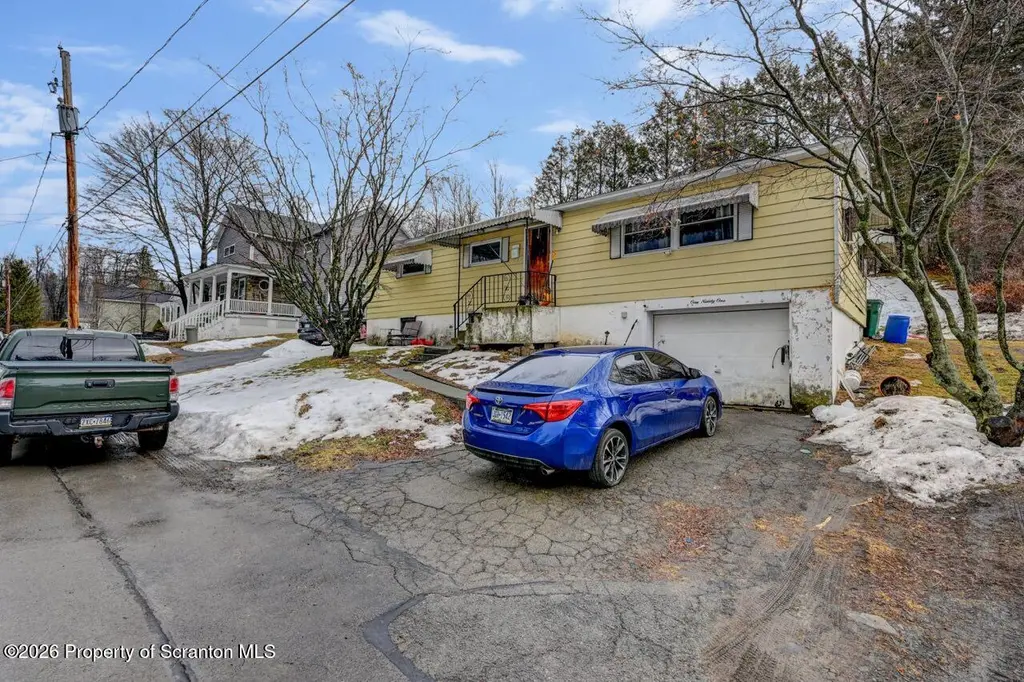
191 Poplar St · Archbald, PA
Flood risk 5/10 · Moderate
- FEMA flood zone
- X (unshaded)
- Chance of flooding over 30 yrs
- 0.24%
- Est. flood insurance / yr
- $473 – $860
Fire risk 1/10 · Minimal
- Est. fire insurance / yr
- $511 – $949
Heat risk 3/10 · Minor
- Hot days now (above 91°F)
- 8 days/yr
- Hot days in 30 yrs
- 18 days/yr
Wind risk 3/10 · Minor
- Chance of severe wind over 30 yrs
- 4.0%
Air-quality risk 2/10 · Minimal
- Unhealthy air days now
- 1 days/yr
- Unhealthy air days in 30 yrs
- 2 days/yr
Risk factors via First Street. Map © Google.
Why this score? — see what drove the B grade
The composite is a weighted blend of 9 inputs, each scored 0–100. Each bar is that input's sub-score; the figure is the points it added to the 100-point composite (weight × sub-score).
- Cash flow +28.5/30.0
- ARV discount +15.0/15.0
- DSCR +10.0/10.0
- 1% rule +7.9/10.0
- Schools +3.9/10.0
- Livability +3.7/5.0
- Rent growth +2.5/5.0
- Condition / age +2.5/5.0
- Appreciation +0.0/10.0
$99,900
🖨 Deal sheet (PDF) 📄 Offer letter ✓ Due diligence
Listing remarks MLS
Looking for a project? This mobile home needs some updating but offers a chance to create something special. Great opportunity in a fantastic neighborhood for buyers looking to downsize, landlords or flippers. One car garage and covered rear patio could be a plus, too!
Key facts
- One car garage
- Covered rear patio
- 9,147 sq ft lot
Tags
Neighborhood map
What this means for you Summary
Snapshot
- This is a 3-bed/1.5-bath single-family listed at $100k.
Deal economics
- At list price, monthly cash flow is $325 ($4k/yr) — positive.
- The deal already cash-flows at list — no discount required.
- Meets the 1% rule at list price ($1k rent vs $100k).
- Recommended offer: $91k (9.0% below list) — sets the bar for market timing.
- Cap rate 10.2% vs local median 2.6% in Archbald — top-decile yield for the area; either an underpriced asset or a hidden risk that comps aren't pricing in. Stress-test before assuming the spread holds.
Location & tenants
- Location reads 73/100 on livability (#596 in PA) — a middle-class / working-renter tenant base. Strengths: crime A+, cost of living A+, housing A+; Watch: amenities F, commute F.
- Valley View SD (rural): math 34% / reading 57% proficiency, ranked #269 of 539 in PA (top 50%) — families likely to look elsewhere, expect single-tenant / working-renter base with shorter leases.
- Market conditions: 69 active listings in the ZIP; 251 units permitted in Lackawanna County in 2024 (0 in 5+ unit buildings).
Forward outlook
- Local home prices are declining (-3.0%/yr); year-one equity from $691 of loan paydown is wiped out by about $3k of value loss. Plan a longer hold.
- Lackawanna County population projected to shrink 4% by 2050 — rents likely to lag national; underwrite the cash flow, not the appreciation.
- At projected returns (-3.0% appreciation + 3.0% rent growth), your $28k cash investment doubles in ~9 years — after that, you're playing with house money.
Negotiation context
- It's been on market 112 days — a 9% lower offer ($91k) is reasonable based on typical stale-listing flexibility.
- Current owner paid $42k; list at $100k implies a 135% gain — meaningful room to come down on a strong offer.
Risks & watch-outs
- Climate carrying-cost: moderate flood risk — expect insurance premiums to compound above CPI over the hold.
Questions for the listing agent
- It's been on market 112 days. Have you received any prior offers? Is the seller open to a 9% concession, seller financing, or rate buy-down credit?
- Built in 1970 — when were the roof, HVAC, electrical panel, plumbing, and water heater last replaced?
- Why hasn't it sold? Are there any deal-killer items the seller is aware of (foundation, flood, title, zoning, code violations)?
- Is there a deadline driving the sale (1031 exchange, divorce, estate, relocation)? That informs how much negotiation room exists.
- Schools are B-rated — typically a magnet for longer-tenancy family renters. What's the average tenant stay here, and is there a school-zone premium baked into asking?
- What's the average days-on-market for RENTAL listings here right now (not sales)? A rising rental-DOM trend means longer vacancies and softer asking-rent achievability than the comps imply.
- What's the recent tenant-quality profile in this submarket — average credit score on applications, eviction rate, late-payment / NSF rate, and stable-employment percentage? A property-management company in the area should have these aggregated.
- How much new for-sale + rental construction is in the pipeline within 1–3 miles? Heavy new supply typically softens prices + rents 12–24 months out; constrained supply supports both.
Investment metrics
- 1% rule
- 1.29% ✓
- Cap rate
- 10.20%
- Cash-on-cash
- 13.96%
- DSCR
- 1.62
- GRM
- 6.5
CMA / ARV
- ARV (median comp)
- $161,366
- List price
- $99,900
- Delta
- -38.09%
- Verdict
- UNDERPRICED
- Comps
- 20 within 1.0 mi
Show comp detail 12 sales within ~0.75 mi
| Address | Dist | Beds/Ba | Sqft | Sold | Price | $/sf | Match |
|---|---|---|---|---|---|---|---|
| 191 Ash St | 0.13mi | 2/1.5 (-1) | 1,094 (+4%) | 4mo | $194,000 | $177 | 80 |
| 430 Salem Rd | 0.17mi | 2/1.5 (-1) | 1,000 (-5%) | 4mo | $138,000 | $138 | 75 |
| 140 Cemetery St | 0.33mi | 2/1.0 (-1) | 1,075 (+2%) | 5mo | $90,000 | $84 | 70 |
| 203 Laurel St | 0.54mi | 3/1.0 | 1,052 (-0%) | 3mo | $80,000 | $76 | 70 |
| 169 Ash St | 0.17mi | 3/2.0 | 1,192 (+13%) | 7mo | $202,600 | $170 | 63 |
| 112 Pine St | 0.46mi | 3/2.5 | 1,000 (-5%) | 6mo | $207,500 | $208 | 60 |
| 206 Pike St | 0.38mi | 3/2.0 | 1,209 (+14%) | 1mo | $269,000 | $222 | 55 |
| 327 N Main St | 0.72mi | 3/1.0 | 1,010 (-4%) | 7mo | $75,000 | $74 | 51 |
| 107 Delaware St | 0.58mi | 3/1.0 | 1,115 (+6%) | 13mo | $242,500 | $217 | 51 |
| 492 Main St | 0.45mi | 3/2.5 | 1,200 (+14%) | 2mo | $136,000 | $113 | 50 |
| 602 N Main St | 0.63mi | 3/1.5 | 1,200 (+14%) | 1mo | $175,100 | $146 | 47 |
| 145 Monroe St | 0.48mi | 3/1.0 | 936 (-11%) | 14mo | $125,000 | $134 | 45 |
Match score weights: distance 35% · size 25% · config 20% · recency 20%. Top-matched comps best support the ARV.
Projected returns pro-forma
-3.0% appreciation · 3.0% rent growth · sell at horizon
- IRR
- 4.2%
- Equity multiple
- 1.16×
- Total profit
- $4,559
- Equity at exit
- $14,895
- IRR
- 13.7%
- Equity multiple
- 2.10×
- Total profit
- $30,740
- Equity at exit
- $8,638
Cash invested: $27,972 (down + closing). Projections, not guarantees.
Landlord ↔ Tenant lean methodology
- Overall (STATE)
- 62 Landlord-Friendly
- State Pennsylvania
- 62 Landlord-Friendly · EVEN
- County
- — inherits STATE
- City
- — inherits STATE
ZIP-level market 18403
- Active inventory
- 69
- Price-to-rent
- 6.5×
Monthly cashflow live
- Estimated rent
- $1,286 medium interval (Pro) →
- Mortgage (P&I)
- −$524
- Tax est. 1.5%
- −$125 /mo · $1,498/yr
- Insurance
- −$42
- HOA
- −$0
- Vacancy / Maint / Mgmt
- −$270
- Net cashflow
- $325
Break-even live
Sensitivity live
| Price | -10% $394 | -5% $360 | +0% $325 | +5% $291 | +10% $256 |
|---|---|---|---|---|---|
| Rent | -10% $224 | -5% $275 | +0% $325 | +5% $376 | +10% $427 |
| Rate | -1.0pp $376 | -0.5pp $351 | base $325 | +0.5pp $300 | +1.0pp $273 |
UW: 25.0% down · 7.5% · 30yr · 1.5% tax · 5.0% vac · 8.0% maint · 8.0% mgmt
Financing live
Cash to close
- Down payment
- $24,975
- Closing costs
- $2,997
- Reserves months
- —
- Total cash needed
- —
Loan-product check · same deal, 3 products live
Conventional
25% down · 7.5% · 30yr
- Down + closing
- —
- Monthly P&I
- —
- Monthly cashflow
- —
- DSCR
- —
- Eligible?
- —
Personal DTI + credit; lowest rate.
DSCR
20% down · 8.5% · 30yr
- Down + closing
- —
- Monthly P&I
- —
- Monthly cashflow
- —
- DSCR
- —
- Eligible?
- —
No personal income docs; deal must DSCR.
Hard money
10% down · 12.0% · 12mo
- Down + closing
- —
- Monthly P&I
- —
- Monthly cashflow
- —
- DSCR
- —
- Eligible?
- —
Short-term bridge; refi at stabilization.
Listing history 18 events
-
2026-06-18days on market $99,900 Active 112 DOM
-
2026-06-17days on market $99,900 Active 111 DOM
-
2026-06-16days on market $99,900 Active 110 DOM
-
2026-06-15days on market $99,900 Active 109 DOM
-
2026-06-14days on market $99,900 Active 107 DOM
-
2026-06-13days on market $99,900 Active 106 DOM
-
2026-06-10days on market $99,900 Active 104 DOM
-
2026-06-09days on market $99,900 Active 103 DOM
-
2026-06-08days on market $99,900 Active 102 DOM
-
2026-06-07days on market $99,900 Active 101 DOM
-
2026-06-03days on market $99,900 Active 97 DOM
-
2026-06-02days on market $99,900 Active 96 DOM
-
2026-06-01days on market $99,900 Active 95 DOM
-
2026-05-31days on market $99,900 Active 94 DOM
-
2026-05-30days on market $99,900 Active 93 DOM
-
2026-03-22price $99,900 269-char remark
Show marketing remark (269 chars)
Looking for a project? This mobile home needs some updating but offers a chance to create something special. Great opportunity in a fantastic neighborhood for buyers looking to downsize, landlords or flippers. One car garage and covered rear patio could be a plus, too!
-
2026-02-26$124,900 Active 269-char remark
Show marketing remark (269 chars)
Looking for a project? This mobile home needs some updating but offers a chance to create something special. Great opportunity in a fantastic neighborhood for buyers looking to downsize, landlords or flippers. One car garage and covered rear patio could be a plus, too!
-
2011-01-04soldstatus $42,500 341-char remark
Show marketing remark (341 chars)
Great Neighborhood, A little TLC and you can call this house your HOME!!! All Appliances included in ''As Is'' condition. All measurement are approximate. , Baths: 1 Bath Lev 1,Half Bath - Master, 1 Half Lev 1, Beds: 2+ Bed 1st, SqFt Fin - Main: 1152.00, SqFt Fin - 3rd: 0.00, Tax Information: Available, Dining Area: Y, SqFt Fin - 2nd: 0.00
ⓘ Source: listings_history table (triggers on properties + properties_extension) + one-shot
backfill from property_details.listing_events for pre-trigger history.
Climate risk First Street
- Flood 5/10 Major FEMA zone X (unshaded) · 24% chance over 30 yrs
- Wildfire 1/10 Low
- Heat 3/10 Moderate 8 d/yr ≥91°F today · 18 d/yr by 30 yrs out
- Wind 3/10 Moderate 4% chance of damaging wind over 30 yrs
- Air quality 2/10 Low 1 unhealthy d/yr today · 2 by 30 yrs out
Nearby sold comps map
Loading sold comps map…
Walkable amenities ~0.75 mi
Loading nearby amenities…
Taxation est. · year 1
- Rental income
- $15,430
- − Mortgage interest
- −$5,596
- − Property taxes
- −$1,498
- − Insurance
- −$500
- − Repairs & maintenance
- −$1,234
- − Management
- −$1,234
- − Depreciation
- −$2,906
- Taxable income
- $2,461
- Est. tax owed @ 24.0%
- −$591
- After-tax cash flow
- $3,315/yr
For passive investors: Depreciation is non-cash, so a rental often shows a tax loss while cash-flowing — sheltering income. Rental losses are passive: they offset passive income freely, and up to $25,000/yr can offset ordinary (W-2) income if you actively participate and your MAGI is under $100k (phasing out to $0 by $150k); unused losses carry forward. On sale, claimed depreciation is recaptured at up to 25%, and gains may owe capital-gains tax (a 1031 exchange can defer both). Figures are a year-1 estimate at your 24.0% rate — not tax advice; consult a CPA.
Schools (NCES district)
- District
- Valley View SD
- NCES district ID
- 4224650
- Math proficiency
- 34% ▼ -10.00%
- Reading proficiency
- 57% ▼ -12.00%
- Median HH income
- $45,562
- Composite
- 38.54/100
- National rank
- #4174
- State rank
- #269 of 539 in PA
Livability — Archbald
- Score
- 73/100
- State rank
- #596
- US rank
- #5675
Category grades
Schools grade is shown separately in the Schools card above.
Census & demographics
- Census place
- Archbald, PA
- City population
- 6,580
- Population (ZIP)
- 6,580
Population outlook (Lackawanna County) Hauer SSP2
- Today (2025)
- 210,652 people
- By 2030
- 208,623 · -1.0%
- By 2040
- 203,980 · -3.2%
- By 2050
- 201,069 · -4.5%
- By 2075
- 205,026 · -2.7%
- By 2100
- 210,851 · +0.1%
Race, ethnicity, and origin ACS 2023
- Neighborhood character
- Predominantly White (98%)
- Race & ethnicity
- White 98% Two or more races 1%
- Common ancestry
- Romanian 13% Scotch-Irish 6% Subsaharan African 1%
- Foreign-born
- 1%
Political lean MEDSL · Lackawanna
- 2024 margin
- Toss-up / Even · D 51.0% · R 48.3%
- 2008→2024 swing
- -23.2pp toward R · 2008: 26.0pp · 2024: 2.8pp
- All cycles
- 2024: D+2.8 2020: D+8.4 2016: D+3.4 2012: D+27.4 2008: D+26.0
Not yet ingested
- Civics
- —
Market trends
- HPI YoY
- ▼ -149.56%
- Current HPI
- 208.173
- Rent YoY
- —
- Metro
- —
- State GDP YoY
- ▲ 1.68%
- F500 in state
- 34
Industry mix (Fortune 500 HQ in PA)
| Industry | F500 HQs | Revenue |
|---|---|---|
| Healthcare | 2 | $309B |
|
||
| Insurance | 2 | $27B |
|
||
| Telecommunications / Media | 1 | $124B |
|
||
| Industrial Distribution | 1 | $22B |
|
||
| Financial Services | 1 | $20B |
|
||
| Chemicals / Materials | 1 | $18B |
|
||
Price history
+135.1% since first listed3 events — show timeline
- 2026-03-22 Price Changed $99,900 GSBR as distributed by MLS GRID
- 2026-02-26 Listed $124,900 GSBR as distributed by MLS GRID
- 2011-01-04 Sold (MLS) $42,500 GSBR as distributed by MLS GRID
Property tax history
+26.0%/yrLatest (2026): $25,242 · +880.8% YoY. Source: county tax records.
Cash-flow waterfall
monthlySold comps — $/sqft
last 12 mo · ≤1 miLoading sold comps…