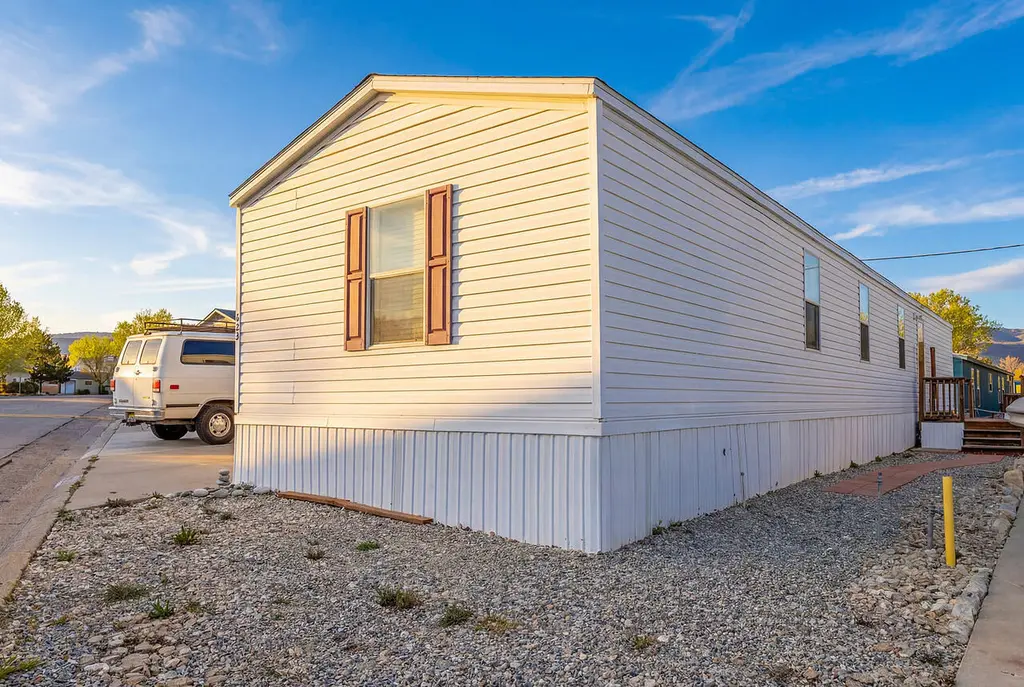
2025 E Jemez Rd #254 · Los Alamos, NM
Flood risk 1/10 · Minimal
- FEMA flood zone
- X (unshaded)
- Chance of flooding over 30 yrs
- 0.0%
- Est. flood insurance / yr
- $507 – $1,088
Fire risk 5/10 · Moderate
- Est. fire insurance / yr
- $706 – $1,312
Heat risk 2/10 · Minimal
- Hot days now (above 88°F)
- 7 days/yr
- Hot days in 30 yrs
- 20 days/yr
Wind risk 1/10 · Minimal
- Chance of severe wind over 30 yrs
- —
Air-quality risk 6/10 · Moderate
- Unhealthy air days now
- 11 days/yr
- Unhealthy air days in 30 yrs
- 13 days/yr
Risk factors via First Street. Map © Google.
Why this score? — see what drove the B grade
The composite is a weighted blend of 9 inputs, each scored 0–100. Each bar is that input's sub-score; the figure is the points it added to the 100-point composite (weight × sub-score).
- Cash flow +30.0/30.0
- 1% rule +10.0/10.0
- DSCR +10.0/10.0
- ARV discount +8.0/15.0
- Schools +6.4/10.0
- Livability +4.0/5.0
- Rent growth +2.5/5.0
- Condition / age +2.5/5.0
- Appreciation +0.0/10.0
$95,000
🖨 Deal sheet (PDF) 📄 Offer letter ✓ Due diligence
Listing remarks MLS
Updated 2005 Fleetwood just 1 mile from LANL! Major updates include updated flooring, remodeled master bed and bath with pecan wood floors, refreshed kitchen counters/sink, and newer water heater (2022) HVAC, sealed skirting. Enjoy newer front and back decks, storm door, and completed xeriscaping. Features include ceiling fans, whirlpool appliances, GE stove (2021) washer and dryer will convey. Well maintained! Come see this opportunity!
Key facts
- Whirlpool appliances
- Updated flooring
- Built 2005
Tags
Neighborhood map
What this means for you Summary
Snapshot
- This is a 3-bed/2.0-bath manufactured listed at $95k.
Deal economics
- At list price, monthly cash flow is $2k ($20k/yr) — positive.
- The deal already cash-flows at list — no discount required.
- Meets the 1% rule at list price ($3k rent vs $95k).
- Recommended offer: $89k (6.0% below list) — sets the bar for market timing.
Location & tenants
- Location reads 81/100 on livability (#2 in NM, #1,377 nationally) — a professional / high-income tenant draw. Strengths: crime A+, employment A+, housing A+; Watch: amenities F, commute F.
- Los Alamos Public Schools (town): math 61% / reading 78% proficiency, ranked #2 of 29 in NM (top 7%) — acceptable for families but not a draw, mixed tenant base, ~2y average lease; only 10% free/reduced lunch — higher-income household profile.
- Market conditions: 46 active listings in the ZIP; 6 comparable units currently listed for rent nearby; rentals at typical pace (median 20d on market — plan ~3-4 weeks tenant-placement turnaround); high-income renter base; 14 units permitted in Los Alamos County in 2024 (0 in 5+ unit buildings).
Forward outlook
- Local home prices are declining (-3.0%/yr); year-one equity from $657 of loan paydown is wiped out by about $3k of value loss. Plan a longer hold.
- Los Alamos County population projected at +12% by 2050 — modest demand growth; plan on rents tracking national, not racing it.
- At projected returns (-3.0% appreciation + 3.0% rent growth), your $27k cash investment doubles in ~2 years — after that, you're playing with house money.
Negotiation context
- It's been on market 68 days — a 6% lower offer ($89k) is reasonable based on typical stale-listing flexibility.
Risks & watch-outs
- Climate carrying-cost: moderate wildfire risk — expect insurance premiums to compound above CPI over the hold.
Questions for the listing agent
- It's been on market 68 days. Have you received any prior offers? Is the seller open to a 6% concession, seller financing, or rate buy-down credit?
- Why hasn't it sold? Are there any deal-killer items the seller is aware of (foundation, flood, title, zoning, code violations)?
- Is there a deadline driving the sale (1031 exchange, divorce, estate, relocation)? That informs how much negotiation room exists.
- Schools are B-rated — typically a magnet for longer-tenancy family renters. What's the average tenant stay here, and is there a school-zone premium baked into asking?
- What's the average days-on-market for RENTAL listings here right now (not sales)? A rising rental-DOM trend means longer vacancies and softer asking-rent achievability than the comps imply.
- What's the recent tenant-quality profile in this submarket — average credit score on applications, eviction rate, late-payment / NSF rate, and stable-employment percentage? A property-management company in the area should have these aggregated.
- How much new for-sale + rental construction is in the pipeline within 1–3 miles? Heavy new supply typically softens prices + rents 12–24 months out; constrained supply supports both.
Investment metrics
- 1% rule
- 3.13% ✓
- Cap rate
- 27.69%
- Cash-on-cash
- 76.41%
- DSCR
- 4.40
- GRM
- 2.7
CMA / ARV
- ARV (median comp)
- $96,000
- List price
- $95,000
- Delta
- -1.04%
- Verdict
- FAIR
- Comps
- 1 within 2.0 mi
Show comp detail 1 sale within ~0.75 mi
| Address | Dist | Beds/Ba | Sqft | Sold | Price | $/sf | Match |
|---|---|---|---|---|---|---|---|
| 2025 E Jemez Rd #151 | 0.09mi | 3/2.0 | 1,152 (+3%) | 19mo | $150,000 | $130 | 75 |
Match score weights: distance 35% · size 25% · config 20% · recency 20%. Top-matched comps best support the ARV.
Projected returns pro-forma
-3.0% appreciation · 3.0% rent growth · sell at horizon
- IRR
- 76.4%
- Equity multiple
- 4.48×
- Total profit
- $92,526
- Equity at exit
- $14,165
- IRR
- 80.0%
- Equity multiple
- 9.26×
- Total profit
- $219,658
- Equity at exit
- $8,214
Cash invested: $26,600 (down + closing). Projections, not guarantees.
Landlord ↔ Tenant lean methodology
- Overall (STATE)
- 55 Moderately Landlord-Leaning
- State New Mexico
- 55 Moderately Landlord-Leaning · D+3
- County
- — inherits STATE
- City
- — inherits STATE
ZIP-level market 87544
- Active inventory
- 46
- Price-to-rent
- 2.7×
Monthly cashflow live
- Estimated rent
- $2,975 high interval (Pro) →
- Mortgage (P&I)
- −$498
- Tax est. 1.5%
- −$119 /mo · $1,425/yr
- Insurance
- −$40
- HOA
- −$0
- Vacancy / Maint / Mgmt
- −$625
- Net cashflow
- $1,694
Break-even live
Sensitivity live
| Price | -10% $1,759 | -5% $1,727 | +0% $1,694 | +5% $1,661 | +10% $1,628 |
|---|---|---|---|---|---|
| Rent | -10% $1,459 | -5% $1,576 | +0% $1,694 | +5% $1,811 | +10% $1,929 |
| Rate | -1.0pp $1,742 | -0.5pp $1,718 | base $1,694 | +0.5pp $1,669 | +1.0pp $1,644 |
UW: 25.0% down · 7.5% · 30yr · 1.5% tax · 5.0% vac · 8.0% maint · 8.0% mgmt
Financing live
Cash to close
- Down payment
- $23,750
- Closing costs
- $2,850
- Reserves months
- —
- Total cash needed
- —
Loan-product check · same deal, 3 products live
Conventional
25% down · 7.5% · 30yr
- Down + closing
- —
- Monthly P&I
- —
- Monthly cashflow
- —
- DSCR
- —
- Eligible?
- —
Personal DTI + credit; lowest rate.
DSCR
20% down · 8.5% · 30yr
- Down + closing
- —
- Monthly P&I
- —
- Monthly cashflow
- —
- DSCR
- —
- Eligible?
- —
No personal income docs; deal must DSCR.
Hard money
10% down · 12.0% · 12mo
- Down + closing
- —
- Monthly P&I
- —
- Monthly cashflow
- —
- DSCR
- —
- Eligible?
- —
Short-term bridge; refi at stabilization.
Rent comps 6 comps
| Address | Beds | Baths | Sqft | Rent | $/sqft | DOM | Units | Dist |
|---|---|---|---|---|---|---|---|---|
| 505 Oppenheimer Dr #212 Los Alamos, NM | 2.0 | 2.0 | 972 | $2,450 | $2.52 | 44d | 1 | 0.59mi |
| 1300 Iris St #203 Los Alamos, NM | 2.0 | 2.0 | 1000 | $2,400 | $2.40 | 20d | 1 | 0.70mi |
| 55 Verde Ridge St Unit B Los Alamos, NM | 2.0 | 1.5 | 1134 | $2,400 | $2.12 | 20d | 1 | 0.79mi |
| 1926 24th St Los Alamos, NM | 2.0 | 1.0 | 900 | $1,920 | $2.13 | 2d | 1 | 0.83mi |
| 141 36th St Los Alamos, NM | 2.0–3.0 | 2.0 | 1241 | $4,625 | $3.73 | 2d | 89 | 0.93mi |
| 340 Rim Rd Unit 340-B Los Alamos, NM | 2.0 | 1.0 | 1460 | $3,500 | $2.40 | 11d | 1 | 1.10mi |
Listing history 18 events
-
2026-06-21days on market $95,000 Active 68 DOM
-
2026-06-19days on market $95,000 Active 66 DOM
-
2026-06-18days on market $95,000 Active 65 DOM
-
2026-06-17days on market $95,000 Active 64 DOM
-
2026-06-16days on market $95,000 Active 63 DOM
-
2026-06-15days on market $95,000 Active 62 DOM
-
2026-06-14days on market $95,000 Active 60 DOM
-
2026-06-12days on market $95,000 Active 59 DOM
-
2026-06-09days on market $95,000 Active 56 DOM
-
2026-06-08days on market $95,000 Active 55 DOM
-
2026-06-07days on market $95,000 Active 54 DOM
-
2026-06-07days on market $95,000 Active 53 DOM
-
2026-06-04days on market $95,000 Active 50 DOM
-
2026-06-02days on market $95,000 Active 49 DOM
-
2026-06-01days on market $95,000 Active 48 DOM
-
2026-05-31days on market $95,000 Active 47 DOM
-
2026-05-31days on market $95,000 Active 46 DOM
-
2026-04-07$95,000 Active 441-char remark
Show marketing remark (441 chars)
Updated 2005 Fleetwood just 1 mile from LANL! Major updates include updated flooring, remodeled master bed and bath with pecan wood floors, refreshed kitchen counters/sink, and newer water heater (2022) HVAC, sealed skirting. Enjoy newer front and back decks, storm door, and completed xeriscaping. Features include ceiling fans, whirlpool appliances, GE stove (2021) washer and dryer will convey. Well maintained! Come see this opportunity!
ⓘ Source: listings_history table (triggers on properties + properties_extension) + one-shot
backfill from property_details.listing_events for pre-trigger history.
Climate risk First Street
- Flood 1/10 Low FEMA zone X (unshaded) · 0% chance over 30 yrs
- Wildfire 5/10 Major
- Heat 2/10 Low 7 d/yr ≥88°F today · 20 d/yr by 30 yrs out
- Wind 1/10 Low
- Air quality 6/10 Major 11 unhealthy d/yr today · 13 by 30 yrs out
Nearby sold comps map
Loading sold comps map…
Walkable amenities ~0.75 mi
Loading nearby amenities…
Taxation est. · year 1
- Rental income
- $35,700
- − Mortgage interest
- −$5,321
- − Property taxes
- −$1,425
- − Insurance
- −$475
- − Repairs & maintenance
- −$2,856
- − Management
- −$2,856
- − Depreciation
- −$2,764
- Taxable income
- $20,003
- Est. tax owed @ 24.0%
- −$4,801
- After-tax cash flow
- $15,524/yr
For passive investors: Depreciation is non-cash, so a rental often shows a tax loss while cash-flowing — sheltering income. Rental losses are passive: they offset passive income freely, and up to $25,000/yr can offset ordinary (W-2) income if you actively participate and your MAGI is under $100k (phasing out to $0 by $150k); unused losses carry forward. On sale, claimed depreciation is recaptured at up to 25%, and gains may owe capital-gains tax (a 1031 exchange can defer both). Figures are a year-1 estimate at your 24.0% rate — not tax advice; consult a CPA.
Schools (NCES district)
- District
- Los Alamos Public Schools
- NCES district ID
- 3501650
- Math proficiency
- 61% ▲ 14.00%
- Reading proficiency
- 78% ▲ 20.00%
- Median HH income
- $104,436
- Composite
- 64.09/100
- National rank
- #577
- State rank
- #2 of 29 in NM
Livability — Los Alamos
- Score
- 81/100
- State rank
- #2
- US rank
- #1377
Category grades
Schools grade is shown separately in the Schools card above.
Census & demographics
- County
- Los Alamos County · 13,598 people
- City population
- 13,598
- Metro
- Los Alamos, NM
- Population (ZIP)
- 13,598
- Household income
- $138,583
- Rent vs Own
- Severe rent burden
- 43.0
Population outlook (Los Alamos County) Hauer SSP2
- Today (2025)
- 17,874 people
- By 2030
- 18,157 · +1.6%
- By 2040
- 19,073 · +6.7%
- By 2050
- 20,010 · +12.0%
- By 2075
- 22,686 · +26.9%
- By 2100
- 23,523 · +31.6%
Race, ethnicity, and origin ACS 2023
- Neighborhood character
- Predominantly White (68%)
- Race & ethnicity
- White 68% Hispanic / Latino 19% Two or more races 11% Asian 7% Black 1%
- Hispanic origin (detail)
- Mexican 11%
- Common ancestry
- Italian 4% Slovak 4% Romanian 3%
- Foreign-born
- 14% · China, Canada, South Korea
- Languages at home
- 79% English-only · Spanish 9% Chinese 4% Other Indo-European 2%
Political lean MEDSL · Los Alamos
- 2024 margin
- Solid D (+30.2) · D 63.4% · R 33.2% · Other 3.4%
- 2008→2024 swing
- +23.3pp toward D · 2008: 6.9pp · 2024: 30.2pp
- All cycles
- 2024: D+30.2 2020: D+26.6 2016: D+20.3 2012: D+3.7 2008: D+6.9
Not yet ingested
- Civics
- —
Market trends
- HPI YoY
- ▼ -377.45%
- Current HPI
- 192.7096
- Rent YoY
- —
- Metro
- Los Alamos, NM
- State GDP YoY
- —
- F500 in state
- 0
Price history
1 event — show timeline
- 2026-04-07 Listed $95,000 Southwest MLS
Cash-flow waterfall
monthlySold comps — $/sqft
last 12 mo · ≤1 miLoading sold comps…