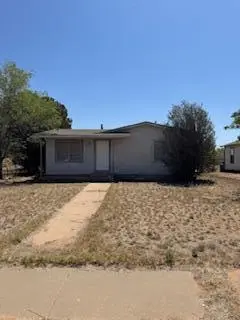
2409 Cedar Ave · Lubbock, TX
Flood risk 1/10 · Minimal
- FEMA flood zone
- X (unshaded)
- Chance of flooding over 30 yrs
- 0.0%
- Est. flood insurance / yr
- $507 – $1,088
Fire risk 4/10 · Minor
- Est. fire insurance / yr
- $1,222 – $2,270
Heat risk 5/10 · Moderate
- Hot days now (above 100°F)
- 7 days/yr
- Hot days in 30 yrs
- 21 days/yr
Wind risk 2/10 · Minimal
- Chance of severe wind over 30 yrs
- —
Air-quality risk 2/10 · Minimal
- Unhealthy air days now
- 1 days/yr
- Unhealthy air days in 30 yrs
- 1 days/yr
Risk factors via First Street. Map © Google.
Why this score? — see what drove the B+ grade
The composite is a weighted blend of 9 inputs, each scored 0–100. Each bar is that input's sub-score; the figure is the points it added to the 100-point composite (weight × sub-score).
- Cash flow +30.0/30.0
- 1% rule +10.0/10.0
- DSCR +10.0/10.0
- ARV discount +7.5/15.0
- Appreciation +6.6/10.0
- Livability +4.0/5.0
- Schools +3.1/10.0
- Rent growth +2.5/5.0
- Condition / age +2.5/5.0
$29,000
🖨 Deal sheet (PDF) 📄 Offer letter ✓ Due diligence
Listing remarks
Calling all INVESTORS! 2 Bedroom, 1 Bathroom home is priced to sell AS IS thousands below tax value. Ready for Immediate Possession!
Key facts
- 7,000 sq ft lot
- Built 1954
- Listed 12 days
Property features AI
Finance
- Financial info: Annual tax listed
Exterior
- Parking: Street parking
- Utilities: Paved road access
- Home design: Single-family residence; Residential property; Fixer condition
- Construction: Built with other construction materials; Pillar/post/pier foundation
- Exterior features: No notable exterior features listed; Composition roof
Interior
- Bathrooms: 1 full bathroom
- Heating & cooling: Wall/window air conditioning unit(s); Space heater
- Interior features: See remarks
Neighborhood map
What this means for you Summary
Snapshot
- This is a 2-bed/1.0-bath single-family listed at $29k.
Deal economics
- At list price, monthly cash flow is $460 ($6k/yr) — positive.
- The deal already cash-flows at list — no discount required.
- Meets the 1% rule at list price ($862 rent vs $29k).
Location & tenants
- Location reads 80/100 on livability (#37 in TX, #1,749 nationally) — a professional / high-income tenant draw. Strengths: commute A+, cost of living A+, housing A+; Watch: employment C-, crime F.
- Lubbock ISD (urban): math 36% / reading 39% proficiency, ranked #481 of 826 in TX (top 58%) — families likely to look elsewhere, expect single-tenant / working-renter base with shorter leases; 60% free/reduced lunch — lower-income household profile, screen leases tightly.
- Zoned schools: Ervin El (math 17% / reading 17%, grade F, #3,836 of 4,322 statewide, top 91%, 405 students, 97% FRL, charter); Dunbar College Preparatory Academy (math 16% / reading 20%, grade F, #1,491 of 1,662 statewide, top 91%, 430 students, 97% FRL, charter); Estacado H S (math 26% / reading 29%, grade F, #1,183 of 1,632 statewide, top 73%, 897 students, 90% FRL) — zoned schools average 95% FRL vs 60% district-wide (35 pts higher); higher-poverty schools than district average — tighter screening recommended.
- Zoned-school proficiency averages 21% at this address vs 38% district-wide (-17 pts) — the specific schools serving this property underperform the Lubbock ISD average; the district grade overstates school quality for this exact location.
- Market conditions: 93 active listings in the ZIP; 27 comparable units currently listed for rent nearby; rentals lingering (median 45d on market — plan ~5-8 weeks vacancy on turnover, expect pricing pressure); 56% of comp listings sitting > 30 days — soft ceiling on asking rent; 2,219 units permitted in Lubbock County in 2024 (252 in 5+ unit buildings).
Forward outlook
- In year one you build about $1k of equity ($200 loan paydown + $935 appreciation (3.2% local appreciation)).
- Lubbock County population projected at +39% by 2050 — long-run rental-demand tailwind backs the buy-and-hold thesis.
- At projected returns (3.2% appreciation + 3.0% rent growth), your $8k cash investment doubles in ~2 years — after that, you're playing with house money.
Negotiation context
- Only 12 days on market — expect competitive offers; lowballing is unlikely to land.
Risks & watch-outs
- Watch-outs: built in 1954 — expect roof / HVAC / electrical / plumbing capex.
- Climate carrying-cost: extreme-heat days projected 7→21/yr by 2055 (HVAC capex compounding) — expect insurance premiums to compound above CPI over the hold.
Questions for the listing agent
- Built in 1954 — when were the roof, HVAC, electrical panel, plumbing, and water heater last replaced?
- Is there a deadline driving the sale (1031 exchange, divorce, estate, relocation)? That informs how much negotiation room exists.
- Schools are D-rated, which usually means shorter tenancies and higher turnover. Who's the typical renter profile here, and what's been the actual vacancy rate?
- Crime grade is F in this area — have there been break-ins, vandalism, or insurance claims at this property in the last 3 years? What carrier currently insures it and at what premium?
- What's the average days-on-market for RENTAL listings here right now (not sales)? A rising rental-DOM trend means longer vacancies and softer asking-rent achievability than the comps imply.
- What's the recent tenant-quality profile in this submarket — average credit score on applications, eviction rate, late-payment / NSF rate, and stable-employment percentage? A property-management company in the area should have these aggregated.
- How much new for-sale + rental construction is in the pipeline within 1–3 miles? Heavy new supply typically softens prices + rents 12–24 months out; constrained supply supports both.
Investment metrics
- 1% rule
- 2.97% ✓
- Cap rate
- 25.34%
- Cash-on-cash
- 68.01%
- DSCR
- 4.03
- GRM
- 2.8
CMA / ARV
No comps found within radius.
Projected returns pro-forma
3.22% appreciation · 3.0% rent growth · sell at horizon
- IRR
- 72.9%
- Equity multiple
- 5.09×
- Total profit
- $33,175
- Equity at exit
- $13,406
- IRR
- 72.3%
- Equity multiple
- 10.44×
- Total profit
- $76,638
- Equity at exit
- $20,950
Cash invested: $8,120 (down + closing). Projections, not guarantees.
Landlord ↔ Tenant lean methodology
- Overall (STATE)
- 87 Strongly Landlord-Friendly
- State Texas
- 87 Strongly Landlord-Friendly · R+5
- County
- — inherits STATE
- City
- — inherits STATE
ZIP-level market 79404
- Home prices YoY
- 2.0%
- Active inventory
- 93
- Price-to-rent
- 2.8×
Monthly cashflow live
- Estimated rent
- $862 high interval (Pro) →
- Mortgage (P&I)
- −$152
- Tax from tax record
- −$57 /mo · $679/yr
- Insurance
- −$12
- HOA
- −$0
- Vacancy / Maint / Mgmt
- −$181
- Net cashflow
- $460
Break-even live
Sensitivity live
| Price | -10% $477 | -5% $468 | +0% $460 | +5% $452 | +10% $444 |
|---|---|---|---|---|---|
| Rent | -10% $392 | -5% $426 | +0% $460 | +5% $494 | +10% $528 |
| Rate | -1.0pp $475 | -0.5pp $468 | base $460 | +0.5pp $453 | +1.0pp $445 |
UW: 25.0% down · 7.5% · 30yr · 1.5% tax · 5.0% vac · 8.0% maint · 8.0% mgmt
Financing live
Cash to close
- Down payment
- $7,250
- Closing costs
- $870
- Reserves months
- —
- Total cash needed
- —
Loan-product check · same deal, 3 products live
Conventional
25% down · 7.5% · 30yr
- Down + closing
- —
- Monthly P&I
- —
- Monthly cashflow
- —
- DSCR
- —
- Eligible?
- —
Personal DTI + credit; lowest rate.
DSCR
20% down · 8.5% · 30yr
- Down + closing
- —
- Monthly P&I
- —
- Monthly cashflow
- —
- DSCR
- —
- Eligible?
- —
No personal income docs; deal must DSCR.
Hard money
10% down · 12.0% · 12mo
- Down + closing
- —
- Monthly P&I
- —
- Monthly cashflow
- —
- DSCR
- —
- Eligible?
- —
Short-term bridge; refi at stabilization.
Rent comps 27 comps
| Address | Beds | Baths | Sqft | Rent | $/sqft | DOM | Units | Dist |
|---|---|---|---|---|---|---|---|---|
| 209 36th St Unit A Lubbock, TX | 3.0 | 1.0 | 750 | $750 | $1.00 | 45d | 1 | 0.75mi |
| 211 36th St Unit B Lubbock, TX | 3.0 | 1.0 | 750 | $775 | $1.03 | 45d | 1 | 0.76mi |
| 330 37th St Unit 2 Lubbock, TX | 3.0 | 1.0 | 750 | $750 | $1.00 | 15d | 1 | 0.83mi |
| 332 37th St Unit 2 Lubbock, TX | 3.0 | 1.0 | 725 | $700 | $0.97 | 22d | 1 | 0.83mi |
| 1707 E 27th St Lubbock, TX | 1.0 | 1.0 | 672 | $725 | $1.08 | 45d | 1 | 0.90mi |
| 1707 E 27th St Lubbock, TX | 1.0 | 1.0 | 672 | $595 | $0.89 | 22d | 1 | 0.90mi |
| 609 38th St Unit B Lubbock, TX | 2.0 | 1.0 | 660 | $550 | $0.83 | 45d | 1 | 1.01mi |
| 3104 Avenue N Lubbock, TX | 2.0 | 1.0 | 750 | $785 | $1.05 | 22d | 1 | 1.13mi |
| 1915 Avenue O Unit O Lubbock, TX | 2.0 | 1.0 | 732 | $750 | $1.02 | 45d | 1 | 1.16mi |
| 1608 29th St Unit C Lubbock, TX | 1.0 | 1.0 | 680 | $650 | $0.96 | 45d | 1 | 1.23mi |
| 1608 29th St Unit B Lubbock, TX | 2.0 | 1.5 | 694 | $750 | $1.08 | 15d | 1 | 1.23mi |
| 1608 29th St Unit A Lubbock, TX | 1.0 | 1.0 | 505 | $595 | $1.18 | 15d | 1 | 1.23mi |
| 1220 Broadway St Unit 2001 Lubbock, TX | 1.0 | 1.0 | 725 | $1,350 | $1.86 | 46d | 1 | 1.26mi |
| 1220 Broadway St Lubbock, TX | 1.0–2.0 | 1.0–2.0 | 932 | $1,500 | $1.61 | 15d | 7 | 1.27mi |
| 1202 Main St Lubbock, TX | 3.0 | 1.0–2.0 | 919 | $1,341 | $1.46 | 15d | 13 | 1.32mi |
| 1102 42nd St Lubbock, TX | 1.0 | 1.0 | 574 | $495 | $0.86 | 22d | 1 | 1.34mi |
| 1604 W AVE Unit 5 Lubbock, TX | 1.0 | 1.0 | 700 | $699 | $1.00 | 45d | 1 | 1.41mi |
| 1604 W AVE Unit 8 Lubbock, TX | 1.0 | 1.0 | 700 | $699 | $1.00 | 45d | 1 | 1.41mi |
| 2604 S 2604 Ave S A Unit 2604 Lubbock, TX | 1.0 | 1.0 | 572 | $625 | $1.09 | 45d | 1 | 1.43mi |
| 1707 32nd St Lubbock, TX | 1.0 | 1.0 | 400 | $575 | $1.44 | 45d | 1 | 1.43mi |
| 4511 Avenue G Unit G Lubbock, TX | 1.0 | 1.0 | 528 | $750 | $1.42 | 15d | 1 | 1.44mi |
| 2010 Avenue S Lubbock, TX | 1.0 | 1.0 | 625 | $599 | $0.96 | 15d | 1 | 1.46mi |
| 1710 Avenue R Unit MR2 206 Lubbock, TX | 1.0 | 1.0 | 580 | $600 | $1.03 | 45d | 1 | 1.47mi |
| 1909 23rd St Lubbock, TX | 1.0 | 1.0 | 500 | $600 | $1.20 | 45d | 1 | 1.47mi |
| 1911 21st St Unit B Lubbock, TX | 2.0 | 1.0 | 714 | $750 | $1.05 | 45d | 1 | 1.49mi |
| 1917 26th St Unit B Lubbock, TX | 1.0 | 1.0 | 550 | $725 | $1.32 | 22d | 1 | 1.50mi |
| 1917 26th St Unit B Lubbock, TX | 1.0 | 1.0 | 550 | $735 | $1.34 | 45d | 1 | 1.50mi |
Listing history 5 events
-
2026-06-02status $29,000 Pending 12 DOM
-
2026-06-01days on market $29,000 Active 12 DOM
-
2026-05-31days on market $29,000 Active 11 DOM
-
2026-05-30days on market $29,000 Active 10 DOM
-
2026-05-19$29,000 Active
ⓘ Source: listings_history table (triggers on properties + properties_extension) + one-shot
backfill from property_details.listing_events for pre-trigger history.
Tax reassessment forecast TX · Resets to sale price
- Current annual tax
- $679 · $57/mo
- Projected year-2 tax
- $679 · $57/mo
- Expected delta
- $0/yr ($0/mo · 0.0%)
ⓘ Screening estimate from a state-policy table — verify with the county assessor before closing.
Climate risk First Street
- Flood 1/10 Low FEMA zone X (unshaded) · 0% chance over 30 yrs
- Wildfire 4/10 Moderate
- Heat 5/10 Major 7 d/yr ≥100°F today · 21 d/yr by 30 yrs out
- Wind 2/10 Low
- Air quality 2/10 Low 1 unhealthy d/yr today · 1 by 30 yrs out
Nearby sold comps map
Loading sold comps map…
Walkable amenities ~0.75 mi
Loading nearby amenities…
Taxation est. · year 1
- Rental income
- $10,344
- − Mortgage interest
- −$1,624
- − Property taxes
- −$679
- − Insurance
- −$145
- − Repairs & maintenance
- −$827
- − Management
- −$827
- − Depreciation
- −$844
- Taxable income
- $5,397
- Est. tax owed @ 24.0%
- −$1,295
- After-tax cash flow
- $4,227/yr
For passive investors: Depreciation is non-cash, so a rental often shows a tax loss while cash-flowing — sheltering income. Rental losses are passive: they offset passive income freely, and up to $25,000/yr can offset ordinary (W-2) income if you actively participate and your MAGI is under $100k (phasing out to $0 by $150k); unused losses carry forward. On sale, claimed depreciation is recaptured at up to 25%, and gains may owe capital-gains tax (a 1031 exchange can defer both). Figures are a year-1 estimate at your 24.0% rate — not tax advice; consult a CPA.
Schools (NCES district)
- District
- Lubbock ISD
- NCES district ID
- 4828500
- Math proficiency
- 36% ▼ -8.00%
- Reading proficiency
- 39% ▼ -1.00%
- Median HH income
- $39,820
- Composite
- 31.44/100
- National rank
- #5984
- State rank
- #481 of 826 in TX
Livability — Lubbock
- Score
- 80/100
- State rank
- #37
- US rank
- #1749
Category grades
Schools grade is shown separately in the Schools card above.
Census & demographics
- Census place
- Lubbock, TX
- County
- Lubbock County · 293,542 people
- City population
- 283,030
- Metro
- Lubbock, TX
- Population (ZIP)
- 8,529
- Household income
- $51,630
- Rent vs Own
- Severe rent burden
- 366.0
Population outlook (Lubbock County) Hauer SSP2
- Today (2025)
- 345,960 people
- By 2030
- 371,449 · +7.4%
- By 2040
- 424,539 · +22.7%
- By 2050
- 481,150 · +39.1%
- By 2075
- 633,467 · +83.1%
- By 2100
- 746,853 · +115.9%
Race, ethnicity, and origin ACS 2023
- Neighborhood character
- Diverse neighborhood (Simpson 0.60)
- Race & ethnicity
- Hispanic / Latino 55% Black 22% White 20% Two or more races 17% Native American 2%
- Hispanic origin (detail)
- Mexican 46%
- Common ancestry
- Romanian 1% Lithuanian 0%
- Foreign-born
- 5% · Canada
- Languages at home
- 64% English-only · Spanish 36%
Political lean MEDSL · Lubbock
- 2024 margin
- Solid R (+39.5) · D 29.7% · R 69.2% · Other 1.0%
- 2008→2024 swing
- -2.8pp toward R · 2008: -36.7pp · 2024: -39.5pp
- All cycles
- 2024: R+39.5 2020: R+32.2 2016: R+38.4 2012: R+40.9 2008: R+36.7
Not yet ingested
- Civics
- —
Market trends
- HPI YoY
- ▲ 3.22%
- Current HPI
- 163.854
- Rent YoY
- —
- Metro
- Lubbock, TX
- State GDP YoY
- ▲ 3.95%
- F500 in state
- 110
Industry mix (Fortune 500 HQ in TX)
| Industry | F500 HQs | Revenue |
|---|---|---|
| Energy | 16 | $1,198B |
|
||
| Technology | 5 | $198B |
|
||
| Engineering / Construction | 4 | $72B |
|
||
| Energy Services | 3 | $60B |
|
||
| Utilities | 3 | $41B |
|
||
| Healthcare | 2 | $330B |
|
||
Price history
1 event — show timeline
- 2026-05-19 Listed $29,000 LARMLS
Property tax history
+5.1%/yrLatest (2025): $679 · -8.5% YoY. Source: county tax records.
Cash-flow waterfall
monthlySold comps — $/sqft
last 12 mo · ≤1 miLoading sold comps…