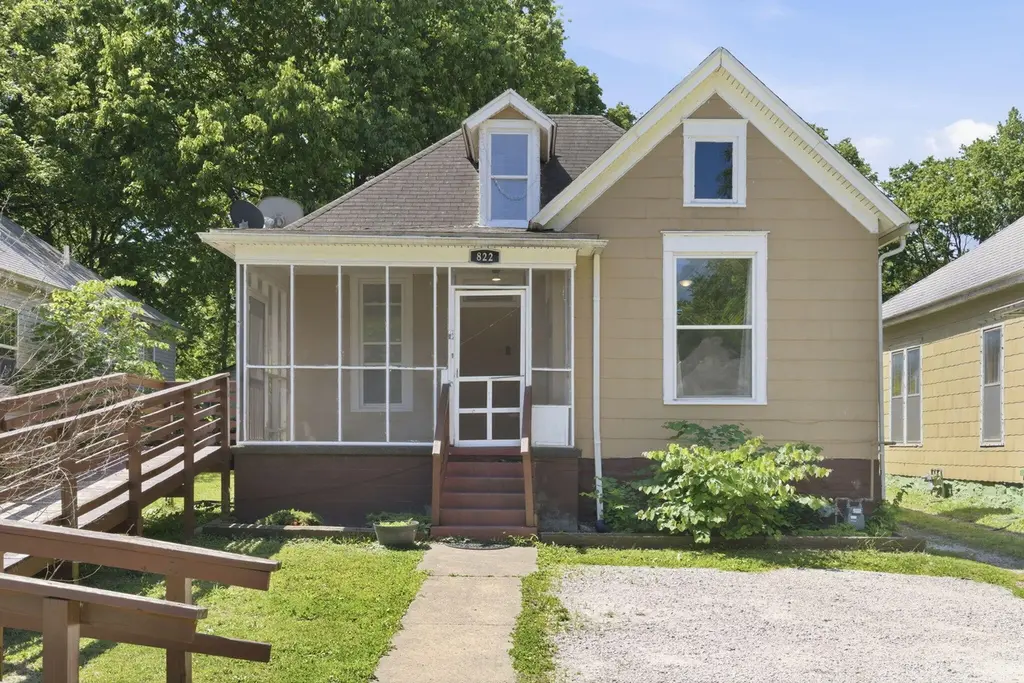
822 W Scott St · Springfield, MO
Flood risk 6/10 · Moderate
- FEMA flood zone
- X (unshaded)
- Chance of flooding over 30 yrs
- 0.73%
- Est. flood insurance / yr
- $473 – $860
Fire risk 1/10 · Minimal
- Est. fire insurance / yr
- $1,054 – $1,958
Heat risk 5/10 · Moderate
- Hot days now (above 104°F)
- 7 days/yr
- Hot days in 30 yrs
- 18 days/yr
Wind risk 2/10 · Minimal
- Chance of severe wind over 30 yrs
- —
Air-quality risk 2/10 · Minimal
- Unhealthy air days now
- 1 days/yr
- Unhealthy air days in 30 yrs
- 2 days/yr
Risk factors via First Street. Map © Google.
Why this score? — see what drove the B grade
The composite is a weighted blend of 9 inputs, each scored 0–100. Each bar is that input's sub-score; the figure is the points it added to the 100-point composite (weight × sub-score).
- Cash flow +28.5/30.0
- ARV discount +15.0/15.0
- DSCR +10.0/10.0
- 1% rule +6.8/10.0
- Livability +3.8/5.0
- Rent growth +3.7/5.0
- Schools +3.2/10.0
- Condition / age +2.5/5.0
- Appreciation +0.0/10.0
$140,000
🖨 Deal sheet (PDF) 📄 Offer letter ✓ Due diligence
Listing remarks MLS
This vintage offering features a screened in front porch, vintage wood floors, and tall ceilings in the living room, dining room, and kitchen. There are 4 bedrooms downstairs and a 5th bedroom upstairs. Spacious back yard features a privacy fence and a shop/storage building. Roof was done in 2016, HVAC and hot water heater in 2014. Windows have also been updated. Home has wheel chair ramp and has been partially modified for handicap.
Key facts
- New covered patio
- Plenty of cabinetry
- Private retreat
Tags
Property features AI
Exterior
- Parking: Parking pad; Gravel parking
- Utilities: Public water; Public sewer
- Home design: Single-family residence; Two levels
- Construction: Composition roof
- Exterior features: Patio that is covered and screened; Privacy wood fencing; Shed(s)
Interior
- Kitchen: Electric oven (free‑standing)
- Flooring: Hardwood; Tile
- Bathrooms: 1 full bathroom
- Heating & cooling: Central heating (natural gas); Central air conditioning
- Interior features: Insulated double-pane windows; Rain gutters
- Laundry & utility: Laundry on main level
Neighborhood map
What this means for you Summary
Snapshot
- This is a 3-bed/1.0-bath single-family listed at $140k.
Deal economics
- At list price, monthly cash flow is $457 ($5k/yr) — positive.
- The deal already cash-flows at list — no discount required.
- Meets the 1% rule at list price ($2k rent vs $140k).
- Cap rate 10.2% vs local median 4.6% in Springfield — top-decile yield for the area; either an underpriced asset or a hidden risk that comps aren't pricing in. Stress-test before assuming the spread holds.
Location & tenants
- Location reads 75/100 on livability (#57 in MO, #4,121 nationally) — a middle-class / working-renter tenant base. Strengths: commute A+, cost of living A+, housing A+; Watch: crime F, employment F.
- Springfield R-XII (urban): math 32% / reading 46% proficiency, ranked #174 of 324 in MO (top 54%) — families likely to look elsewhere, expect single-tenant / working-renter base with shorter leases.
- Zoned schools: Weaver Elem. (math 27% / reading 47%, grade F, #611 of 1,115 statewide, top 59%, 224 students, 91% FRL); Pipkin Middle (math 20% / reading 29%, grade F, #324 of 391 statewide, top 83%, 340 students, 82% FRL); Central High (math 42% / reading 62%, grade D+, #92 of 521 statewide, top 20%, 1,464 students, 51% FRL) — zoned schools average 75% FRL vs 46% district-wide (28 pts higher); higher-poverty schools than district average — tighter screening recommended.
- Market conditions: Rents rising fast (+4.8%/yr); 521 active listings in the ZIP; 12 comparable units currently listed for rent nearby; rentals at typical pace (median 26d on market — plan ~3-4 weeks tenant-placement turnaround); 1,302 units permitted in Greene County in 2024 (250 in 5+ unit buildings).
- This rent runs 36% of the median local income ($55k/yr) — at the standard rent-burdened threshold; future hikes will face affordability resistance.
Forward outlook
- Local home prices are declining (-3.0%/yr); year-one equity from $968 of loan paydown is wiped out by about $4k of value loss. Plan a longer hold.
- Greene County population projected at +25% by 2050 — long-run rental-demand tailwind backs the buy-and-hold thesis.
- At projected returns (-3.0% appreciation + 4.8% rent growth), your $39k cash investment doubles in ~8 years — after that, you're playing with house money.
Negotiation context
- Only 9 days on market — expect competitive offers; lowballing is unlikely to land.
- 4 sale attempts since 4y ago with the ask held roughly flat each time — persistent listings suggest the price (not the market) is what's stuck; bring a comps-based counter.
Risks & watch-outs
- Watch-outs: built in 1897 — expect roof / HVAC / electrical / plumbing capex.
- Climate carrying-cost: major flood risk; extreme-heat days projected 7→18/yr by 2055 (HVAC capex compounding) — expect insurance premiums to compound above CPI over the hold.
Questions for the listing agent
- Built in 1897 — when were the roof, HVAC, electrical panel, plumbing, and water heater last replaced?
- Is there a deadline driving the sale (1031 exchange, divorce, estate, relocation)? That informs how much negotiation room exists.
- Crime grade is F in this area — have there been break-ins, vandalism, or insurance claims at this property in the last 3 years? What carrier currently insures it and at what premium?
- What's the average days-on-market for RENTAL listings here right now (not sales)? A rising rental-DOM trend means longer vacancies and softer asking-rent achievability than the comps imply.
- What's the recent tenant-quality profile in this submarket — average credit score on applications, eviction rate, late-payment / NSF rate, and stable-employment percentage? A property-management company in the area should have these aggregated.
- How much new for-sale + rental construction is in the pipeline within 1–3 miles? Heavy new supply typically softens prices + rents 12–24 months out; constrained supply supports both.
Investment metrics
- 1% rule
- 1.18% ✓
- Cap rate
- 10.21%
- Cash-on-cash
- 13.99%
- DSCR
- 1.62
- GRM
- 7.1
CMA / ARV
- ARV (median comp)
- $184,990
- List price
- $140,000
- Delta
- -24.32%
- Verdict
- UNDERPRICED
- Comps
- 20 within 1.0 mi
Show comp detail 12 sales within ~0.75 mi
| Address | Dist | Beds/Ba | Sqft | Sold | Price | $/sf | Match |
|---|---|---|---|---|---|---|---|
| 723 W Webster St | 0.13mi | 3/1.0 | 1,751 (-8%) | 2mo | $160,000 | $91 | 79 |
| 923 W Poplar St | 0.28mi | 3/1.0 | 1,948 (+2%) | 8mo | $174,000 | $89 | 76 |
| 632 W Nichols St | 0.19mi | 4/2.0 (+1) | 1,920 (+1%) | 6mo | $209,900 | $109 | 76 |
| 926 N Missouri Ave | 0.11mi | 4/2.0 (+1) | 1,936 (+2%) | 15mo | $179,900 | $93 | 70 |
| 911 W Scott St | 0.07mi | 2/1.0 (-1) | 2,100 (+10%) | 5mo | $155,000 | $74 | 70 |
| 804 W Calhoun St | 0.16mi | 4/2.5 (+1) | 1,916 (+1%) | 19mo | $195,000 | $102 | 64 |
| 1324 W Brower St | 0.51mi | 3/2.0 | 1,865 (-2%) | 7mo | $209,999 | $113 | 63 |
| 1510 N Robberson Ave | 0.73mi | 3/2.5 | 1,904 (+0%) | 1mo | $215,000 | $113 | 59 |
| 1207 W Webster St | 0.35mi | 4/2.0 (+1) | 1,908 (+0%) | 20mo | $179,600 | $94 | 57 |
| 1452 N Grant Ave | 0.41mi | 3/2.0 | 1,849 (-3%) | 19mo | $199,000 | $108 | 56 |
| 512 W Nichols St | 0.31mi | 4/3.0 (+1) | 1,700 (-11%) | 12mo | $175,000 | $103 | 45 |
| 606 W Locust St | 0.55mi | 2/2.0 (-1) | 1,713 (-10%) | 10mo | $150,000 | $88 | 40 |
Match score weights: distance 35% · size 25% · config 20% · recency 20%. Top-matched comps best support the ARV.
Projected returns pro-forma
-3.0% appreciation · 4.82% rent growth · sell at horizon
- IRR
- 6.1%
- Equity multiple
- 1.24×
- Total profit
- $9,453
- Equity at exit
- $20,874
- IRR
- 16.9%
- Equity multiple
- 2.50×
- Total profit
- $58,648
- Equity at exit
- $12,105
Cash invested: $39,200 (down + closing). Projections, not guarantees.
Landlord ↔ Tenant lean methodology
- Overall (STATE)
- 81 Strongly Landlord-Friendly
- State Missouri
- 81 Strongly Landlord-Friendly · R+10
- County
- — inherits STATE
- City
- — inherits STATE
ZIP-level market 65802
- Home prices YoY
- -31.9%
- Rents YoY
- 4.8%
- Active inventory
- 521
- Price-to-rent
- 7.1×
Monthly cashflow live
- Estimated rent
- $1,654 high interval (Pro) →
- Mortgage (P&I)
- −$734
- Tax from tax record
- −$57 /mo · $688/yr
- Insurance
- −$58
- HOA
- −$0
- Lot rent
- −$0
- Vacancy / Maint / Mgmt
- −$347
- Net cashflow
- $457
Break-even live
Sensitivity live
| Price | -10% $536 | -5% $497 | +0% $457 | +5% $417 | +10% $378 |
|---|---|---|---|---|---|
| Rent | -10% $326 | -5% $392 | +0% $457 | +5% $522 | +10% $588 |
| Rate | -1.0pp $527 | -0.5pp $493 | base $457 | +0.5pp $421 | +1.0pp $384 |
UW: 25.0% down · 7.5% · 30yr · 1.5% tax · 5.0% vac · 8.0% maint · 8.0% mgmt
Financing live
Cash to close
- Down payment
- $35,000
- Closing costs
- $4,200
- Reserves months
- —
- Total cash needed
- —
Loan-product check · same deal, 3 products live
Conventional
25% down · 7.5% · 30yr
- Down + closing
- —
- Monthly P&I
- —
- Monthly cashflow
- —
- DSCR
- —
- Eligible?
- —
Personal DTI + credit; lowest rate.
DSCR
20% down · 8.5% · 30yr
- Down + closing
- —
- Monthly P&I
- —
- Monthly cashflow
- —
- DSCR
- —
- Eligible?
- —
No personal income docs; deal must DSCR.
Hard money
10% down · 12.0% · 12mo
- Down + closing
- —
- Monthly P&I
- —
- Monthly cashflow
- —
- DSCR
- —
- Eligible?
- —
Short-term bridge; refi at stabilization.
Rent comps 12 comps
| Address | Beds | Baths | Sqft | Rent | $/sqft | DOM | Units | Dist |
|---|---|---|---|---|---|---|---|---|
| 501 W Central St Springfield, MO | 4.0 | 2.0 | 2000 | $2,200 | $1.10 | 26d | 1 | 0.37mi |
| 235 N Market Ave Springfield, MO | 1.0–4.0 | 1.0–2.0 | 1350 | $1,383 | $1.02 | 26d | 5 | 0.78mi |
| 235 N Market Ave Springfield, MO | 1.0–4.0 | 1.0–2.0 | 1350 | $1,383 | $1.02 | 16d | 4 | 0.78mi |
| 520 W Olive St Springfield, MO | 3.0 | 2.0 | 1445 | $1,538 | $1.06 | 16d | 5 | 0.78mi |
| 138 Park Central Sq Springfield, MO | 1.0–2.0 | 1.0–2.0 | 1083 | $2,489 | $2.30 | 16d | 8 | 0.86mi |
| 211 S Market Ave Springfield, MO | 2.0–4.0 | 1.0–2.0 | 1442 | $1,862 | $1.29 | 26d | 5 | 0.86mi |
| 211 S Market Ave Springfield, MO | 2.0–4.0 | 1.0–2.0 | 1442 | $1,862 | $1.29 | 24d | 5 | 0.86mi |
| 710 W Walnut St Springfield, MO | 3.0 | 2.0 | 1350 | $1,695 | $1.26 | 46d | 1 | 0.90mi |
| 539 S Fort Ave Springfield, MO | 2.0 | 1.0 | 1500 | $1,025 | $0.68 | 16d | 1 | 1.13mi |
| 630 S Market Ave Springfield, MO | 3.0 | 2.0 | 1758 | $2,150 | $1.22 | 46d | 1 | 1.20mi |
| 1439 N Texas Ave Springfield, MO | 4.0 | 2.0 | 1608 | $1,195 | $0.74 | 46d | 1 | 1.22mi |
| 1442 N Texas Ave Springfield, MO | 3.0 | 2.0 | 1626 | $1,400 | $0.86 | 46d | 1 | 1.25mi |
Listing history 14 events
-
2026-06-23status $140,000 Active 9 DOM
-
2026-06-03status $140,000 Pending 9 DOM
-
2026-06-02days on market $140,000 Active 9 DOM
-
2026-06-01days on market $140,000 Active 8 DOM
-
2026-05-31days on market $140,000 Active 7 DOM
-
2026-05-30days on market $140,000 Active 6 DOM
-
2026-05-14$140,000 Active 462-char remark
-
2024-02-27soldstatus Closed 438-char remark
Show marketing remark (438 chars)
This vintage offering features a screened in front porch, vintage wood floors, and tall ceilings in the living room, dining room, and kitchen. There are 4 bedrooms downstairs and a 5th bedroom upstairs. Spacious back yard features a privacy fence and a shop/storage building. Roof was done in 2016, HVAC and hot water heater in 2014. Windows have also been updated. Home has wheel chair ramp and has been partially modified for handicap.
-
2024-01-18status Pending 438-char remark
Show marketing remark (438 chars)
This vintage offering features a screened in front porch, vintage wood floors, and tall ceilings in the living room, dining room, and kitchen. There are 4 bedrooms downstairs and a 5th bedroom upstairs. Spacious back yard features a privacy fence and a shop/storage building. Roof was done in 2016, HVAC and hot water heater in 2014. Windows have also been updated. Home has wheel chair ramp and has been partially modified for handicap.
-
2024-01-12$96,000 Active 438-char remark
Show marketing remark (438 chars)
This vintage offering features a screened in front porch, vintage wood floors, and tall ceilings in the living room, dining room, and kitchen. There are 4 bedrooms downstairs and a 5th bedroom upstairs. Spacious back yard features a privacy fence and a shop/storage building. Roof was done in 2016, HVAC and hot water heater in 2014. Windows have also been updated. Home has wheel chair ramp and has been partially modified for handicap.
-
2022-10-20soldstatus Closed
Show marketing remark (520 chars)
Check out this charming vintage 3 bedroom home. A little TLC would make this home into a great home or rental. Check out the wood floors under the rugs and tall ceilings in the living, dining, kitchen areas. Great screened in front porch. Upstairs attic is finished and could be used as 4th bedroom or bonus room. Privacy fenced backyard. Close to parks, amenities, and schools including Drury and OTC. Roof was done in 2016. HVAC and Hot Water Heater 2014. Windows have been updated as well. Property will be sold AS-IS
-
2022-10-09status Pending
Show marketing remark (520 chars)
Check out this charming vintage 3 bedroom home. A little TLC would make this home into a great home or rental. Check out the wood floors under the rugs and tall ceilings in the living, dining, kitchen areas. Great screened in front porch. Upstairs attic is finished and could be used as 4th bedroom or bonus room. Privacy fenced backyard. Close to parks, amenities, and schools including Drury and OTC. Roof was done in 2016. HVAC and Hot Water Heater 2014. Windows have been updated as well. Property will be sold AS-IS
-
2022-10-04$69,900 Active
Show marketing remark (520 chars)
Check out this charming vintage 3 bedroom home. A little TLC would make this home into a great home or rental. Check out the wood floors under the rugs and tall ceilings in the living, dining, kitchen areas. Great screened in front porch. Upstairs attic is finished and could be used as 4th bedroom or bonus room. Privacy fenced backyard. Close to parks, amenities, and schools including Drury and OTC. Roof was done in 2016. HVAC and Hot Water Heater 2014. Windows have been updated as well. Property will be sold AS-IS
-
2000-08-17soldstatus
ⓘ Source: listings_history table (triggers on properties + properties_extension) + one-shot
backfill from property_details.listing_events for pre-trigger history.
Tax reassessment forecast MO · Resets to sale price
- Current annual tax
- $688 · $57/mo
- Projected year-2 tax
- $1,358 · $113/mo
- Expected delta
- +$670/yr (+$56/mo · 97.5%)
ⓘ Screening estimate from a state-policy table — verify with the county assessor before closing.
Climate risk First Street
- Flood 6/10 Major FEMA zone X (unshaded) · 73% chance over 30 yrs
- Wildfire 1/10 Low
- Heat 5/10 Major 7 d/yr ≥104°F today · 18 d/yr by 30 yrs out
- Wind 2/10 Low
- Air quality 2/10 Low 1 unhealthy d/yr today · 2 by 30 yrs out
Nearby sold comps map
Loading sold comps map…
Walkable amenities ~0.75 mi
Loading nearby amenities…
Taxation est. · year 1
- Rental income
- $19,849
- − Mortgage interest
- −$7,842
- − Property taxes
- −$688
- − Insurance
- −$700
- − Repairs & maintenance
- −$1,588
- − Management
- −$1,588
- − Depreciation
- −$4,073
- Taxable income
- $3,371
- Est. tax owed @ 24.0%
- −$809
- After-tax cash flow
- $4,674/yr
For passive investors: Depreciation is non-cash, so a rental often shows a tax loss while cash-flowing — sheltering income. Rental losses are passive: they offset passive income freely, and up to $25,000/yr can offset ordinary (W-2) income if you actively participate and your MAGI is under $100k (phasing out to $0 by $150k); unused losses carry forward. On sale, claimed depreciation is recaptured at up to 25%, and gains may owe capital-gains tax (a 1031 exchange can defer both). Figures are a year-1 estimate at your 24.0% rate — not tax advice; consult a CPA.
Schools (NCES district)
- District
- Springfield R-XII
- NCES district ID
- 2928860
- Math proficiency
- 32% ▼ -2.00%
- Reading proficiency
- 46% ▼ -3.00%
- Median HH income
- $37,886
- Composite
- 32.45/100
- National rank
- #5717
- State rank
- #174 of 324 in MO
Livability — Springfield
- Score
- 75/100
- State rank
- #57
- US rank
- #4121
Category grades
Schools grade is shown separately in the Schools card above.
Census & demographics
- Census place
- Springfield, MO
- County
- Greene County · 244,327 people
- City population
- 223,044
- Metro
- Springfield, MO
- Population (ZIP)
- 46,739
- Household income
- $55,019
- Rent vs Own
- Severe rent burden
- 1818.0
Population outlook (Greene County) Hauer SSP2
- Today (2025)
- 319,054 people
- By 2030
- 335,135 · +5.0%
- By 2040
- 366,186 · +14.8%
- By 2050
- 397,431 · +24.6%
- By 2075
- 477,035 · +49.5%
- By 2100
- 520,828 · +63.2%
Race, ethnicity, and origin ACS 2023
- Neighborhood character
- Predominantly White (81%)
- Race & ethnicity
- White 81% Two or more races 8% Hispanic / Latino 5% Black 4% Asian 2%
- Common ancestry
- Slovak 2% Lithuanian 2% Italian 2%
- Foreign-born
- 3% · Canada, Vietnam
- Languages at home
- 95% English-only · Spanish 2% Vietnamese 1% Other Indo-European 1%
Political lean MEDSL · Greene
- 2024 margin
- Strong R (+20.8) · D 38.9% · R 59.7% · Other 1.4%
- 2008→2024 swing
- -5.0pp toward R · 2008: -15.8pp · 2024: -20.8pp
- All cycles
- 2024: R+20.8 2020: R+20.1 2016: R+27.4 2012: R+24.4 2008: R+15.8
Not yet ingested
- Civics
- —
Market trends
- HPI YoY
- ▼ -99.72%
- Current HPI
- 212.9826
- Rent YoY
- ▲ 4.82%
- Metro
- Springfield, MO
- State GDP YoY
- ▲ 1.84%
- F500 in state
- 20
Industry mix (Fortune 500 HQ in MO)
| Industry | F500 HQs | Revenue |
|---|---|---|
| Healthcare | 1 | $163B |
|
||
| Insurance | 1 | $21B |
|
||
| Industrial Technology | 1 | $17B |
|
||
| Retail | 1 | $16B |
|
||
| Industrial Distribution | 1 | $10B |
|
||
| Utilities | 1 | $9B |
|
||
Price history
+100.3% since first listed11 events — show timeline
- 2026-06-02 Pending — SOMO
- 2026-05-28 Relisted — SOMO
- 2026-05-19 Pending — SOMO
- 2026-05-14 Listed $140,000 SOMO
- 2024-02-27 Sold (MLS) — SOMO
- 2024-01-18 Pending — SOMO
- 2024-01-12 Listed $96,000 SOMO
- 2022-10-20 Sold (MLS) — SOMO
- 2022-10-09 Pending — SOMO
- 2022-10-04 Listed $69,900 SOMO
- 2000-08-17 Sold (Public Records) — Public Records
Property tax history
+3.4%/yrLatest (2025): $688 · +24.4% YoY. Source: county tax records.
Cash-flow waterfall
monthlySold comps — $/sqft
last 12 mo · ≤1 miLoading sold comps…